Other Mining Stocks

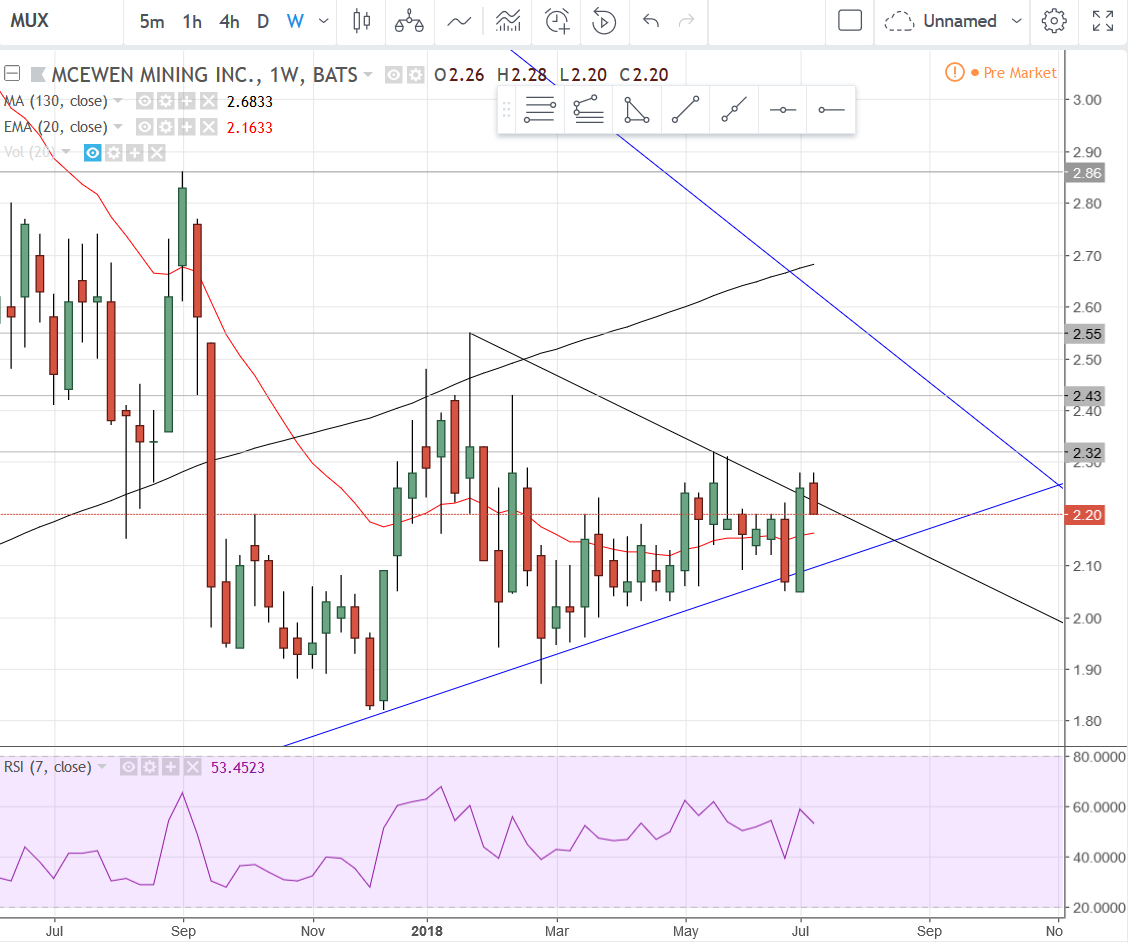
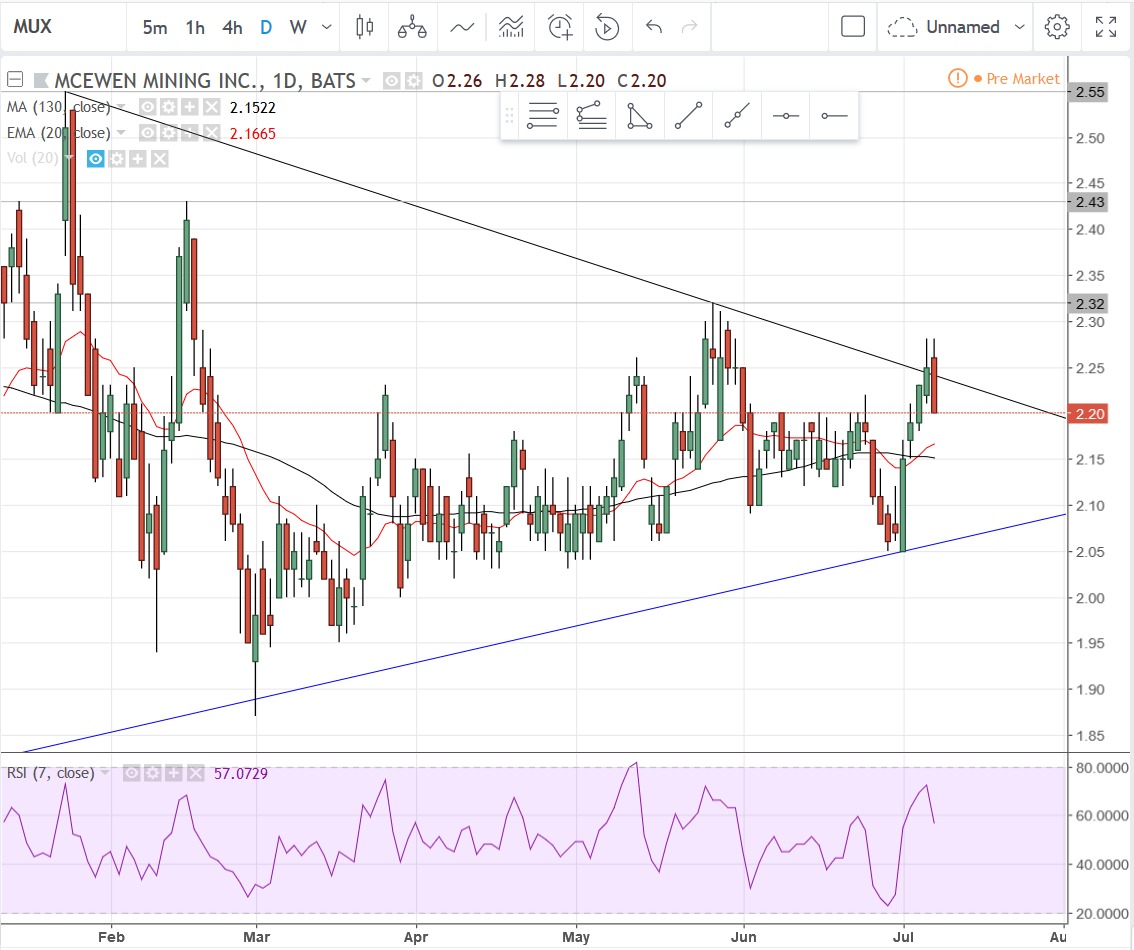
MUX: First is the weekly interval, second is the daily interval. Both show a false breakout of a short term downtrend line. No biggy there. Watch the 20 EMA on both intervals for support. MUX continues to move more or less in unison with gold. There’s not a lot more to say for now. Keep the previously mentioned resistance levels in mind on any upward moves.

1 Like

Here’s the weekly interval gold futures chart. Although gold has dropped below the 20 EMA and 130 MA, it’s testing an uptrend line now and the RSI indicator is in oversold territory. It has also tested the 50% retracement level of the last major low from late 2016. If gold moves lower, watch for support at the 61.8% retracement at 1218.

I’ll cover oil and the dollar later on. So far oil is looking like it could go higher, but I’m still anticipating more of a drop for an entry.

2 Likes

Are copper, gold & silver telling us we’re fixing’ to go into a recession??? Oil too??

I had a request for AG, First Majestic Silver, so here it is…

The first chart is the weekly interval. If I’m invested or investing in this (I don’t have a position) there are some very simple things I’m watching. On the first chart, look at the black 130 MA going from far left to right. The first time it was touched it acted as resistance for a month while a flag formed. The breakout occurred on the 5th week and oh what a breakout it was! Then look where it went on the long pullback… the 130 MA again. Took a little dip below it and then popped upward again. It did this 3 more times and then fell through and lost the 130 MA support. When it tried to go higher, on three occasions over the course of about 6 months, the 130 was the stopping point each time. (Hopefully you’re getting my point).

From about February this year AG has made quite a linear move from $5 to about $8.50, where it again hit the 130 MA resistance and has pulled back. Ideally, you want that red 20 EMA to hold as support, or at least the $7 mark. So that’s what I’m watching on the weekly.

Now here’s what I’d watch on the daily interval. You’ve got the 20 EMA here that has been a decent support area. Today’s candle should be telling because on the run this stock has had this year, any drop below the 20 EMA on the daily interval chart only lasted a day, so if it closes below today, it’s not a good omen unless you want cheaper prices. If it does move lower, watch the Fibonacci retracement levels which are the colored numbers to the far right of the chart, the 50 and 61.8% levels in particular. Also of note, the daily 130 MA is lingering just below the 50% retracement level, so you’ve got a double level of support, which, if it holds, should provide a very nice buying opportunity. If it does not hold and drops below the 61.8% level without showing much strength then I’d be getting concerned if I was long.

3 Likes

GOLD

A quick update for now. I feel fairly confident that gold will go higher from here based upon the way it has been toying with that uptrend line. It looks like it’s taunting traders to get short, having two breakdowns, one which proved to be false and the second playing out that way at the moment. It’s hanging right around that 50% retracement level so far. I’ll update probably this weekend, barring I stay away from mayonnaise (the cause of last weekend’s yuckiness).

5 Likes

Hey TR - thanks for the charts and all useful info provided. Johnny Mac~

2 Likes

Hi T-Rick …I have been on these boards for over 10+ years or more. I mostly stay on the sidelines as my writing skills sometimes lack compaired to some of our more educated posters.
I am one that reads and comprehends well they say, just lack writing skills.
So I DO enjoy reading all of these boards. The are very informative to my mind.
I find your posts to be amongst some of the best. I am but a small fish in this investing pond, but
have been in this pond since high school 1969 a teacher wanted to give us (kids) some
knowledge about compound interest, and compound debit. A great guy, schools need more like him.
He showed use the stock market page of the newspaper, and said to pick a couple and follow them.
My father Dad went farther and said "lets put some moneys into some of your picks.
So that was the start. I still try my educated luck. at the market once in a while… hell that’s why I still hold MDMN CDCH. Would love to know more on how it works… Just don’t have the time.
So when I see and read your postings, I feel like I have a better understanding of how the
racket works. So you get a big “YES” from me. Keep it coming. Ill read it all.
Take care… Dj.

2 Likes

I have no idea with regards to charts but I appreciate your renewed enthusiasm. I will look forward to your postings once M/C is worthy.

McEwen Mining Reports Q2 2018 Production Results

https://www.marketwatch.com/press-release/mcewen-mining-reports-q2-2018-production-results-2018-07-16?siteid=nbsh

4 Likes

AG Update

Nothing new to report on the weekly interval. Price is sandwiched between the 130 MA and 20 EMA in a range between 8.32 and 7.13.

On the daily interval it appears to be repeating what it has consistently done since it got back above (for the most part) the red 20 EMA. It teases a break of support only to turn around and make new highs. I don’t know how long this pattern will continue, but the formation of the last two candles is consistent with what it has done on the previous three lows, where it looks like it makes a bear flag and then moves higher out of it. Silver futures are up a little this morning, so perhaps that bodes well here.

If there is a drop lower, the last swing low was right around where the 38% retracement sits, and below that is the 130 MA a smidge below the 50% retracement.

2 Likes

Gold Futures (GC)

Here is a weekly interval chart of gold. What is interesting to me is that the uptrend line now appears to have become resistance this week. Are we headed for the 62% retracement? I don’t know but that RSI indicator at the bottom of the chart is pretty low. Perhaps I’m being too optimistic, but I still think this price action is to get bears loading up only to take them out and squeeze them higher. Otherwise, watch for the 62% retracement level.

I’m not going to post the daily interval, but the RSI is showing divergence, another sign of potential reversal, in this case higher prices. We’ll see.

3 Likes

Silver Futures (SI)

This is the weekly interval for silver futures. Silver has become incredibly boring. A few years ago I traded it exclusively and was doing very well, and then they raised the margin to such preposterous levels that all of the relatively “little guys” like myself gave it the finger and moved on. Now it’s not worth much of anything for trading, even though the margins have been dropped to more reasonable levels.

This weekly interval chart is showing a long narrow price consolidation with 15.50 basically being the floor. This formation within the blue trend lines makes me think it’s a bit of a bullish wedge formation, in which case there will be an eventual launch back to previous highs at $20 - $21, but there is so much price manipulation in gold and silver that it’s hard for me to literally bet on it.

4 Likes

TR - love this type of lesson. Tks, Johnny

1 Like

The weekly interval MUX chart looks like it might be ready to make a move higher out of a flag formation. The black downtrend line looks to be potential support now along with the red 20 EMA turning upwards just below the trend line. Now we watch those support levels along with the three grey overhead resistance lines at 2.32, 2.43, and 2.55, along with the blue long-term downtrend line.

3 Likes

MUX Q2 Report is out.
Summary:

McEwen Mining reports Q2 production results

Jul. 16, 2018 10:10 AM ET|About: McEwen Mining Inc. (MUX)|By: Vandana Singh, SA News Editor
McEwen Mining (MUX +0.9%) reports Q2 consolidated production of 36,959 (+66.5%) gold ounces and 772,432 (-0.9%) silver ounces, or 47,258 gold equivalent ounces.

In July 2018, new Preliminary Economic Assessment study on the potential restart of production from the El Gallo Complex (Project Fenix), was published.

Select outcomes from the assessment: Average annual production rate of ~47,000 ounces gold equivalent, low initial capital cost of $41M for Phase 1 and $30M for Phase 2, and pay-back period of 4.1 years.

As of July 9, 2018, the company was debt-free with liquid assets of ~$30M.
McEwen Mining reports Q2 production results (NYSE:MUX) | Seeking Alpha

Full report link here:

McEwen Mining Reports Q2 2018 Production Results
July 16, 2018

TORONTO, July 16, 2018 (GLOBE NEWSWIRE) – McEwen Mining Inc. (NYSE:MUX) (TSX:MUX) reports consolidated production for Q2 2018 of 36,959 gold ounces and 772,432 silver ounces, or 47,258 gold equivalent ounces(1)(“GEOs”), using a 75:1 gold to silver ratio.

http://www.mcewenmining.com/investor-relations/press-releases/press-release-details/2018/McEwen-Mining-Reports-Q2-2018-Production-Results/default.aspx

TradeRich, you should come to our telegram, we would welcome someone with your knowledge.

Life is not to be boring… Find another hobby helps.
I was bored during the snow months…Then I threw my hat into the volunteer ring at the local high school.
In metal shop classes, helping young adults both men and ladies learn how to weld.,
That was three years ago, and haven’t regretted since. Very rewarding.
When schools out for summer, I have enough other things to keep me busy. The “To do lists”.
Which I should get at… but I really came here to ask about charts on this stock
GTN. I can only afford small fish in this price range now days.
Thanks in advance. Take care. Cold S.

Thanks for the advice CS. I’m not really bored. I’ve posted it a few times with intent to be humorous and I know humor doesn’t always come across in writing so my bad.

As for GTN, I’m assuming that this is an investment, so I’m posting the weekly and daily intervals and commenting from an investor’s perspective and not a swing trader’s.

This stock is having a nice, strong uptrend so far. I laid out the Fib retracement from the last major low to the recent 17.80 high. It did a nice 62% retracement and appears to be looking to retest the high. Before doing so, if you look at the RSI line, highlighted at the bottom portion of the chart, GTN is overbought on this large time frame so I would expect some sideways movement and even some retracement back to the red 20 EMA, which is currently around 13.60 and moving sharply higher each day. If it dips below that you’ve got the 130 MA currently just under $13 and starting to turn upward which is good. As for immediate resistance, you have the black downtrend line currently just below $17, and then the previous high at 17.80.

Next chart is a daily interval, which tells a slightly different story. The pullback that has occurred from the highlighted area, again showing trend line resistance, held the 20 EMA on this time frame and the cluster of 15 candles may be forming a bull flag. I notice that this stock tends to have a 5 cent spread, which means it moves in 5 cent increments instead of penny increments. That will make the charts and formations look more “clunky” and a little harder to interpret, but the tools still work well enough. If I’m long this stock I want to see more of a consolidation with price drifting a little lower so that the weekly RSI makes some room for more upside. The blue horizontal lines on the chart are major support/resistance areas, and I wouldn’t mind seeing even an eventual retest of the 13.35 support area before making a run for previous and/or new highs.

Overall the stock looks strong. I would become concerned if it revisits the 17.80 high and has trouble moving higher. You would want to be watching closely to make sure a double top hasn’t formed. I would also not like seeing price linger for too long at the 13.35 support, especially if there appears to be continued selling below it. Feel free to ask at any time in the future for an update.

Almost all the commodity space is falling now. Look at the last 30/60 days in copper. Commodities have been closely tied to the Chinese economy since the initial big price increase from 2009 to 2011. The last 30/60 days do not look promising. I have seen YouTube videos from English speaking folks living in China made in the last month saying that housing prices are starting to fall in China. And I have read totally separate accounts that the same is happening in Austrailia, which is closely tied to China and their building boom / commodities / mining.

Combined with the falling Chinese currency against the USD and official credit creation data out of China all points to a slow down -> now showing up in all the commodity prices. The U.S. has not felt much yet, probably due to the tax cut / fiscal stimulus. But all of this seems to indicate evidence that the emerging overall trend is a slowing / down trend in commodities.

If you go back a couple of weeks I probably made the exact wrong call in the copper price suggesting it was about to go over $3.30. Now down to $2.76.

2 Likes

Yes TradeRich, great day for Bitcoin today.