Thanks, Rich
You’re welcome
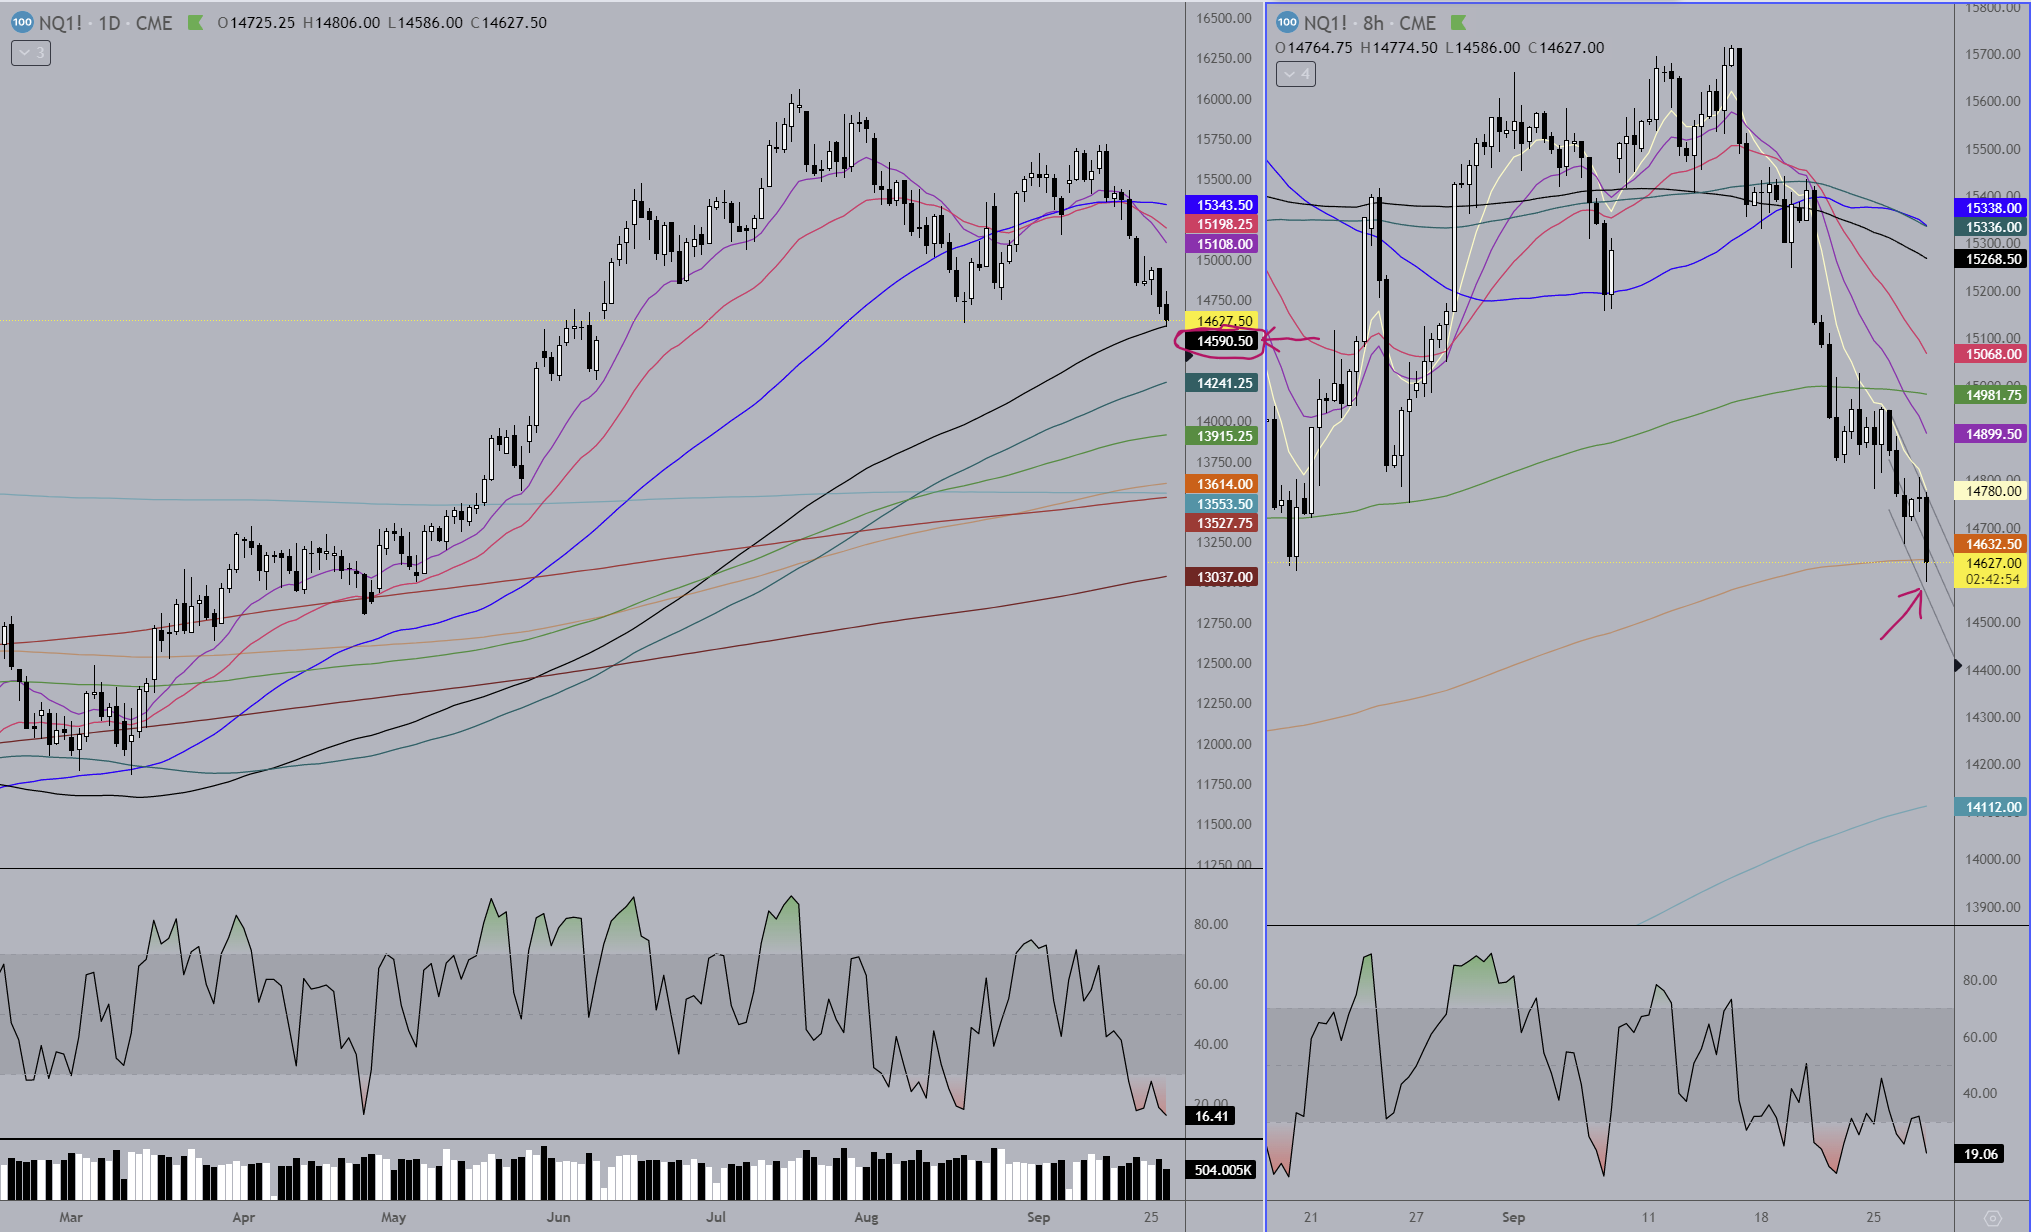
I posted the following on a site I subscribe to a little before 2:30 EST today. I may have nailed the bottom of the market drop. Even if we go lower, I don’t think it will be very much more and there’s a good chance the market will rally for the next couple months. The Nasdaq (Futures which is NQ) bounced strongly off the black MA today. There is lots of economic data out tomorrow and Jerome Powell is speaking somewhere after the market close so things could get interesting.
Rich says:
NQ Bottom?
2 conditions: Black 130 MA on the daily chart holds to the close. 2. The lower channel line wasn’t hit (yet) with the current 8 hr candle. Can be a sign the reversal is occurring.
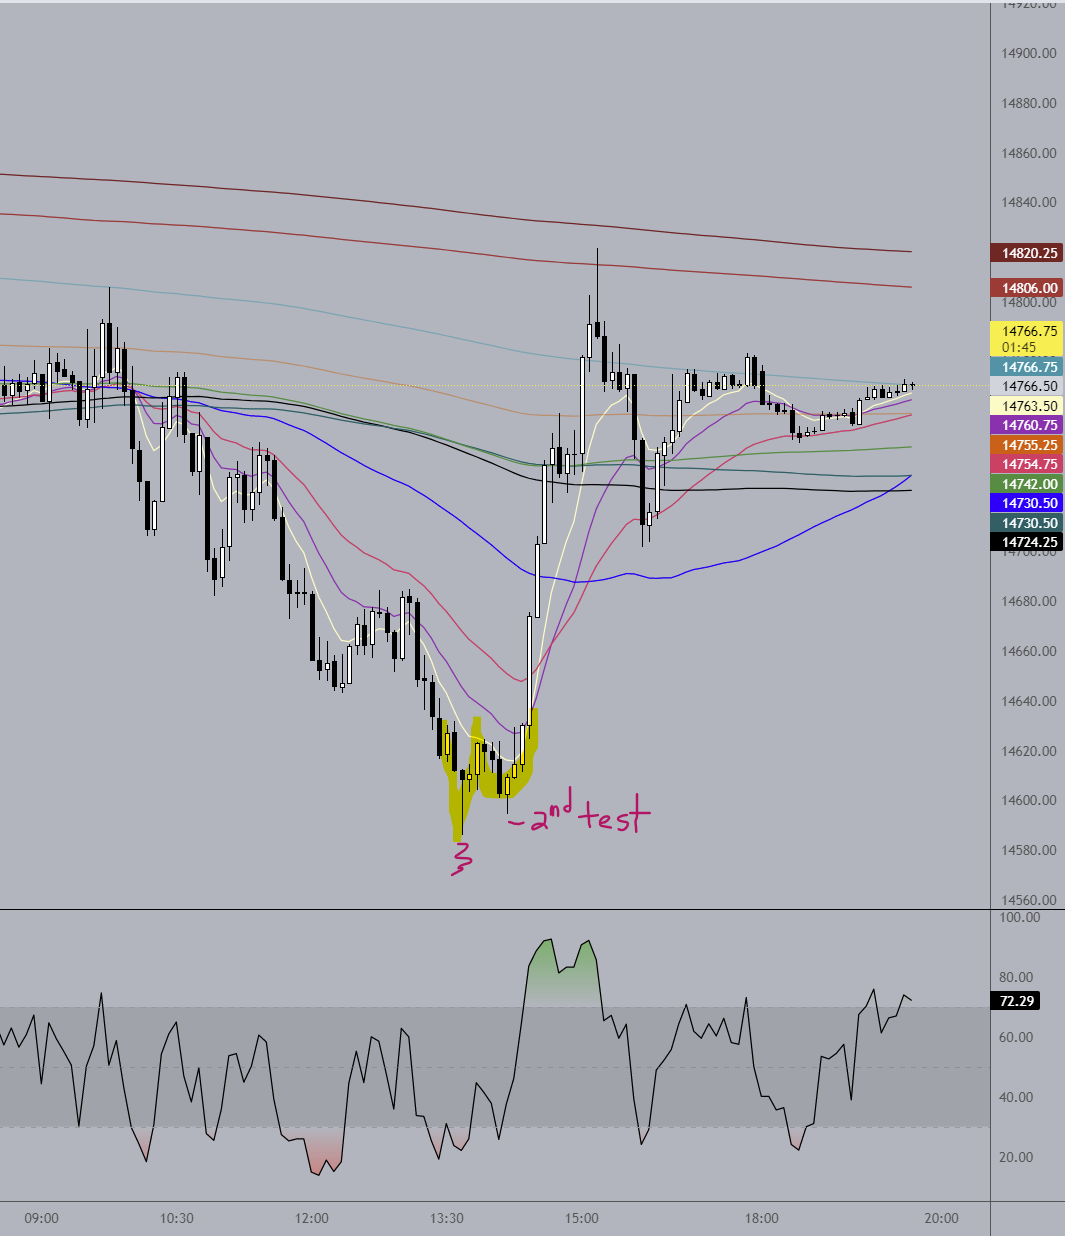
There’s also a familiar bottoming pattern now forming on the NQ 5 min chart. Doesn’t always work of course but if it does we should be getting an explosive move upward shortly. (It’s great for big moves doing futures scalps but in this case it might be a sign of a bottom).
Just my .02 and some things to keep an eye on.
Here’s the move that occurred on the 5 min chart right after the test of the daily 130MA. The formation is an adam & eve bottom.
Since the uptrend in the dollar is still very much intact I got out of my market longs today. More downside might be coming.
Since there is little activity here I’m going to direct my attention elsewhere. You kids have fun and take care! ![]()
1 Like
Hi TR,
More than a month has pasted with a lot going on in the world. A favor if you’re up to it and can find time for a few charts of interest. Yesterday I sold off some of my Comeco (CCJ) as it was looking somewhat overbought. It has a large short interest so it may continue to still go higher. I’m looking to add to my positions in URA and UEC as alternatives. Any sense you can make to these charts in the short and long time frames?
Decisions between value stocks or growth stocks?
I’ll just mention two I favor.
I’ve a large position in Silver Majestic that is quite underwater at the present time. I checked daily, weekly and monthly charts. The charts look like it may be near a bottom.
Does AG chart look like a bottom to you also? Could this double within a year? Monthly resistance is around 14?
I just started a position yesterday morning in a speculative stock located in Idaho. A lot of info for DD on their website. Some say it may take up to 3 years to really mature to potentially a 5-10X. REVIVAL GOLD INC (RVLGF) bought at 0.25. Look interesting to anyone else?
There are many more spec and value charts underwater. I have quite a few in Nevada, Canada and Newfoundland. Perhaps a few others on this thread might request a few of their favorites to make this thread more useful and interesting. The market appears quite unpredictable right now, Your charts have shown potential target prices and resistance levels for some of these. I very much appreciate your chart analysis.
TIA
EZ
1 Like
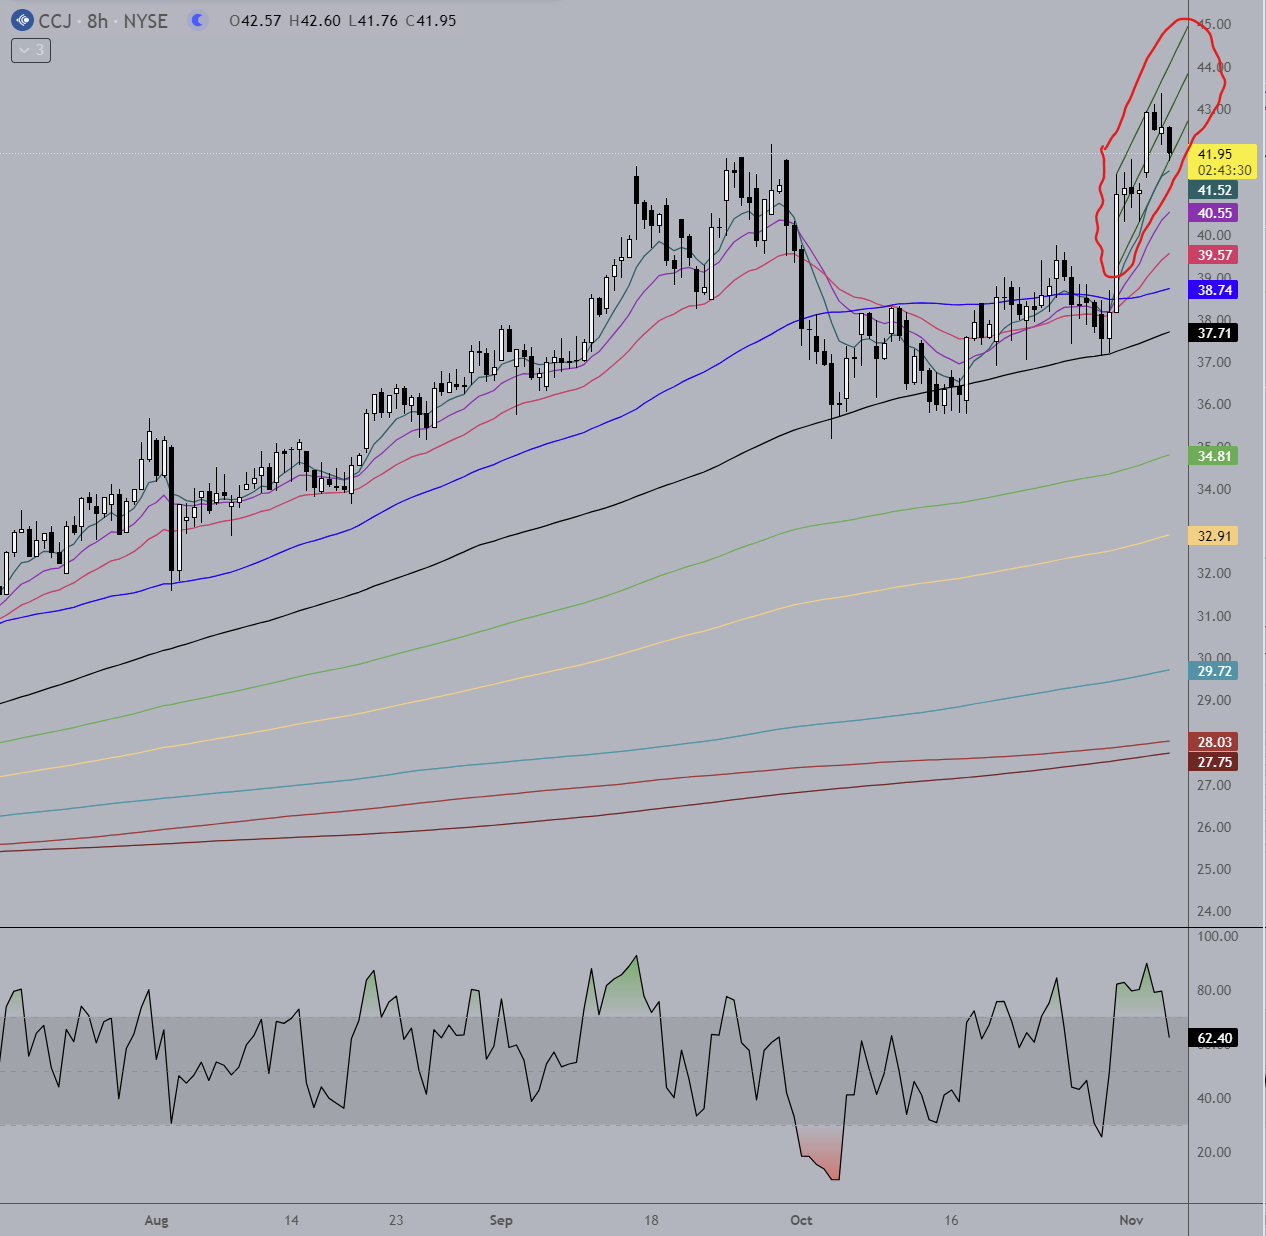
CCJ
Your timing may turn out to be impeccable here. The first chart is an 8 hr interval. There is a perfect rising channel drawn with the close right on the lower channel line. Price will very likely break down out of this channel next week, if not pre-market Monday. When you see a rising channel form, usually on an interval chart (smaller time frame than the daily), after a long uptrend it is a sign that the top is near and take your profits. Same if you see a falling channel form at the bottom of a long downtrend… time to get on for the ride up.
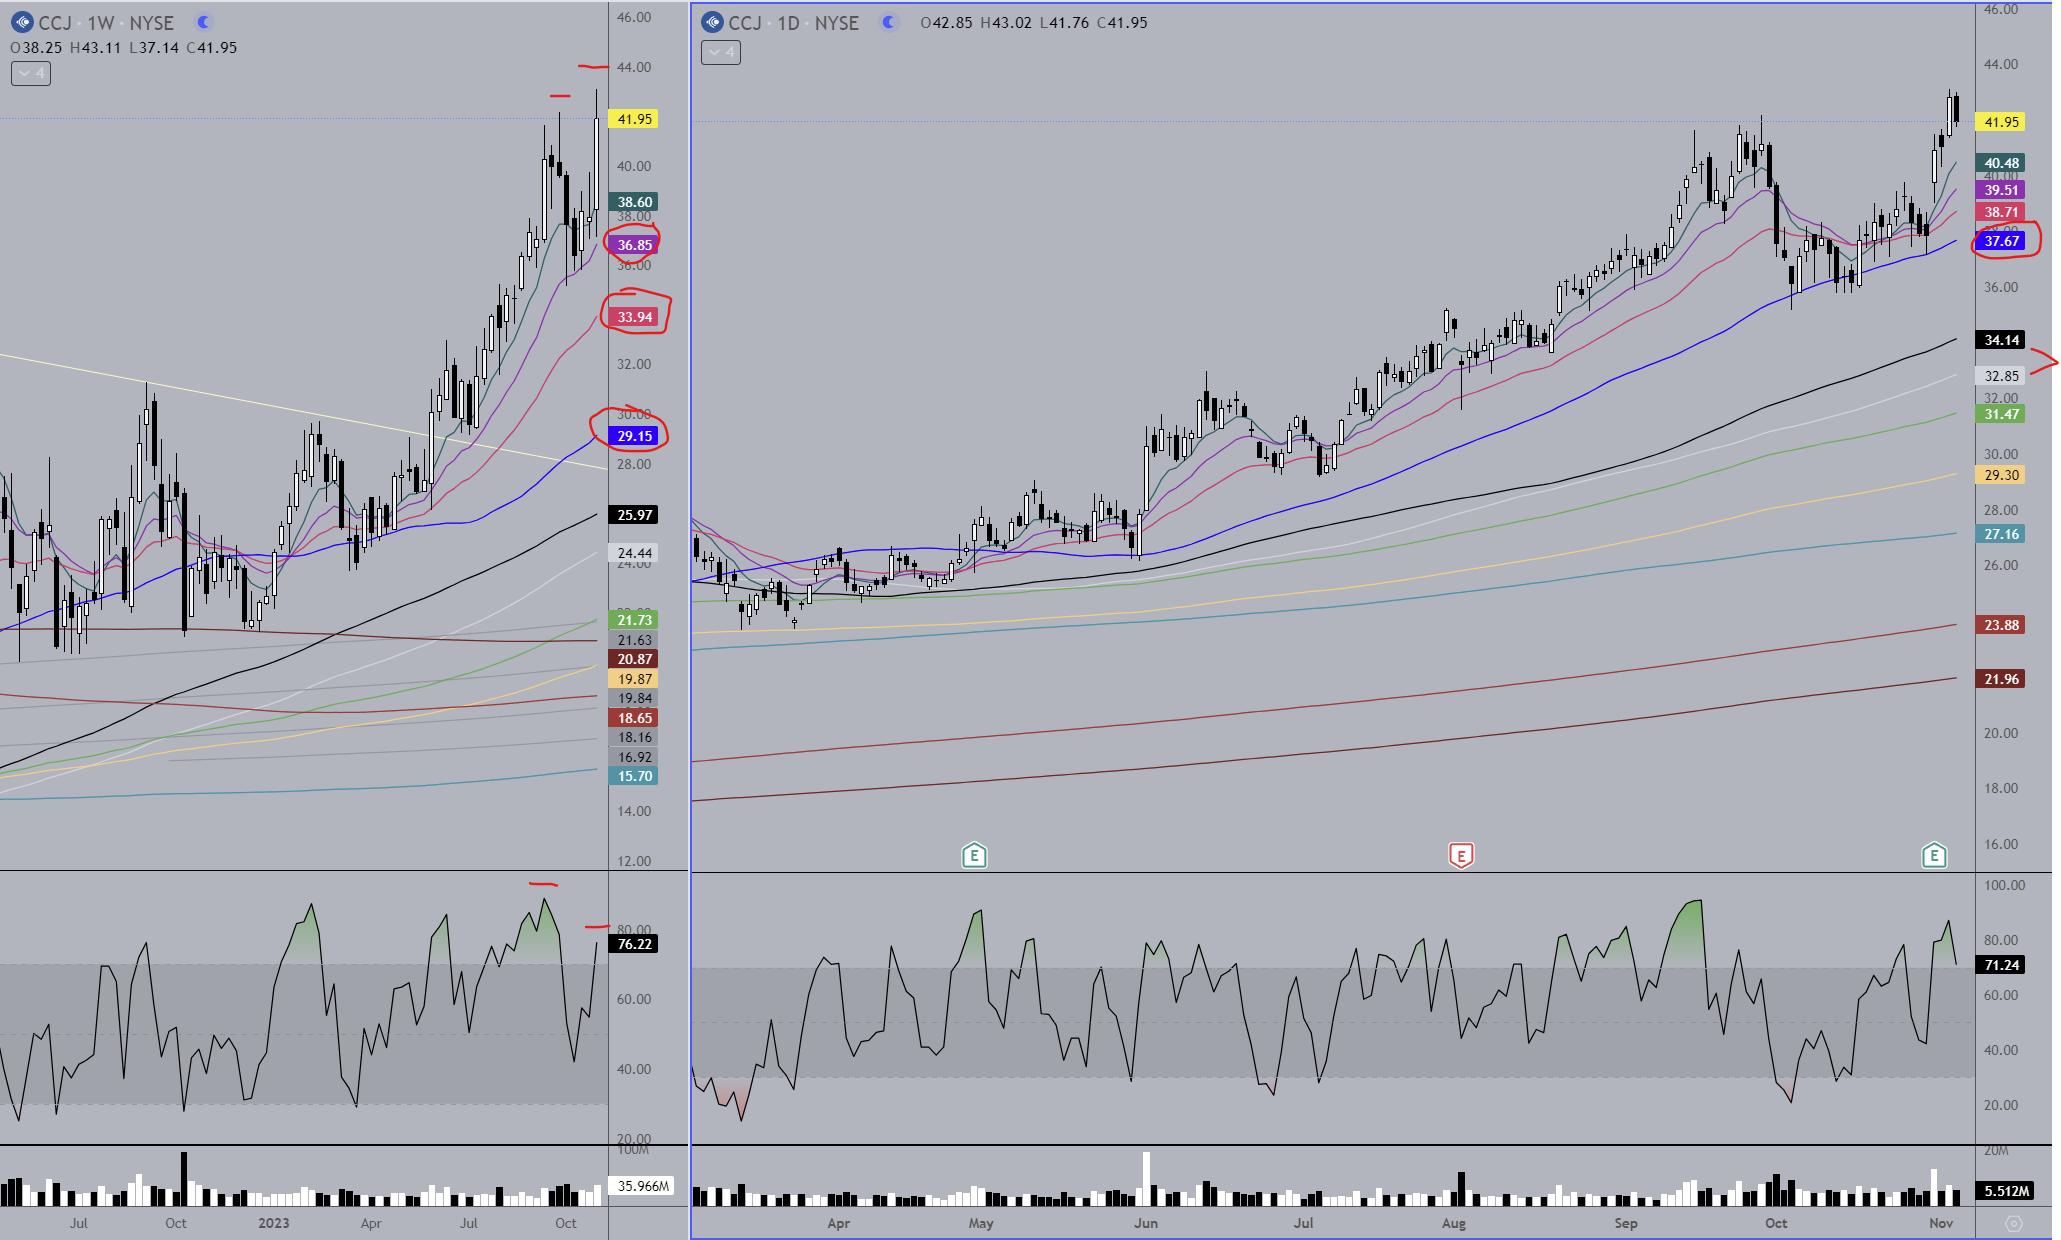
As far as where to buy back, the next chart is the weekly/daily intervals. Watch the violet, red, blue, black and silver MA levels (which obviously are going to change each week/day, but I can update upon request). Each of those MA’s are likely areas of support where an uptrend will resume from after a retracement. If the black/silver are lost, then the uptrend is likely over.
1 Like
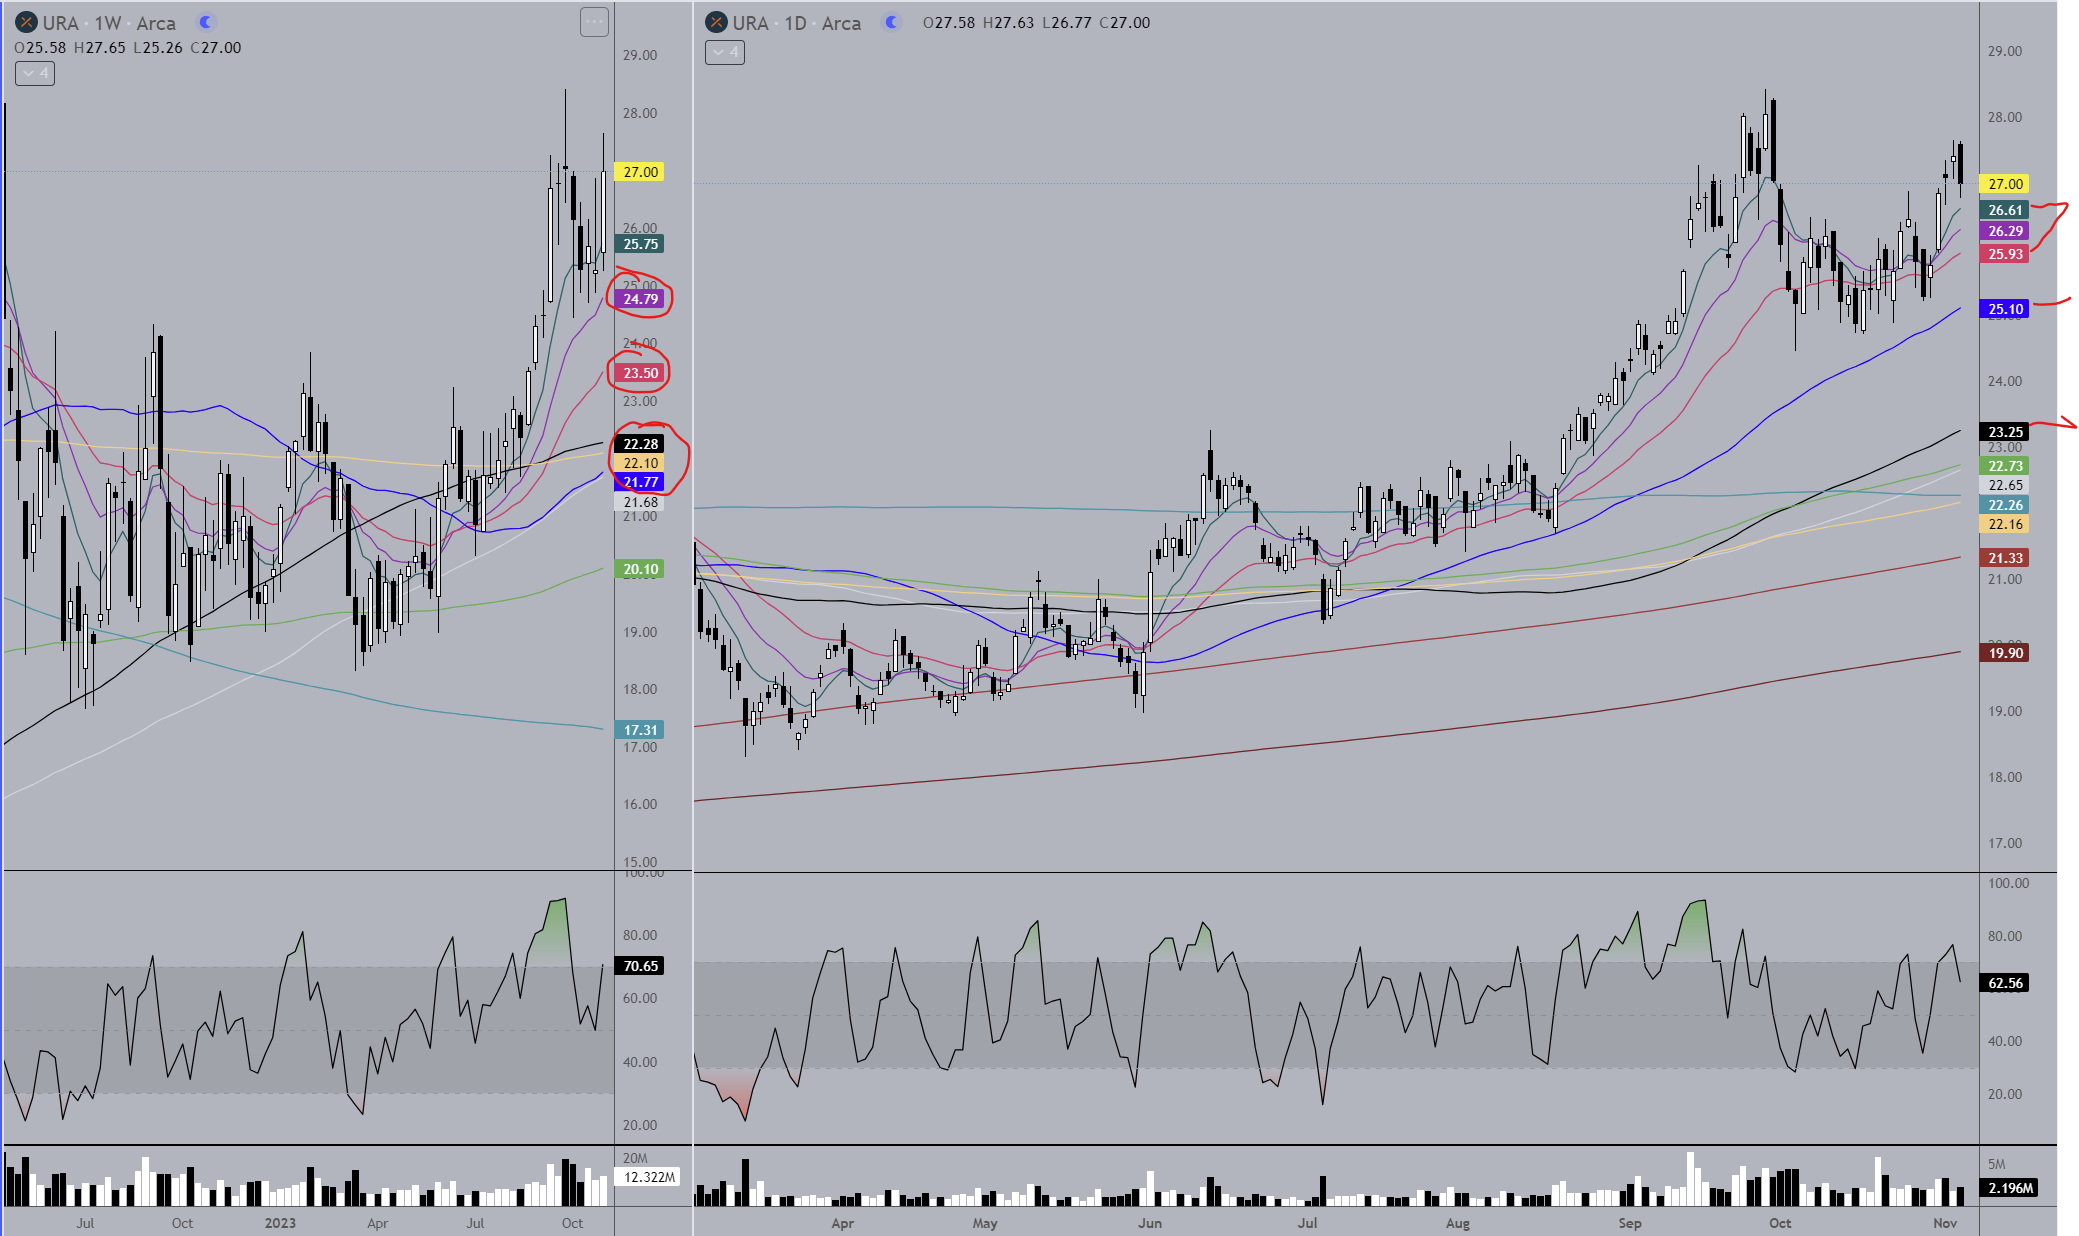
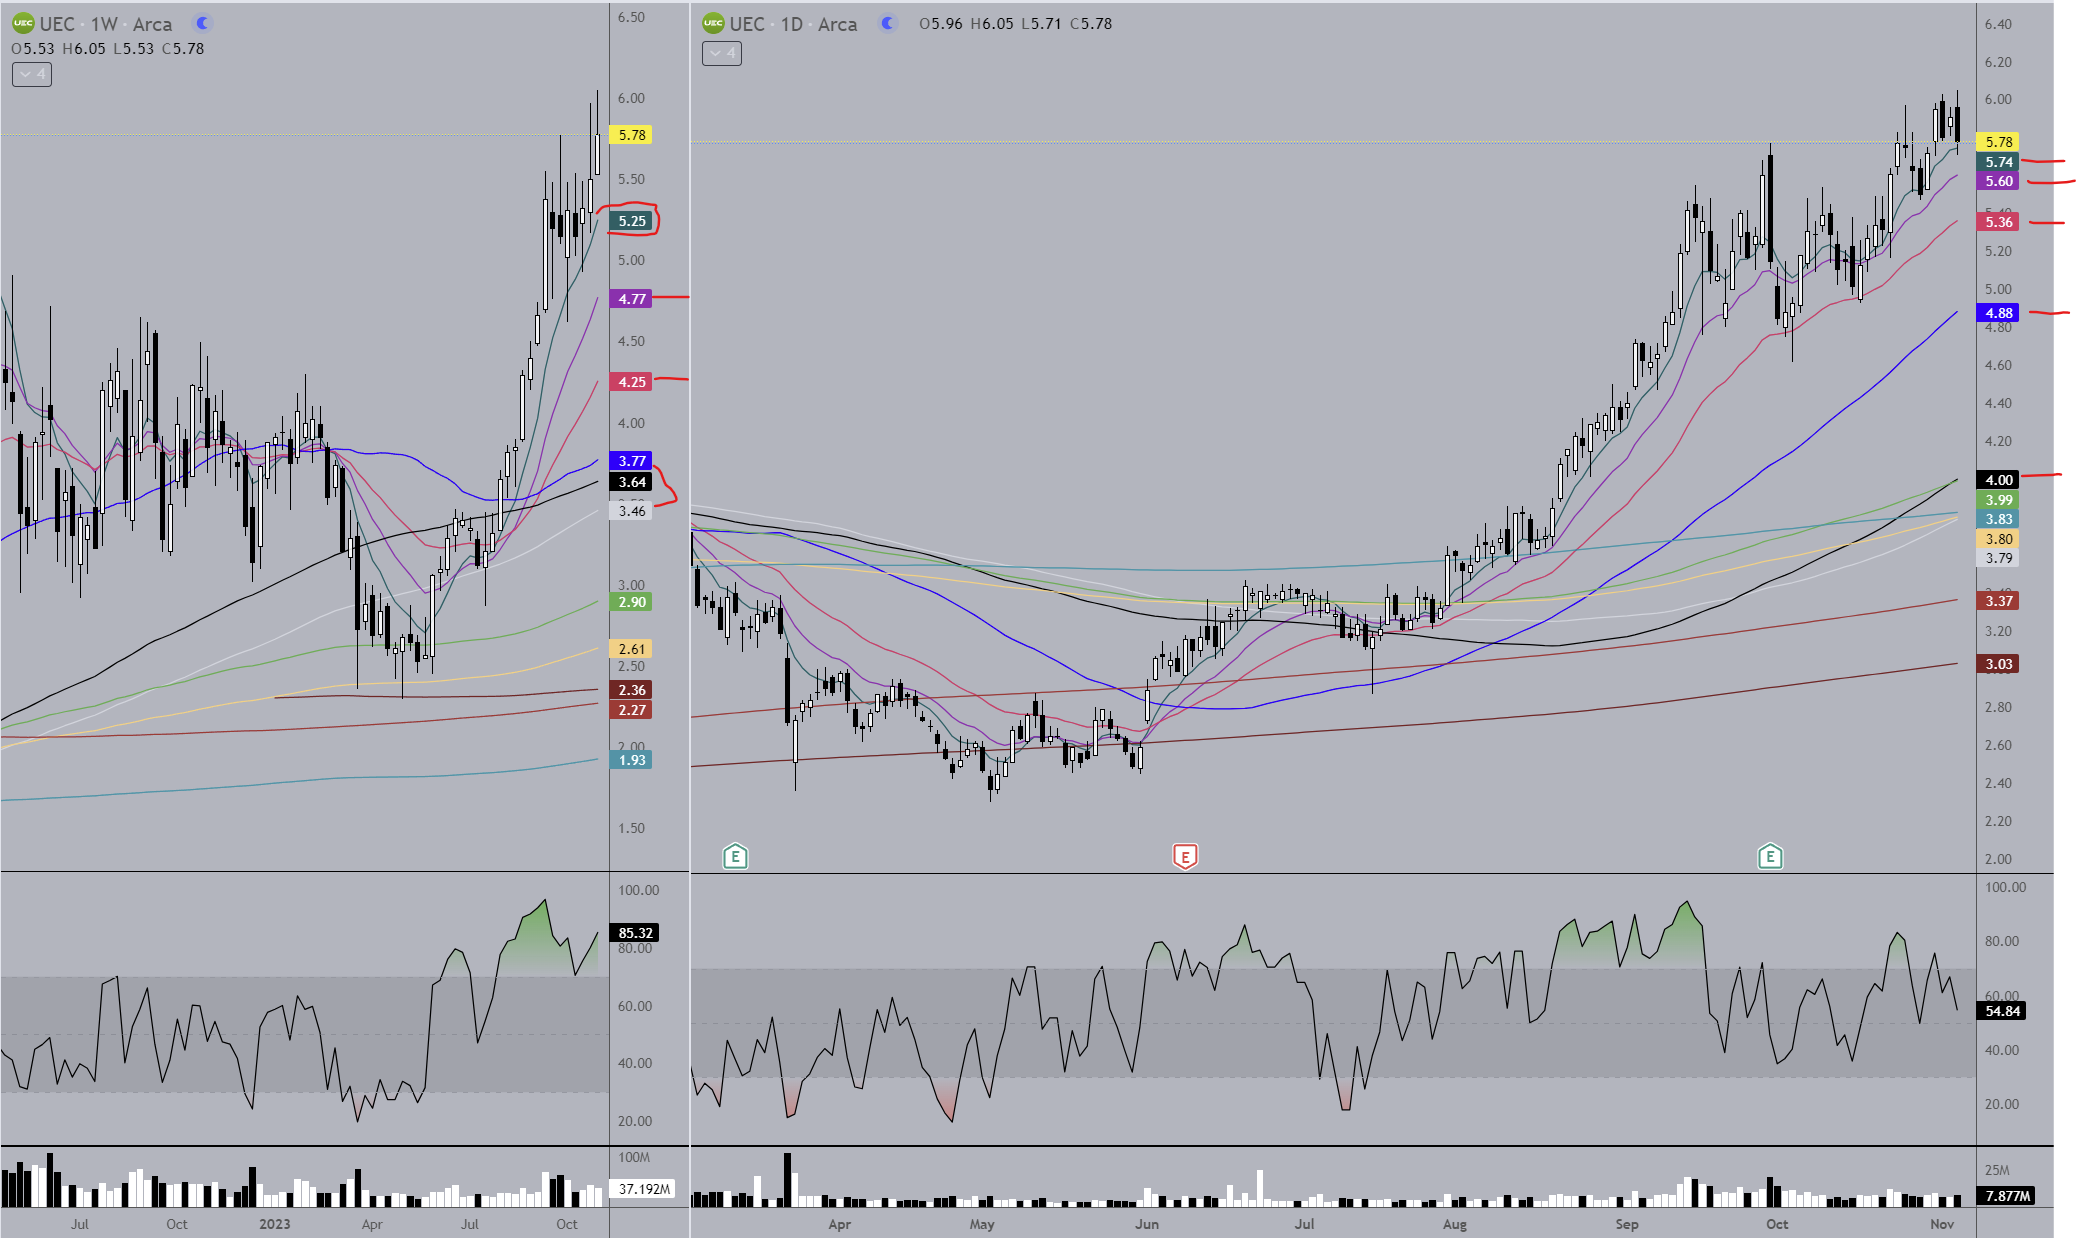
URA & UEC Weekly/Daily
The next two are going to pretty much be repeats of the first one as far as what to watch for support levels. Use the weekly levels along with the daily. I can repost them every so often to update the prices if you need. These MA’s work just as well or better than horizontal support areas, although I don’t get the accuracy on mining stocks that I do with Nasdaq, S&P or oil.
Keep in mind how I use the MA’s from my first post here. Everything above the black and silver MA are retracement levels for trends. If the black/silver fail, the trend is likely over.
AG M/W
Weekly chart shows a falling wedge, and this week’s candle that dropped down out and closed back inside is possibly/likely a sign that an upside breakout is soon to occur. Of course nothing’s certain, but there’s nothing like a little juke down to tempt more bears in before reversing up and using them to squeeze the price higher. Use the red weekly and green monthly MA’s for resistance areas. A monthly candle close above the green will bode very well and eventually you could get a move to upper $8’s - $9’s I would think.

RVLGF Weekly
I don’t know what to say about this one. It’s an OTC mining stock which triggers my PTSD. I don’t know what else to do with this other than what I’ve done. You’re only a couple weeks away from single digits if the trend continues, but you have better experience with these than I do.

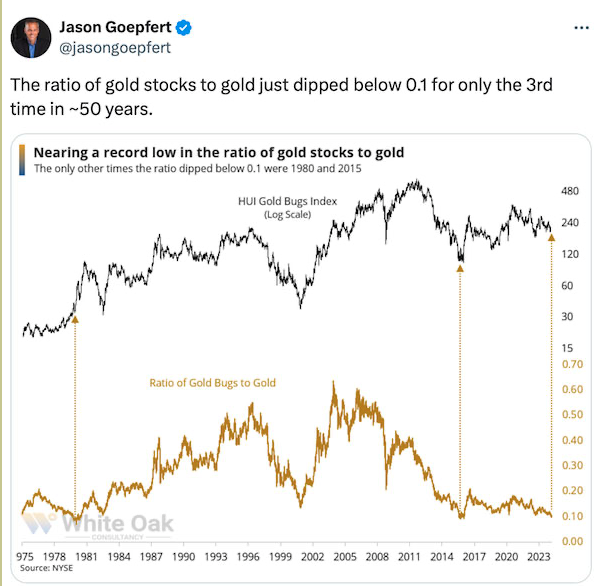
This Chart ![]() explains a lot!
explains a lot!
Fortitude Gold only has a $112.8M Mkt Cap, is a small steady producer with a 10.2% annual divvy (paid monthly) Recently I’ve been a steady buyer, especially at this bottom market for miners.
I’m sure there are others, but a few others I like are:
Agnico Eagle Mines net profit margin as of September 30, 2023 is 29.29% .
Wheaton Precious Metals net profit margin as of September 30, 2023 is 57.03% .
Dundee Precious Metals net profit margin as of September 30, 2023 is 32.28% .
Sandstorm Gold net profit margin as of December 31, 2023 is 23.22% .
Anyone else have some favorite stocks to mention?