Hi folks. I created this to share some potential opportunities for anyone interested here and, when I have time, if anyone has requests for chart analysis I’ll do them here.
2 Likes
Thanks for offering to do this TR. No particular rush, because as usual, I have a number of companies who are on my want to add more to list.
ICL - Israel Chemicals Ltd - (specialty minerals and chemicals ), primarily in the agricultural fertilizer supply market, also announced “US ICL Breaks Ground on $400 Million Battery Materials Manufacturing Plant in St. Louis” - lithium iron phosphate (LFP) - It has a 9.8% divvy.
Sociedad Quimica y Minera de Chile S.A. (SQM) - distributes specialty plant nutrients, iodine derivatives, lithium derivatives, potassium chloride and sulfate, industrial chemicals, and other products and services.(approximately 20% of the global lithium market).
FTCO (Isabella Pearl mine project Nevada) “Annual Outlook targeting 40,000 gold ounces (a range of 36,000 to 40,000 ounces). $680 per ounce total all-in sustaining cost.”
Rather than critique my longer list for possible review, perhaps in the Other Stocks Forum later, I’ll just mention a few tickers for you to review if their charts are of interest. I find all have compelling stories. No rush on the charts, as I have positions in these and I’m adding on dips as appropriate to build long core positions (always subject to change). This is not an inclusive list by any means, and not a recommendation for purchase. Everyone needs to do their own DD.
OROCF - Allkem (ASX:AKE)
LTHM - Livent Corp
TFPM (TFPM.TO) Triple Flag Precious Metals Corp
IAUX (IAU.TO) i-80 Gold Corp, Inc.
I hope others will also bring other companies to your attention for a chart review.
Again, thanks.
EZ
Before I start with EZ’s list I’m going to post a compressed daily interval chart of QQQ and use it to explain how to use my system of MA’s, which may initially look nuts (as there are 25 total) but I think it won’t be too hard to see the logic in them. They work particularly well for Nasdaq futures and QQQ and many Nasdaq stocks, but they work pretty well for just about everything.
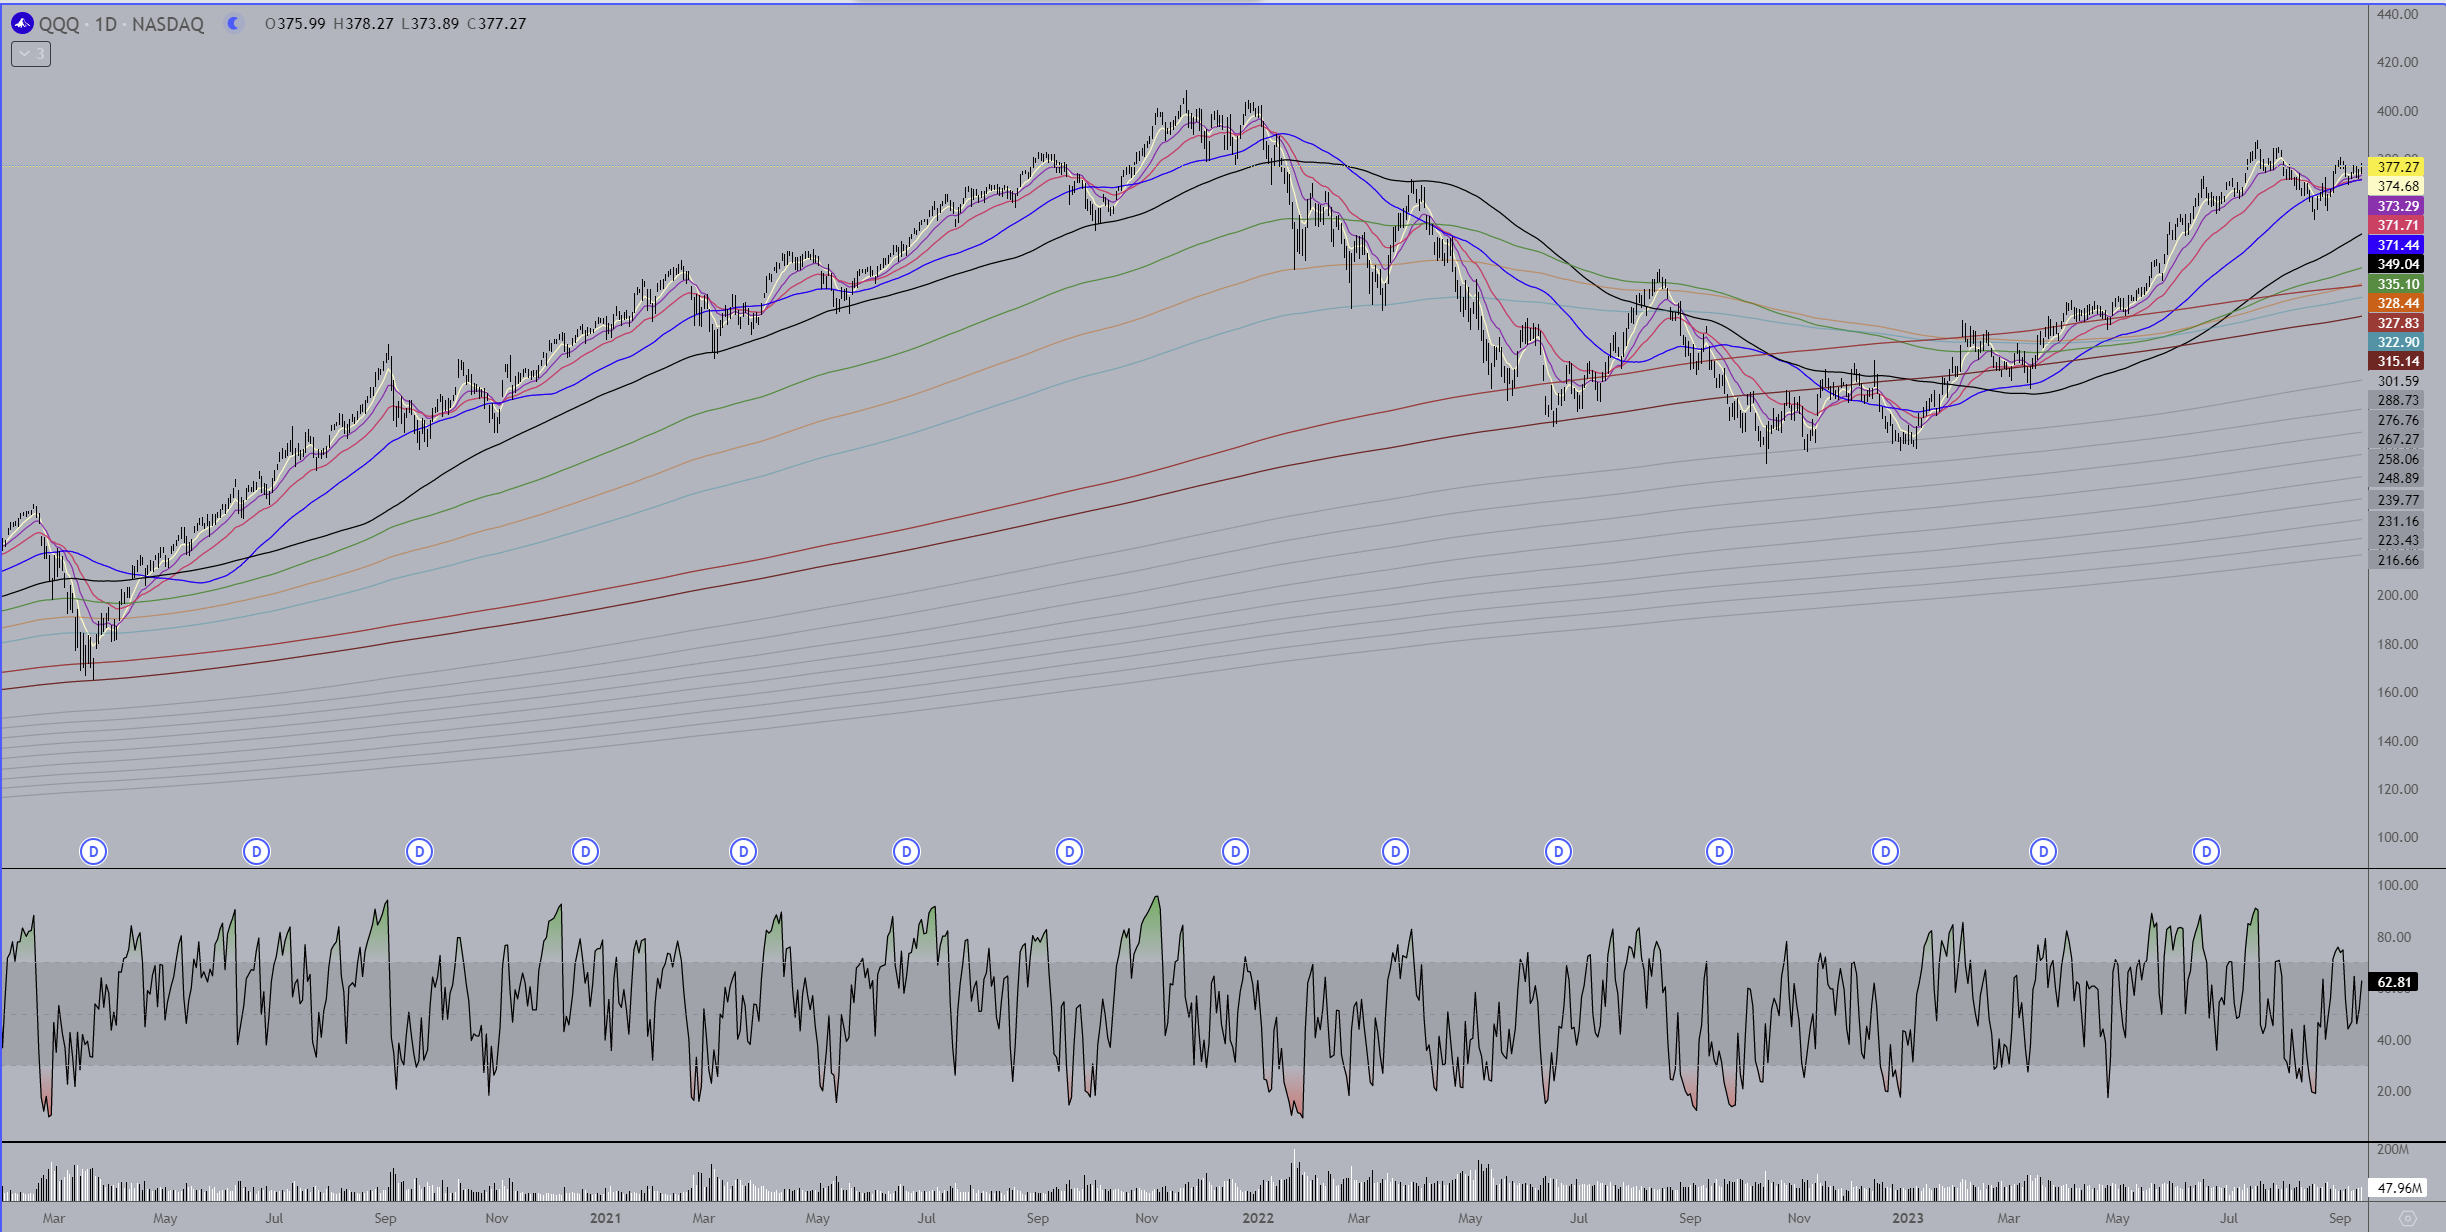
Remember you can right click on any image and have it show up enlarged in a new window. This chart covers the 2020 Covid low through today. They work pretty well. I’m not going to share the MA’s because they are something I worked on for well over a decade which only just came together about 2 yrs ago.
There are 10 colored MA’s and a total of 15 grey MA’s which aren’t all up on this chart. The grey’s usually don’t come into play on the longer time frames unless we’re in a bear market and things have sold off quite a lot. They tend to work very well on the daily time frame for finding bottoms. On shorter time frames they can be used to pinpoint tops and bottoms of moves.
The ten colored MA’s should be viewed in 3 subgroups. The two browns are the longest of the colored MA’s and they are my “bull/bear” indicators. When anything is trading above both of these then it is usually to be looked at as long term bullish. Below both of these MA’s is long term bearish.
The next subgroup consists of the green, light blue, and yellow MA’s. They will tend to be areas of support/resistance in the midst of larger trending moves. You can see how they played this role in the beginning of the downtrend early in 2022. They played a bit of a resistance role in the beginning of 2023 just before QQQ moved completely back above the two brown MAs.
For some equities the green can also play the role that the black MA plays, which is my MA of last resort for trends. What this means is, and you can see this in the chart, during a trending move the black MA (and sometimes the green) is where the deepest pullbacks will go to during trending moves. If that MA loses support it often means the trend is done and a deeper pullback/change of trend is beginning. You can see on this chart in July 2022 where the black MA was breached during a counter trend rally and it went to and a little above the green before continuing the down trend.
The last subset of MA’s are the shortest and are white, violet, red and blue. These MA’s indicate the strength of a trend and help to give an early head’s up to watch for trend reversals. It’s hard to see on this compressed chart but you can see how well these MA’s work as support/resistance during trending moves.
In conjunction with this daily chart I also use monthly, weekly, and an 8hour ETH chart which shows the pre/after hours trading and is very useful when paired with the daily chart.
Btw, I do remember that in the past I have shared that the black MA is the 130 MA, so there’s a gift for you all. You can actually use this single MA to do pretty well trading QQQ and many Nasdaq stocks in particular. If any of you do use it, it is not a terribly well known MA so it would be wise to keep it secret, since the more popular any tool gets the more it tends to lose it usefulness.
2 Likes
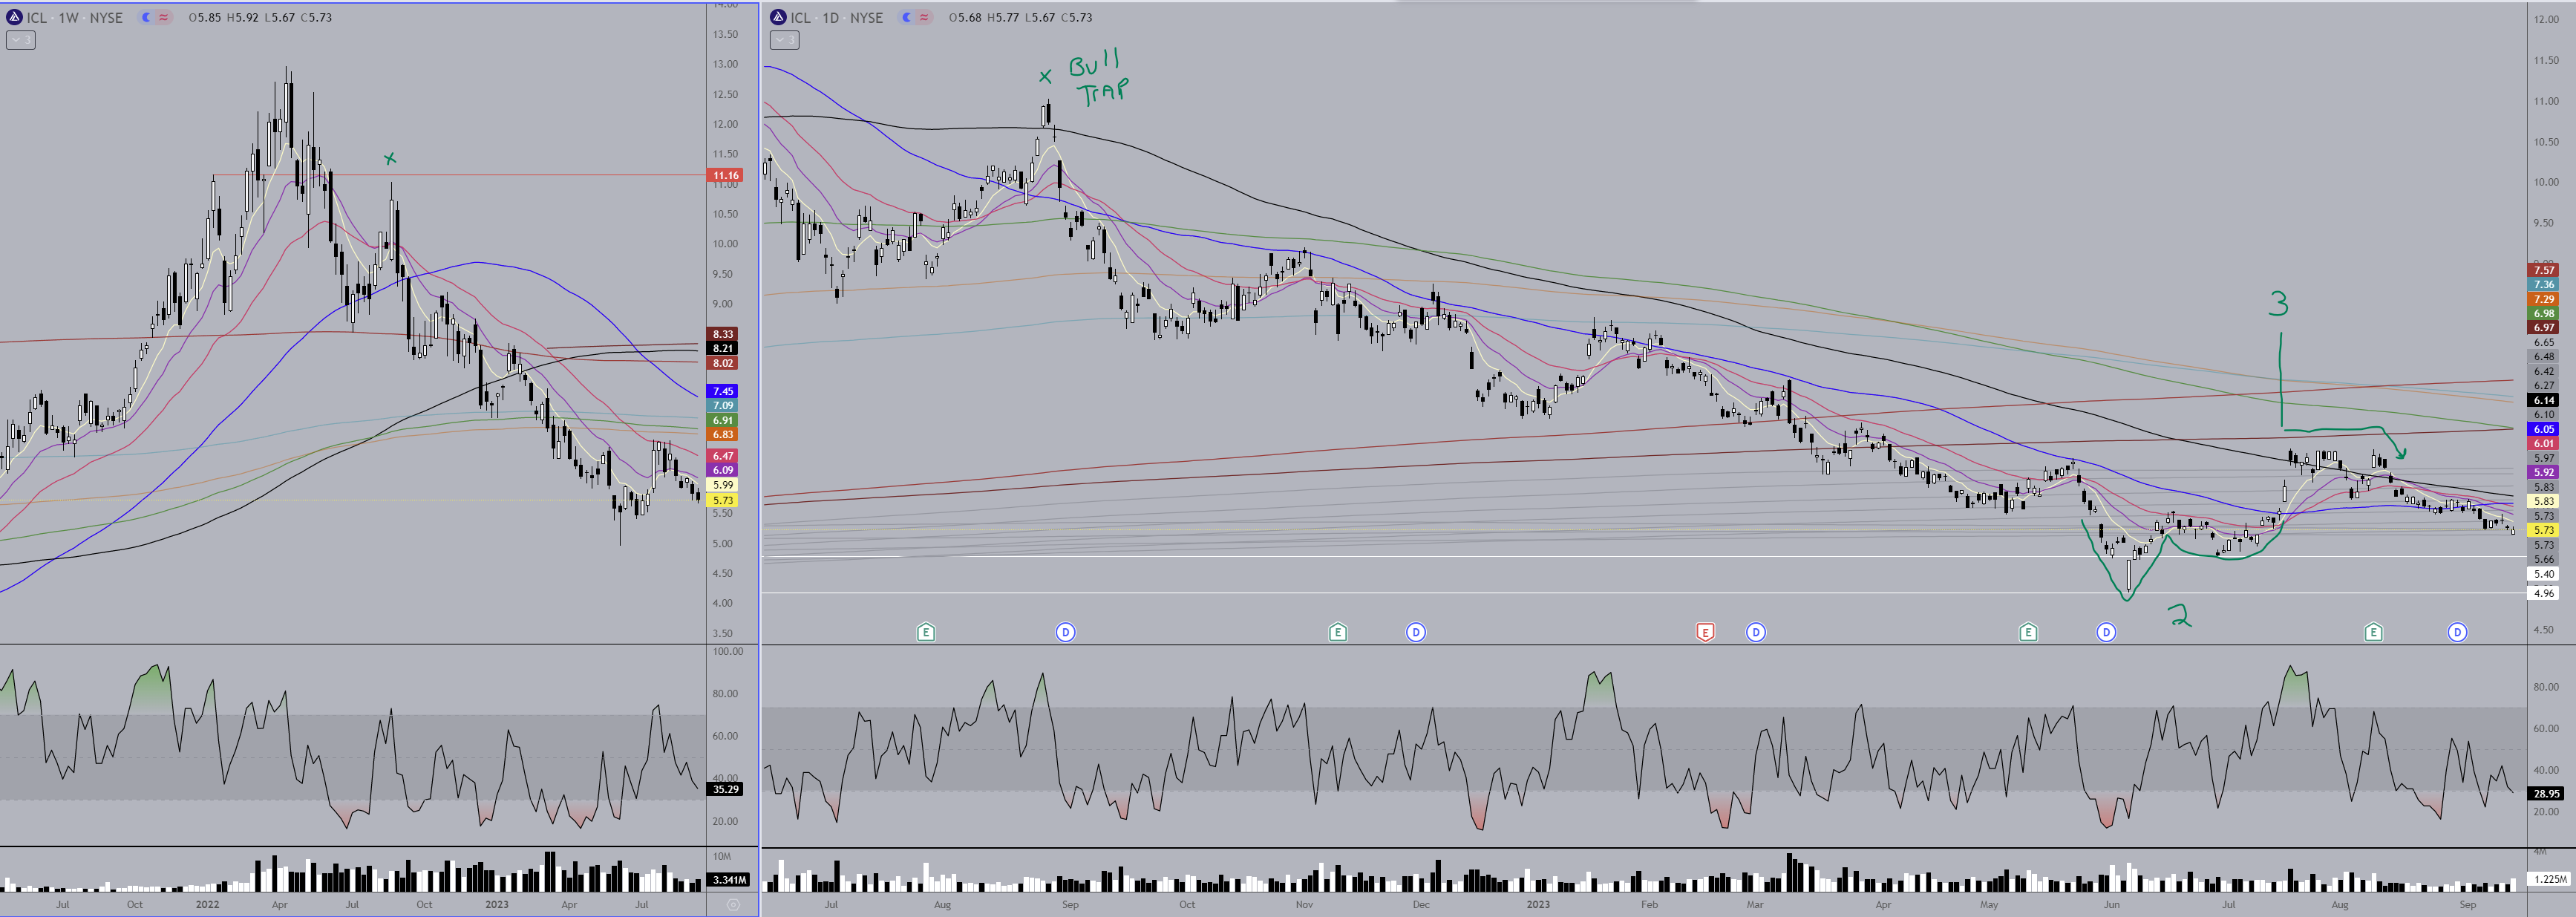
ICL
Starting with the weekly chart on the left…a clear strong downtrend as the stock has traveled to the lows never peaking above the violet MA until just recently. It made an adam & eve bottom (#2 on the daily chart) and made a decent move higher. It had the bullish cross of the fast MA’s above each other with price moving up through the blue and black MA’s, but the lower brown MA provided an impenetrable wall which tells us it’s still in bearish territory. The downtrend has resumed with all the MA’s crossing back down and continuing the bearish trend. The two areas to watch for support are the bottom of the eve @ 5.40 and the low of the Adam @ 4.96.
1 Like
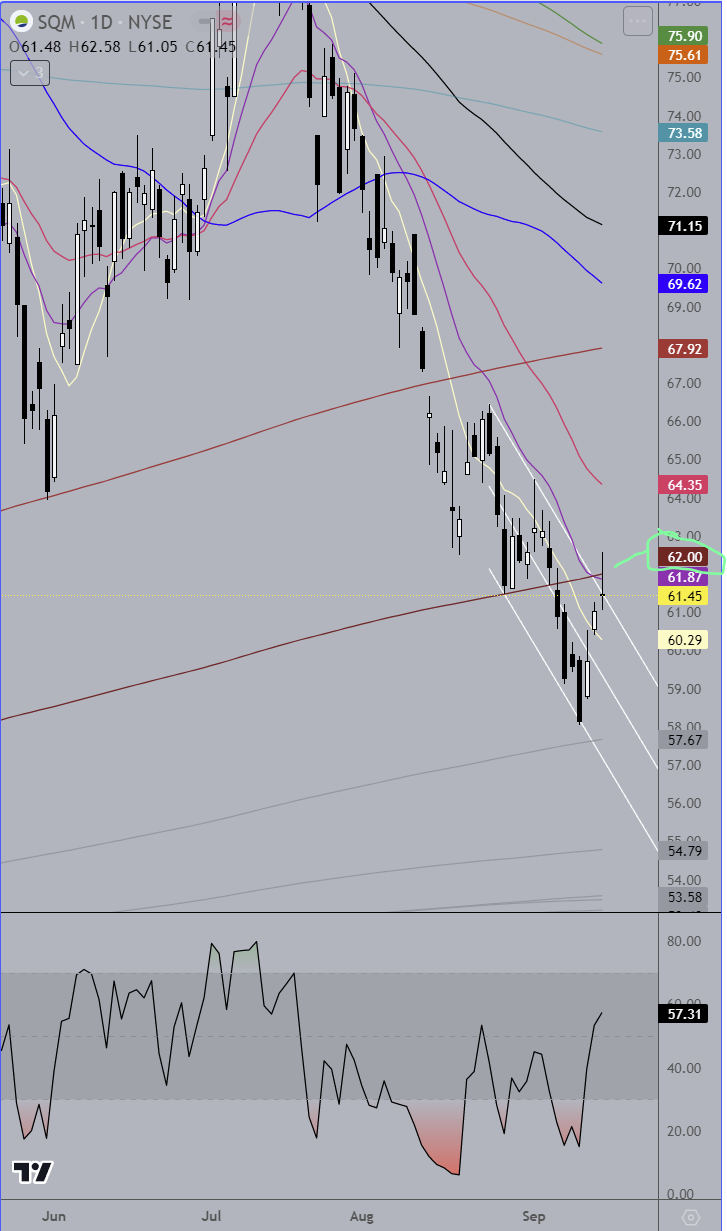
SQM
Another strong downtrend. This one follows the MAs pretty well but it probably doesn’t trade with great precision so will waffle above and below. The weekly RSI dipped as low as it has been in some time but the volume doesn’t wreak of buyers. The green weekly MA is at 61.17. Since the prices tend to mush around an MA before bouncing keep an eye on that price, especially the close tomorrow. Same with the lower brown MA on the daily @ 61.95. Both are only slightly turned upward so just add a few cents to each level every day to get a sense of where price is at. If it doesn’t make a move back above the low 61’s then the next stop is likely to mid 50’s. The recent low is just about $58, so I would keep an eye on the $62 - $58 range and if it makes a move above $62 and looks like it will hold then it’s not a bad place to take a shot at a long. If $58 doesn’t hold then you get a gift of lower prices.
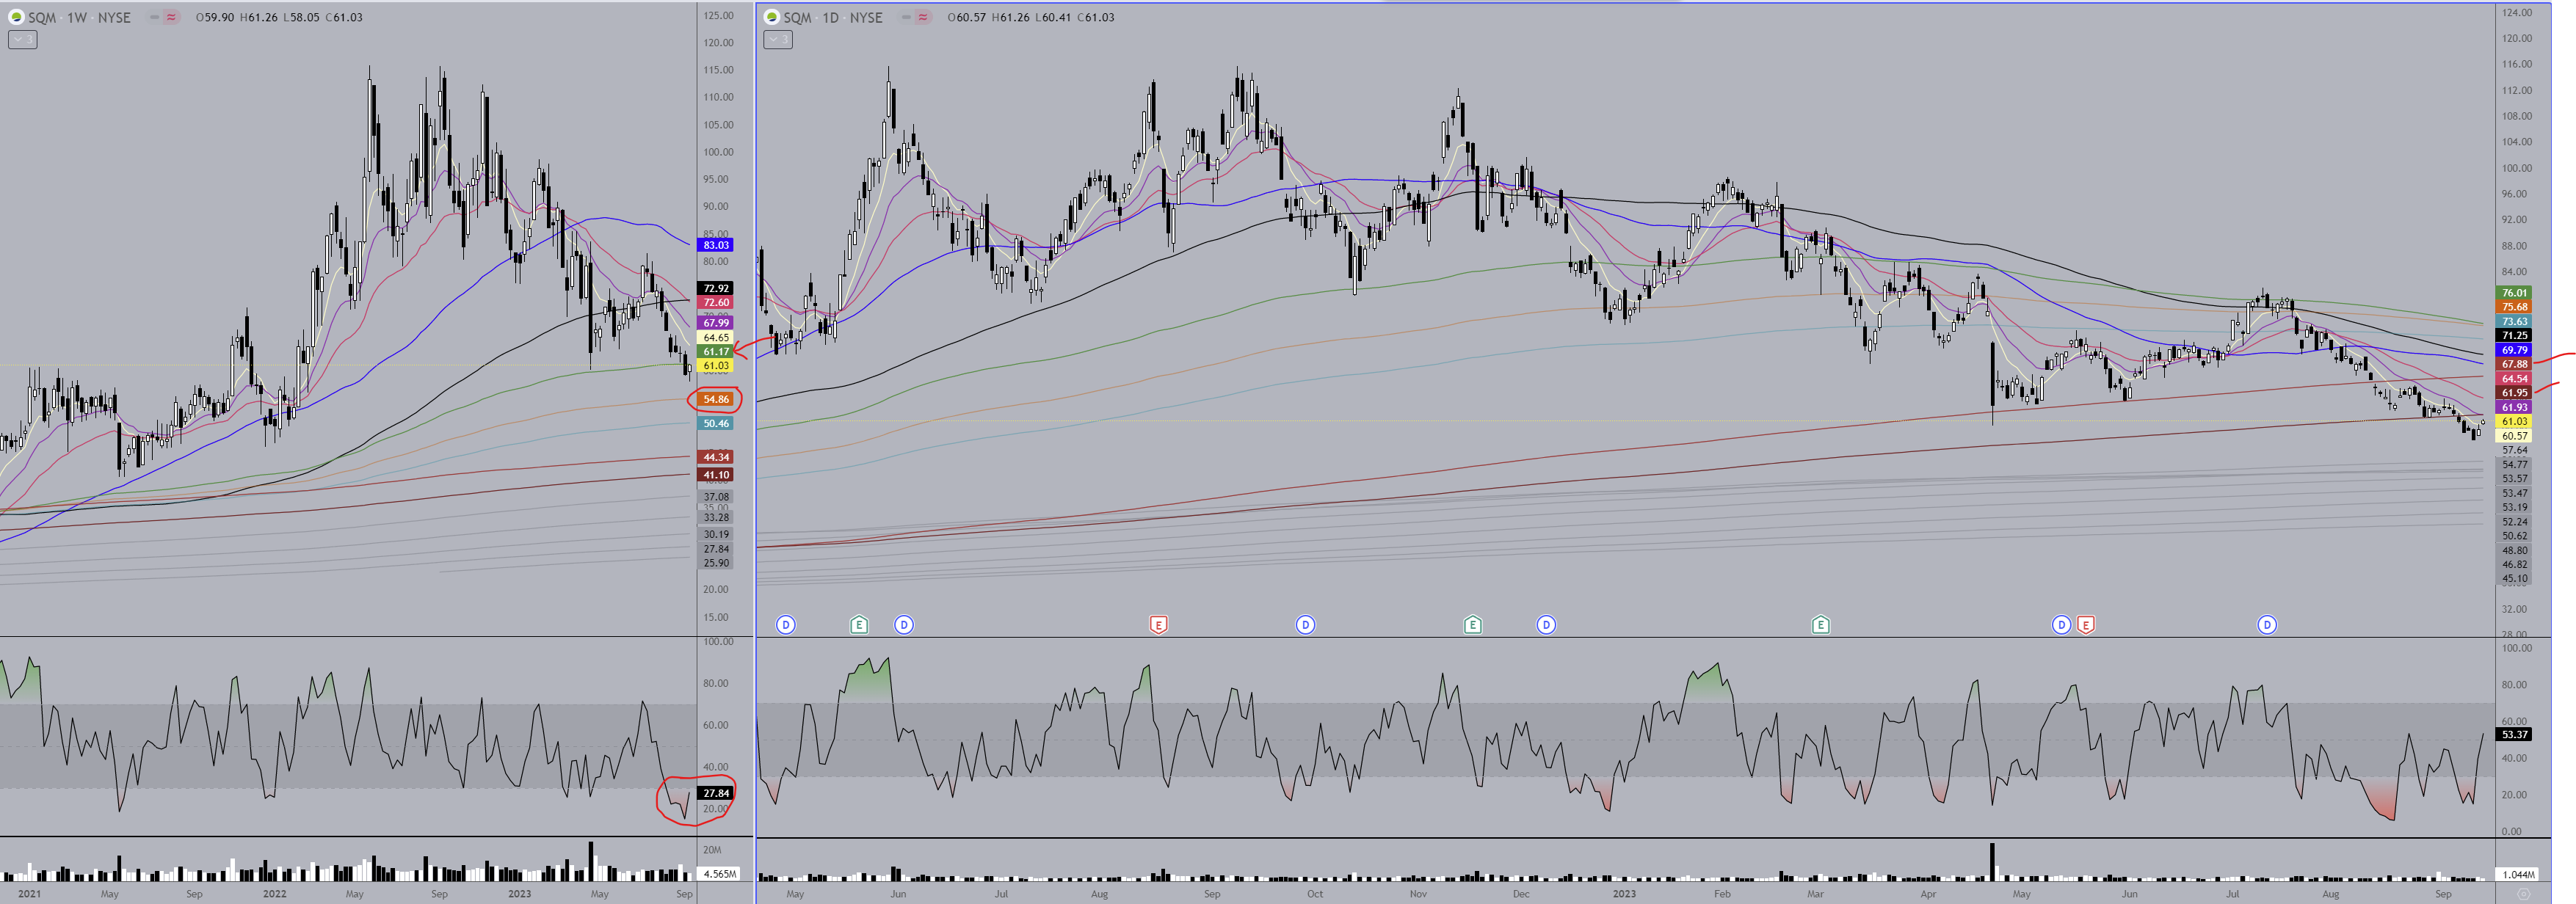
One thing to keep an eye on… When an equity has been in a long uptrend or downtrend, sometimes the market has a “tell”, like in reading poker opponents, as to when the top/bottom MIGHT be in. SQM appears to have this going on. The last period of time in the trend… could be a week or a month or more… it will trade within a rising/falling channel. So when this happens in an uptrend the stock will finish the move in a rising channel, then eventually fall out of the bottom line of the channel and that can be indicative of the end of the run. For a bearish move, like here, the stock will finish off its move in a falling channel and eventually break up out of the upper channel line.
What I want to be most clear about is that, although the break out of the channel works quite often, it MAY NOT always indicate a top/bottom, but there is a chance of it.
FTCO
Not a lot of price action yet but plenty to discuss. The monthly looks like a bull flag. The question here is, does it hold the center line or eventually head down to the 4.50 area? The weekly is showing a couple interesting things that may help provide an answer. 1. So far the stock has not quite retraced 50% of the initial move which, considering it is I presume a mining stock, and the high was hit over 2 years ago, is pretty impressive. I suspect the .04 monthly dividend is helping that. 2. There appears to be an inverted head & shoulders formation. If it gets legs, based on the initial move the stock made from .75 to about $9, it could eventually get to $12 - $13, a double + from current prices.
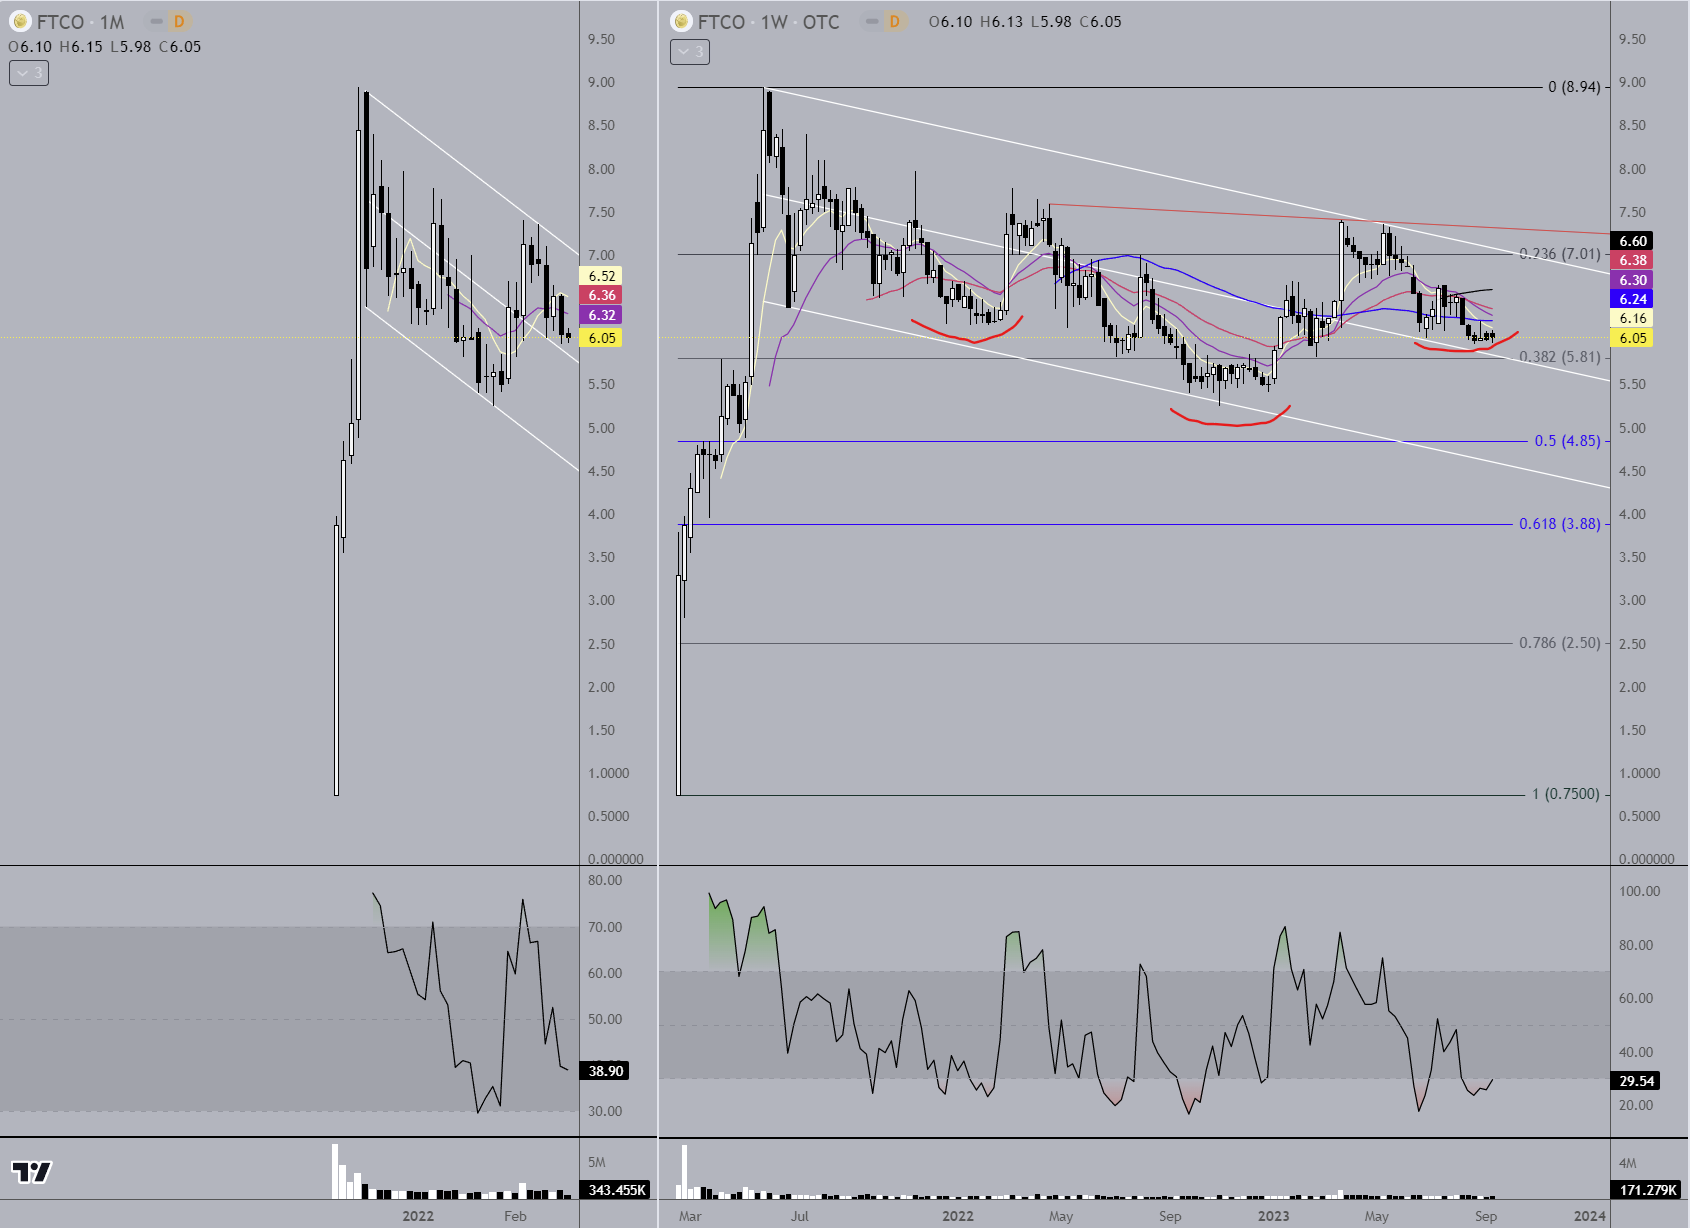
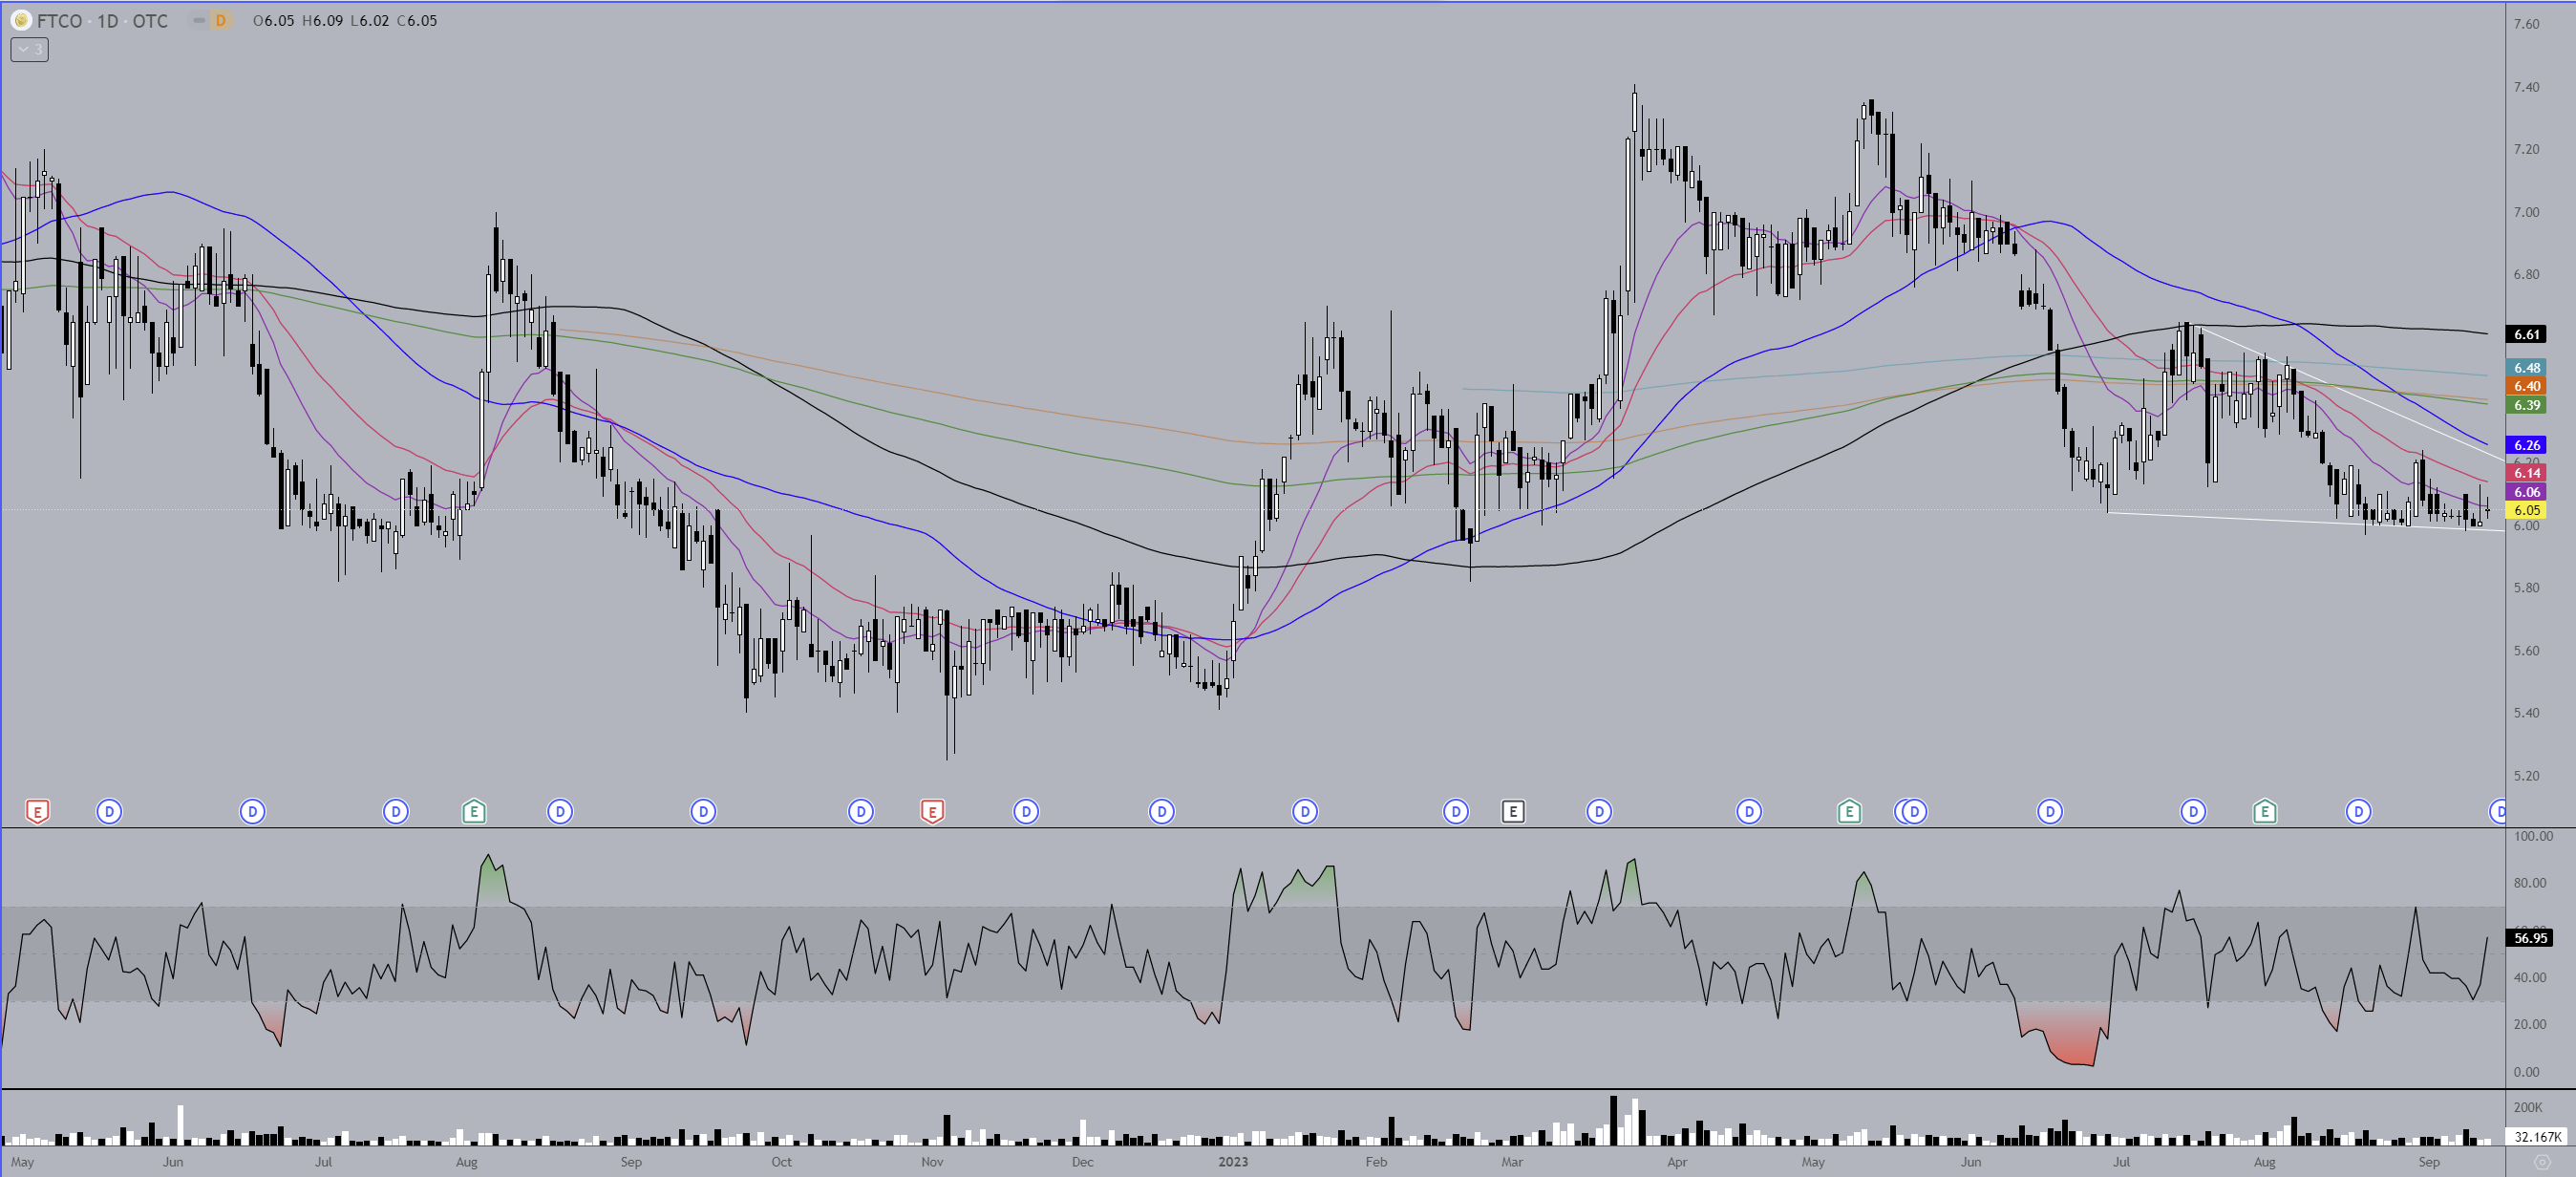
The daily chart shows the stock started a downtrend in June, although it has flattened out with decent support around $6 within a small falling wedge formation which is usually bullish. If it’s not and the drop goes lower, first support is in the 5.40 area. A break up out of the wedge is likely to find resistance at the black MA. A move higher takes you to the neckline of the IHS around 7.20.
So you’ve got a channel, Fibonacci levels, and an Inverted Head & Shoulders to keep an eye on here to help guide your moves. If this turns out to be a good company that continues to at least pay out the .04 monthly dividend, a thousand share purchase at $6 will yield you free shares in 12.5 years. Not a terrible thing!
1 Like
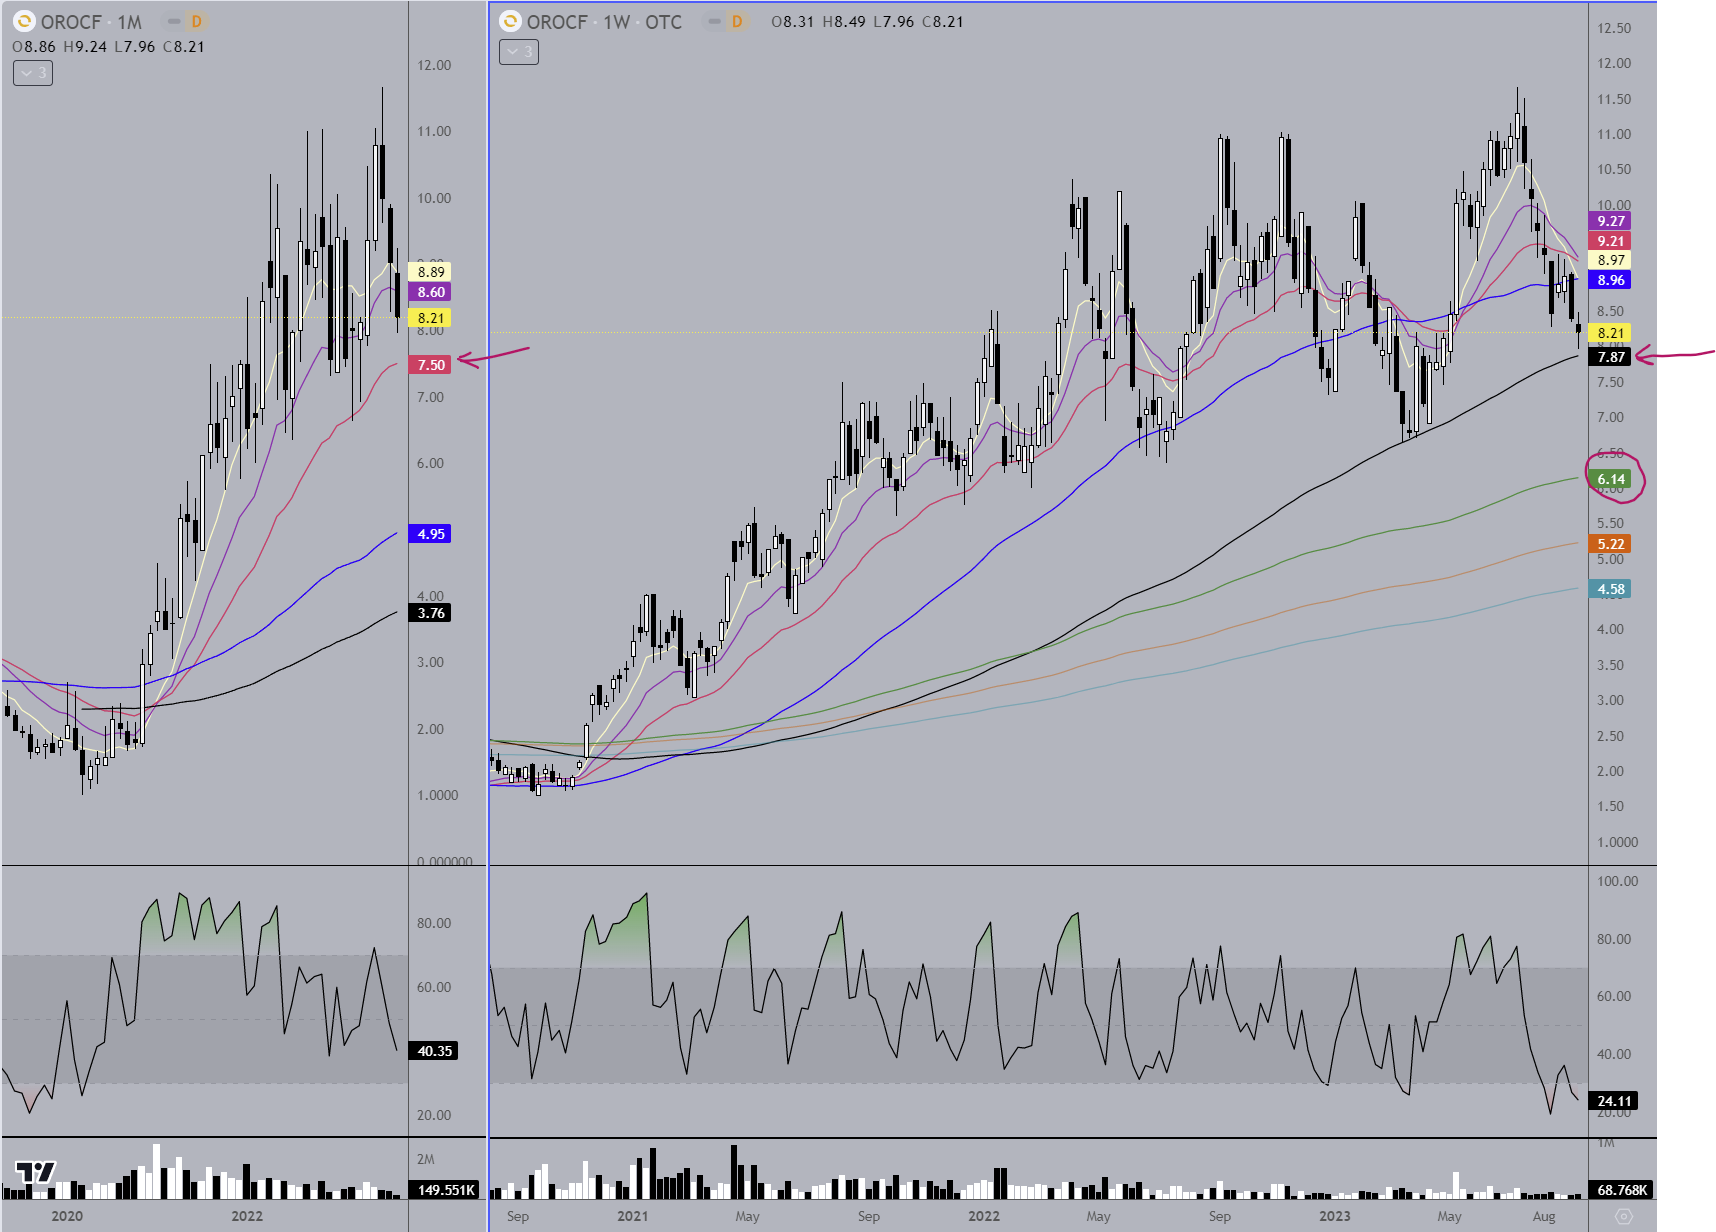
OROCF
Monthly/Weekly - This one follows the MA’s nicely. See if the black MA on the weekly holds @ 7.87 like it did in April/May prior. Also watch for a potential dip down to 7.50 to the red MA on the monthly chart.
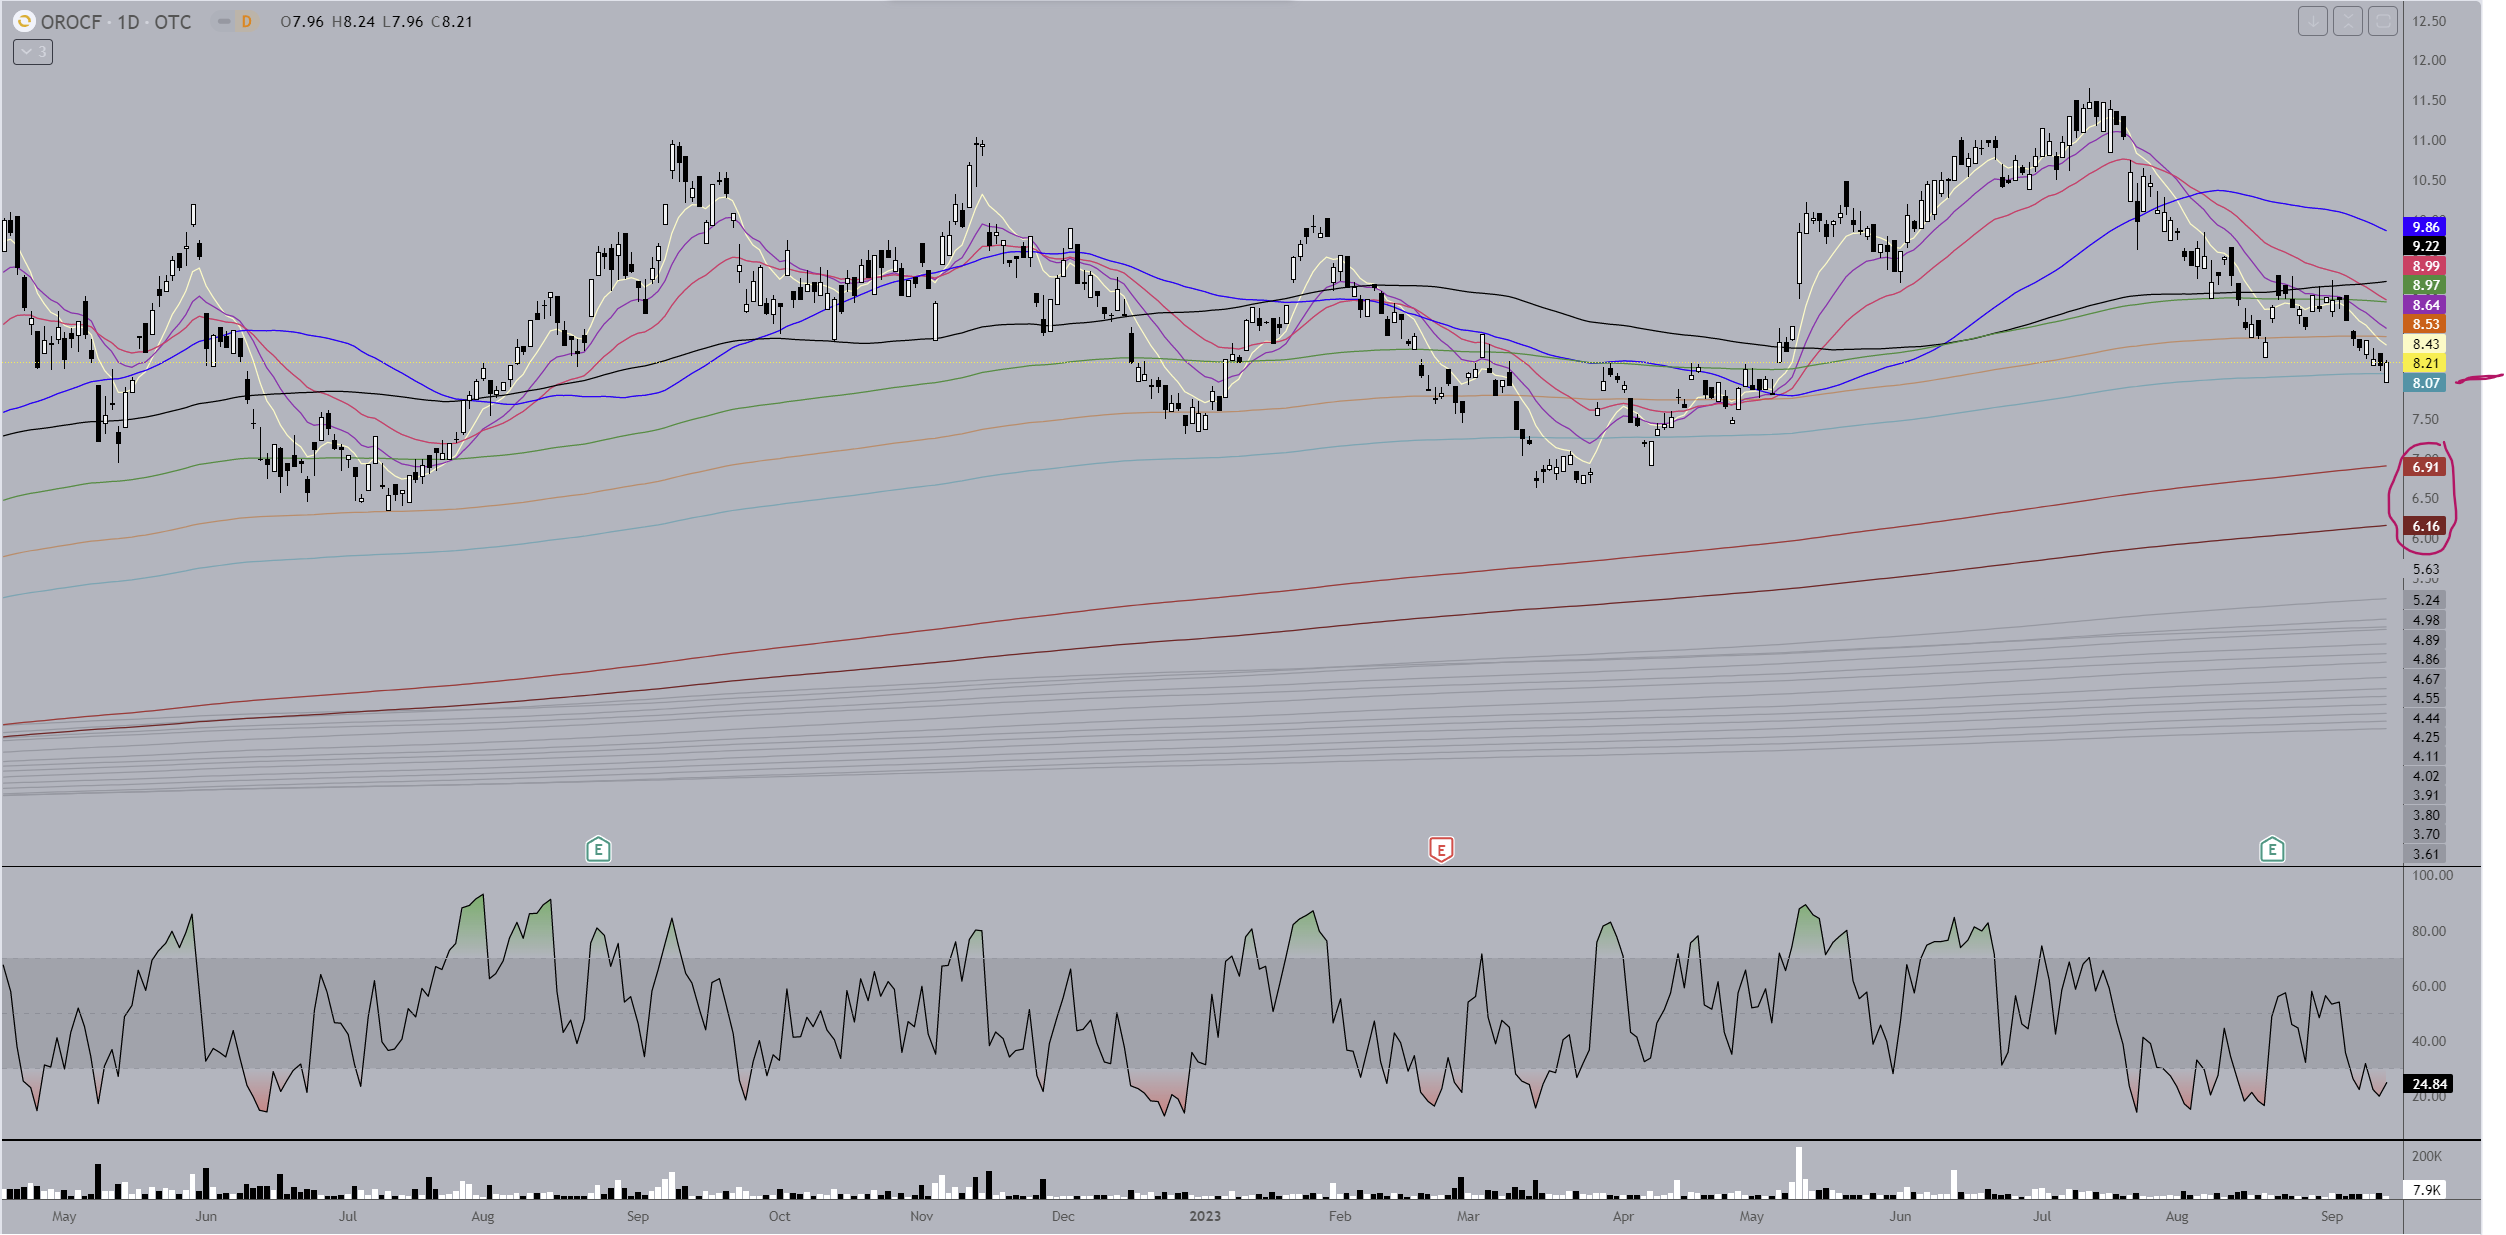
Daily - Super low volume days but still holds the MA’s pretty well. The area of the lt blue MA was where it bounced from before and now you’ve got other MA support right here. If it doesn’t hold watch the area of the two brown MAs. This one looks decent for swing trades. It is in a downtrend since mid July. It seems to move pretty substantially once it starts a trending move so you’d usually have time to get a position after the move begins and establishes some support.
1 Like
I have two requests if you have time. Thanks!
GEN
PSYTF
I’m making a list, first come, first served. Likely this weekend. ![]()
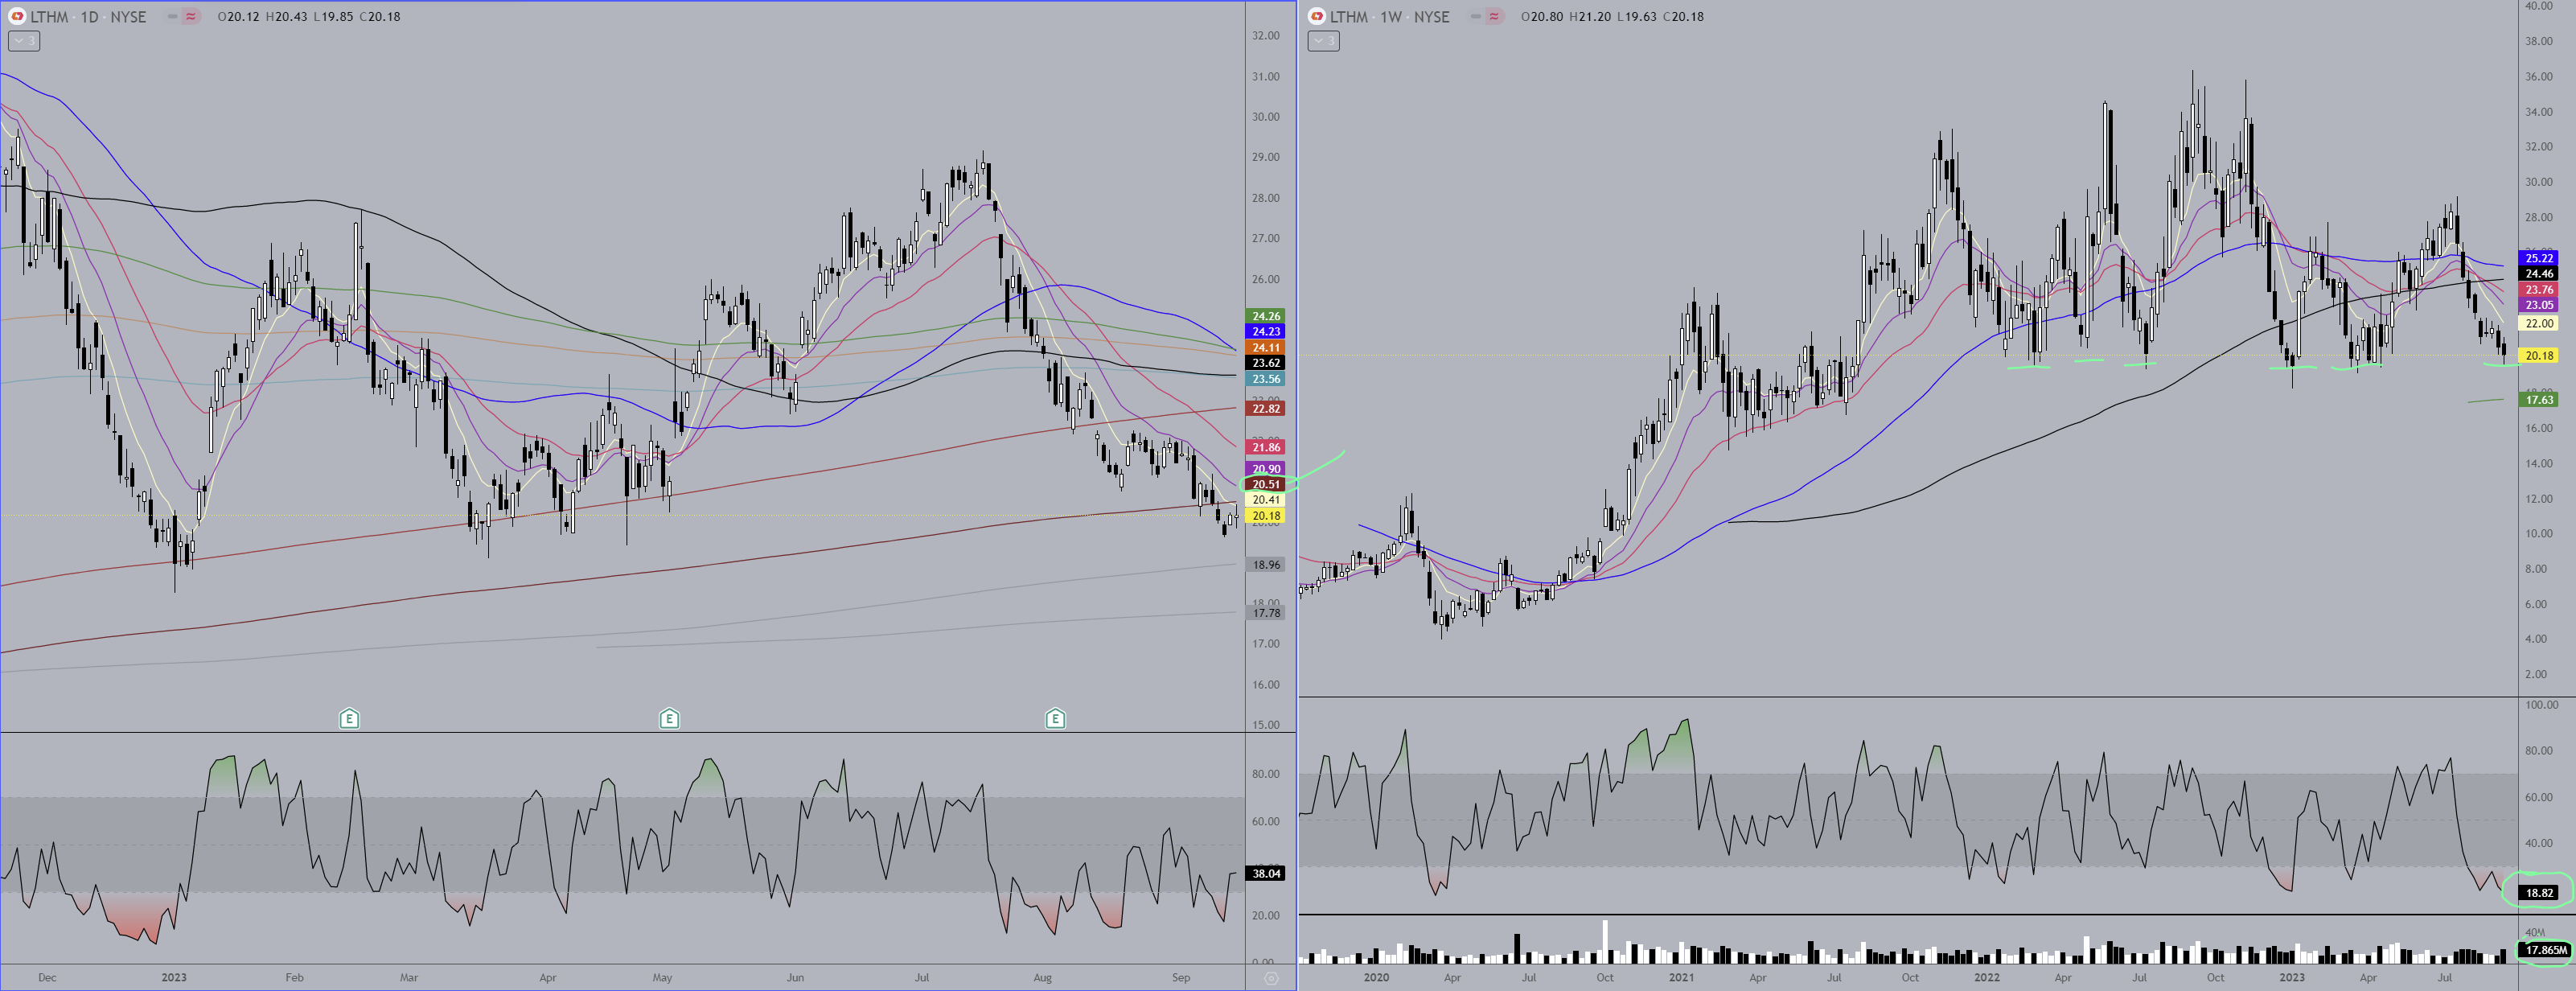
LTHM
Daily - Another stock in a strong downtrend, now in bearish territory below both brown MAs. The grey MAs can play their role now for support, but the stock has only been trading long enough for their to be 2 of them. Interesting though that the blue and black MAs are still above the brown, and the blue is still above the black… and both of them are only mildly turned down. You can see how the stock dropped below the higher brown MA numerous times this year only to reverse higher from that area. Watch for the possibility of the same kind of thing now with the lower brown MA, especially when you can see the stock is in a strong support area clearly visible on the weekly chart, now to the right. I guess there’s the possibility of a head & shoulders formation on the weekly chart, but I’m doubting its legitimacy. The measured move would take it below 0.
If the stock gets a move above 20.50’s and looks like it has support I’d probably be a buyer, then use the recent low as a stop. The weekly is quite oversold and volume this week was up, likely traders anticipating a bottom.
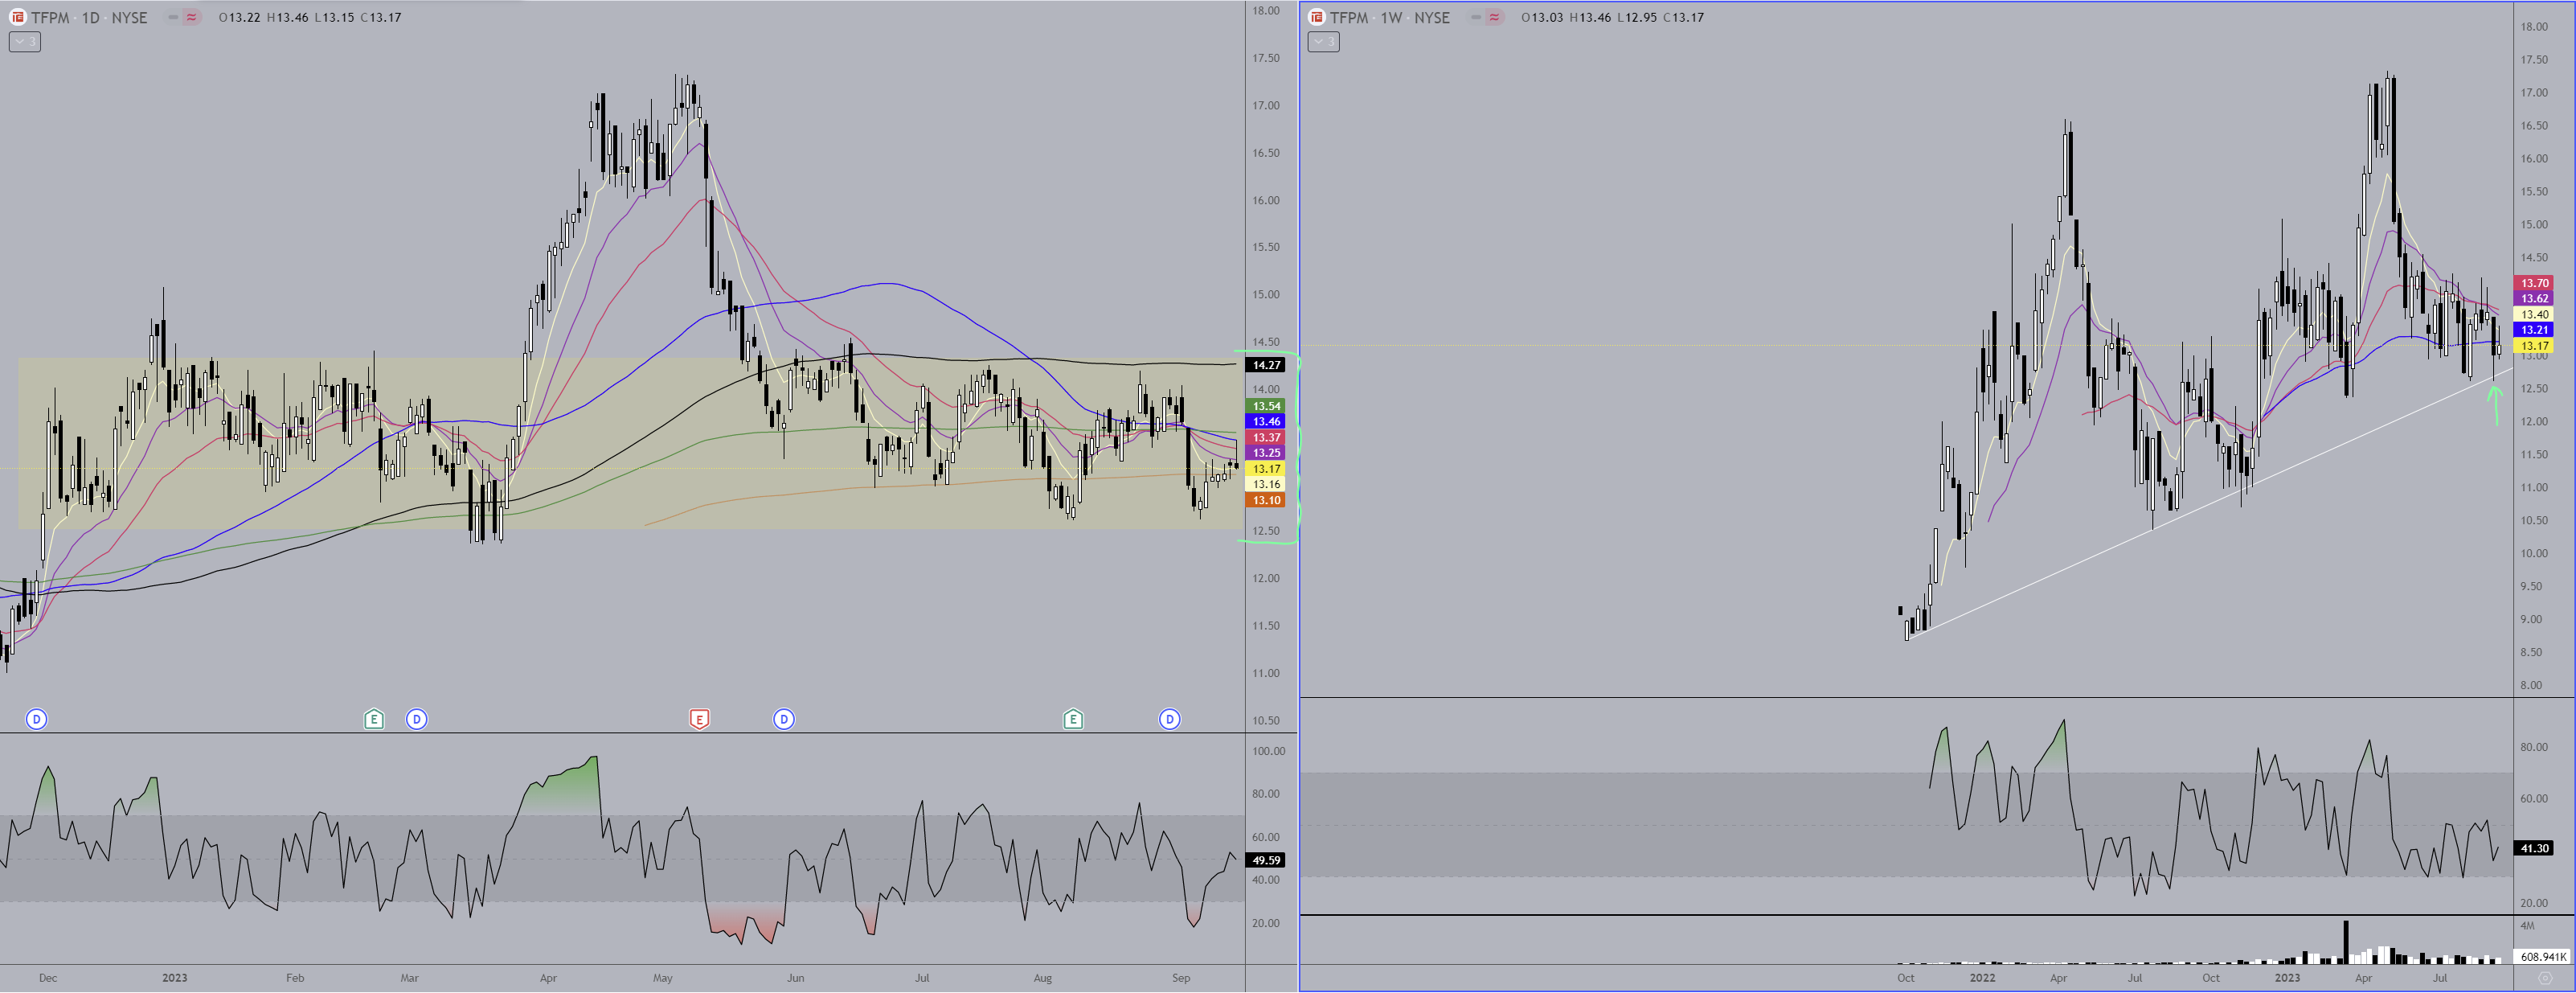
TFPM
Daily - Pretty consistent trading range on this one. Buy between $12 - 12.75, sell between 13.75 - 14.
Weekly - There’s not much for me to work with here, but trend line support was hit the prior week and has so far held, although lost the move above the blue MA. Be careful of a loss of support, which would likely lead to 11 - 10.50.
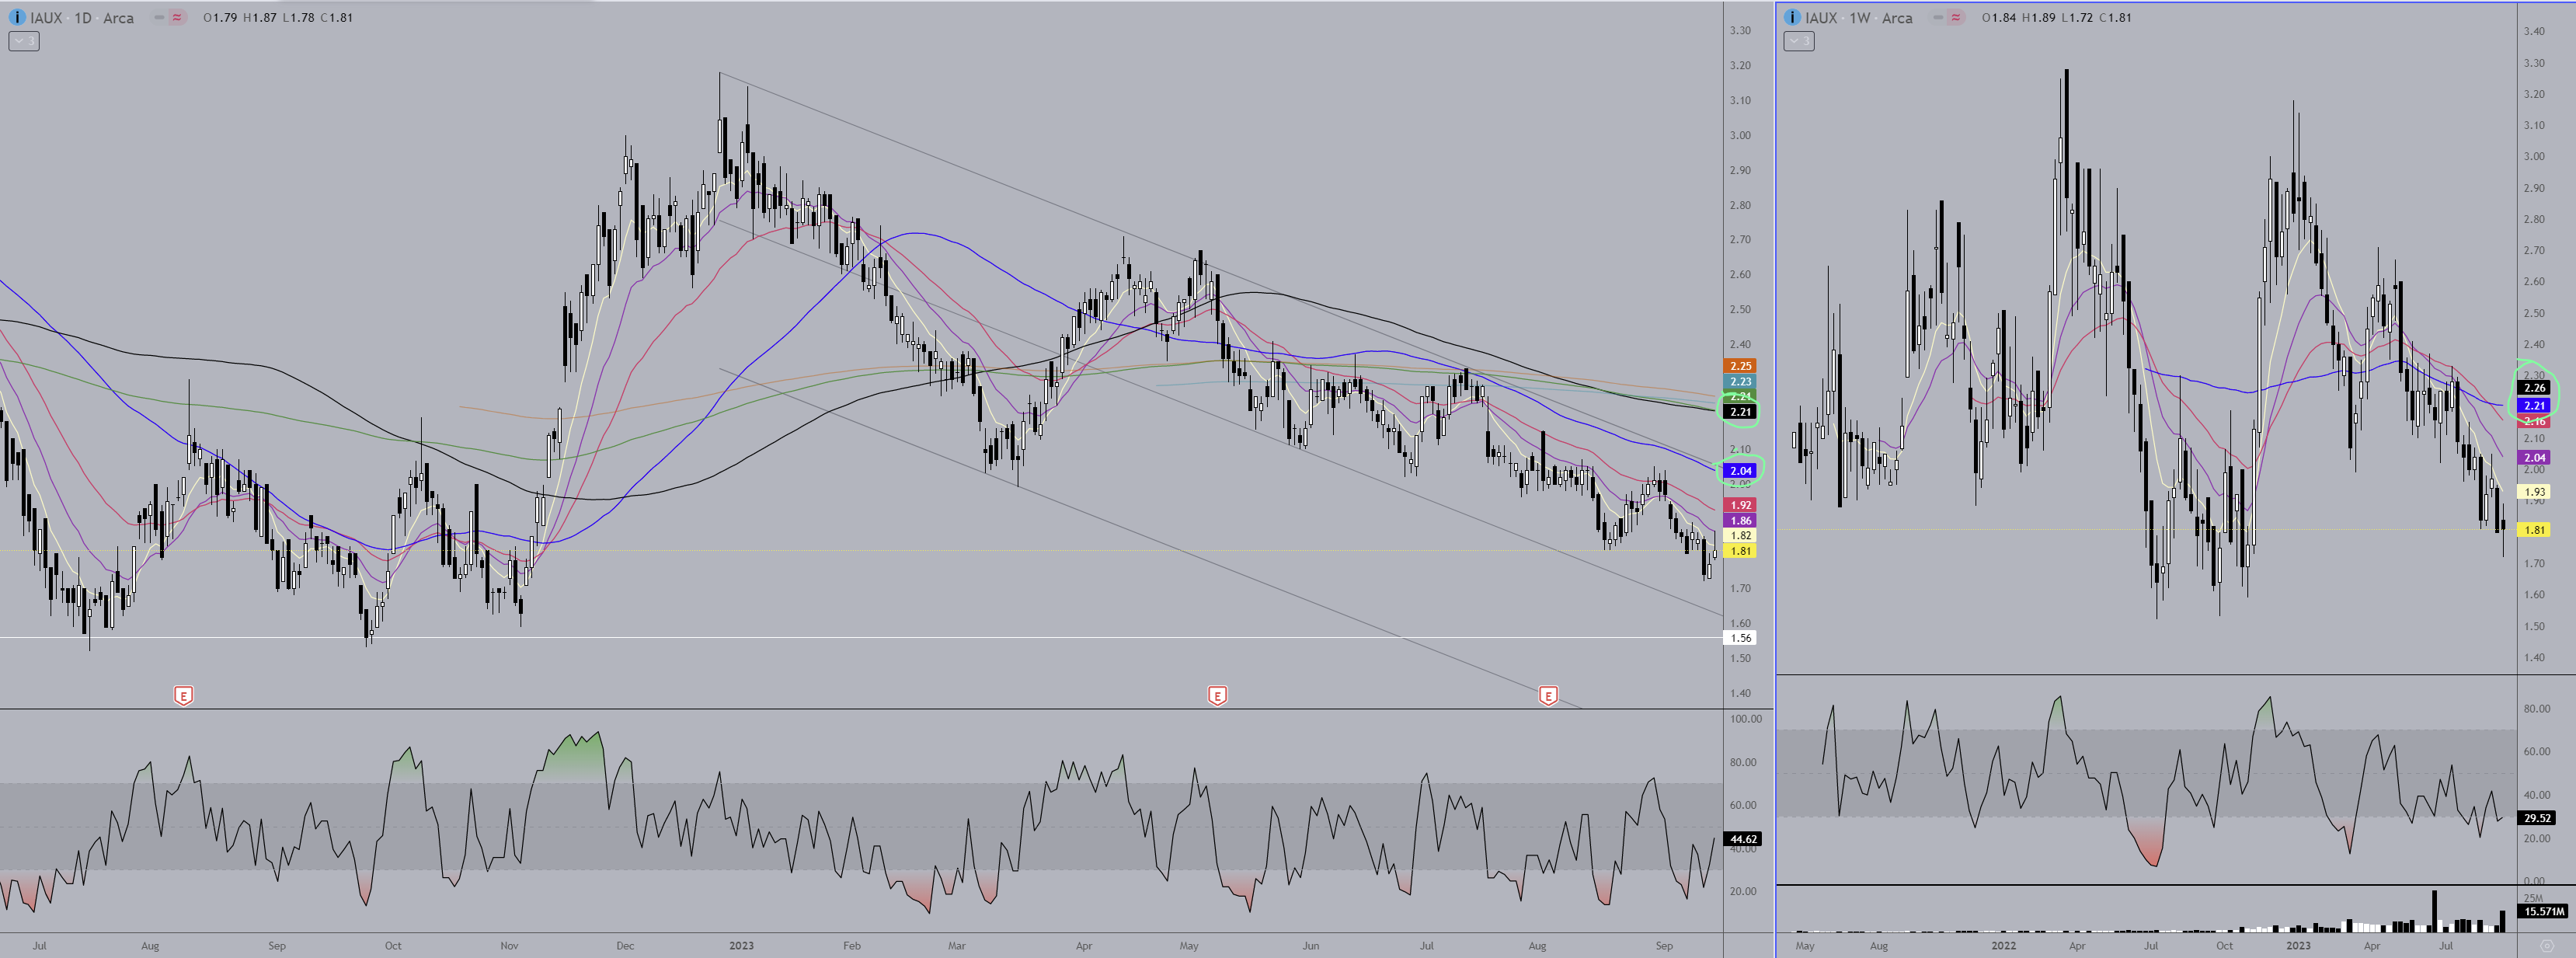
IAUX
Daily - Strong downtrend but almost erased Wednesday’s drop yesterday & today. I don’t think the channel is all that significant unless the stock turns out to be a total dud.
Weekly - It’s entire trading range is between about 3.30 - 1.50 and it’s currently near the low of that range at 1.81. It had the second highest weekly volume ever this week. Based on this week’s candle I’d say the buyers are stepping in. Looks like a pretty low risk safe bet to buy around here. The safer bet is to wait for a move to 2.21 and find support there (The black daily MA and blue weekly MA levels).
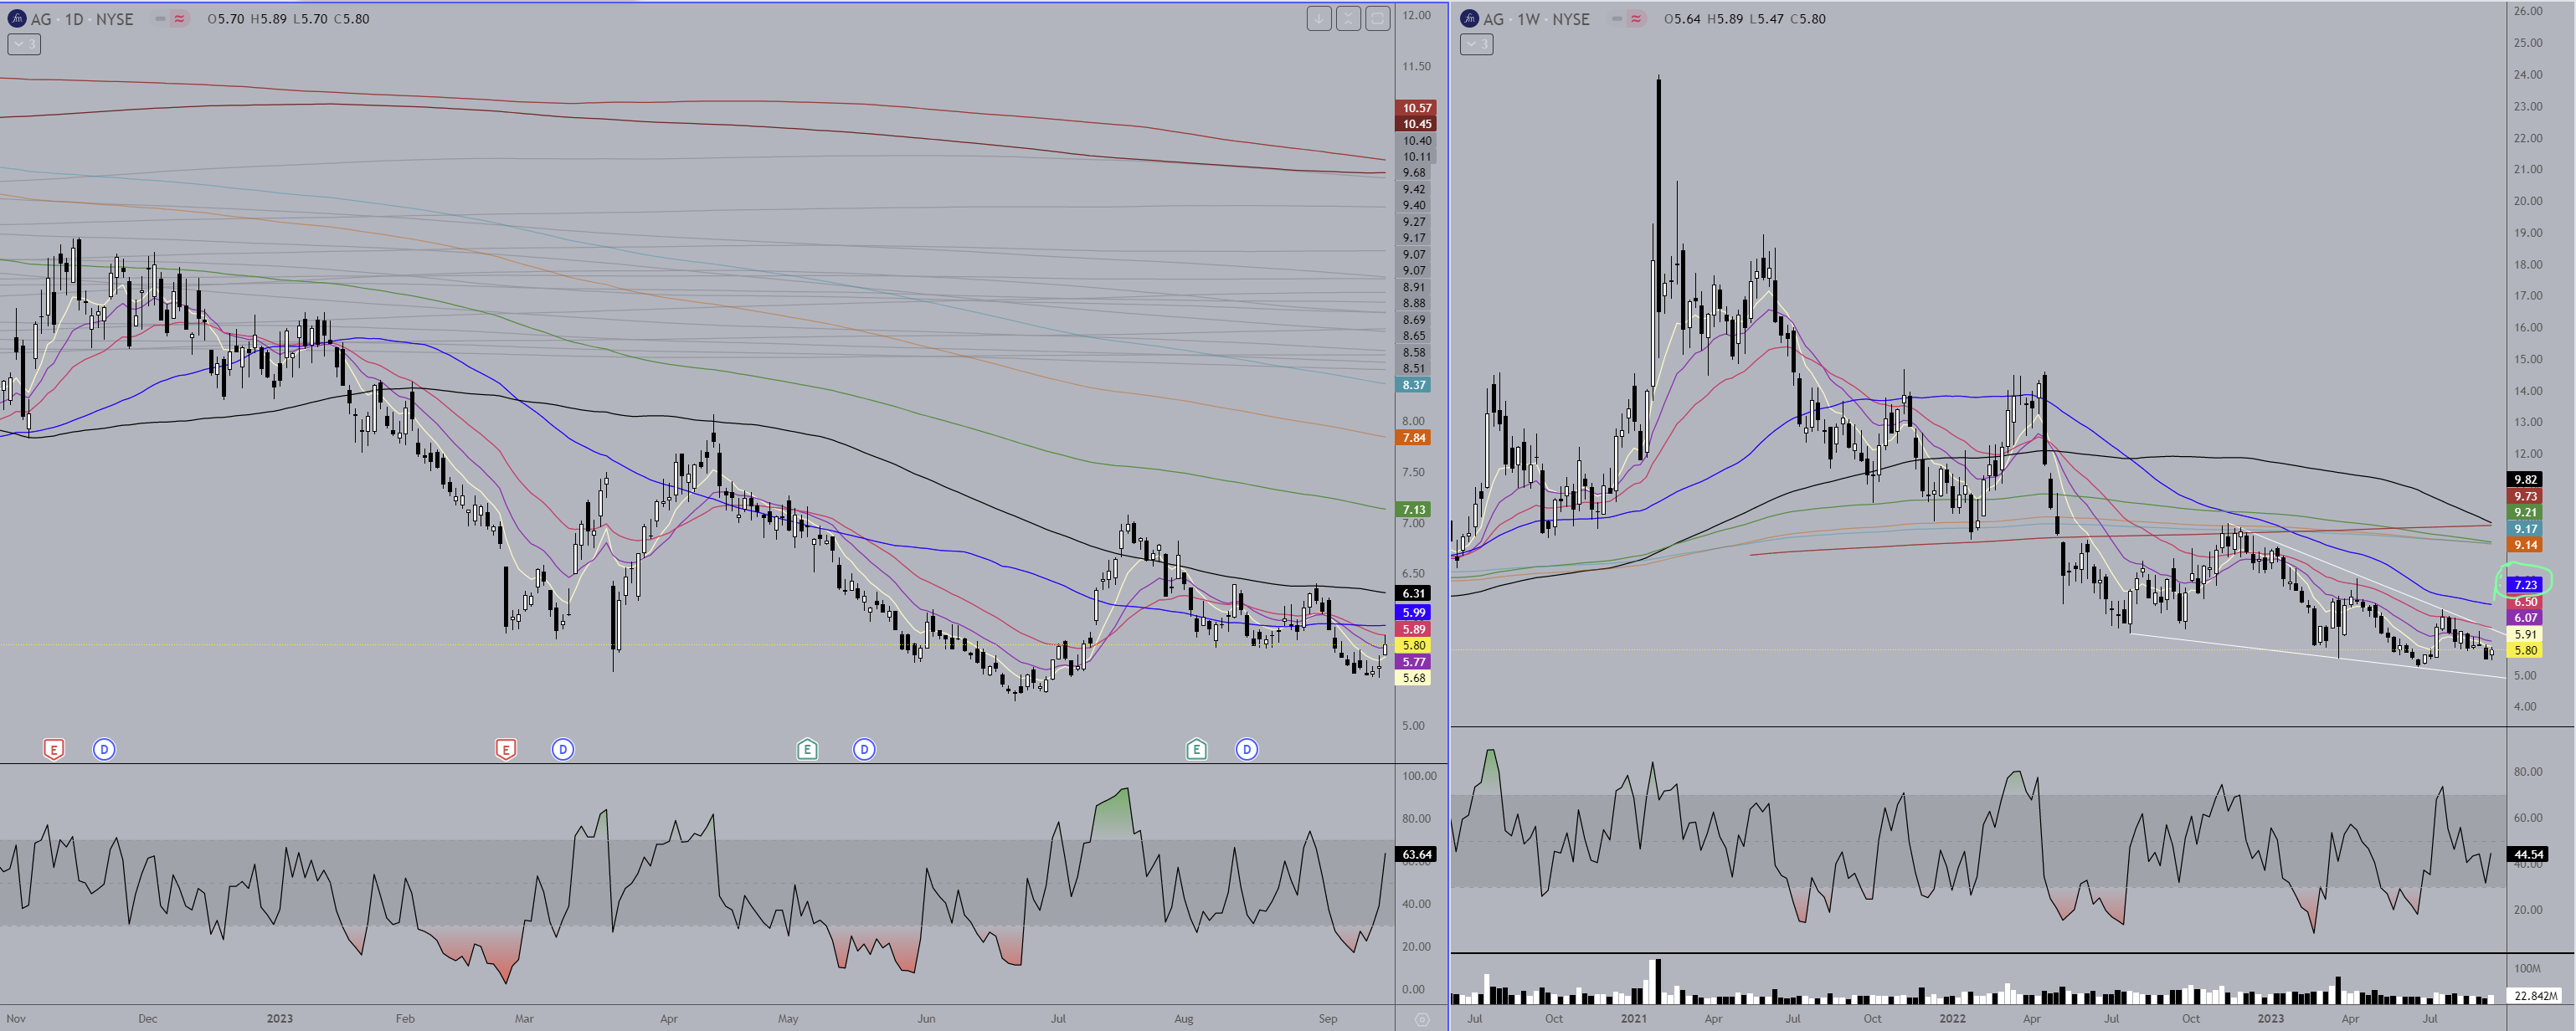
AG
Daily - This one’s been in a long downtrend from 2021 and around $24. It’s gotten a little boost the past two days as all mining stocks have but so far the only thing to indicate a change in trend is higher lows being hit this past week. It made one hopeful attempt above the black MA for a week in July but the weekly chart would have kept me from being a victim of a bull trap.
Weekly - There is some RSI divergence going on during the prior two lows and it could be nearing the fun part of a falling wedge formation which I imagine would resolve to the upside unless the company is dying. A move and support above the blue MA here would be a nice start. I’d buy the lower wedge trend line if I were to be aggressive, otherwise wait for a break up out of the channel or that move above the blue MA once support has been established.
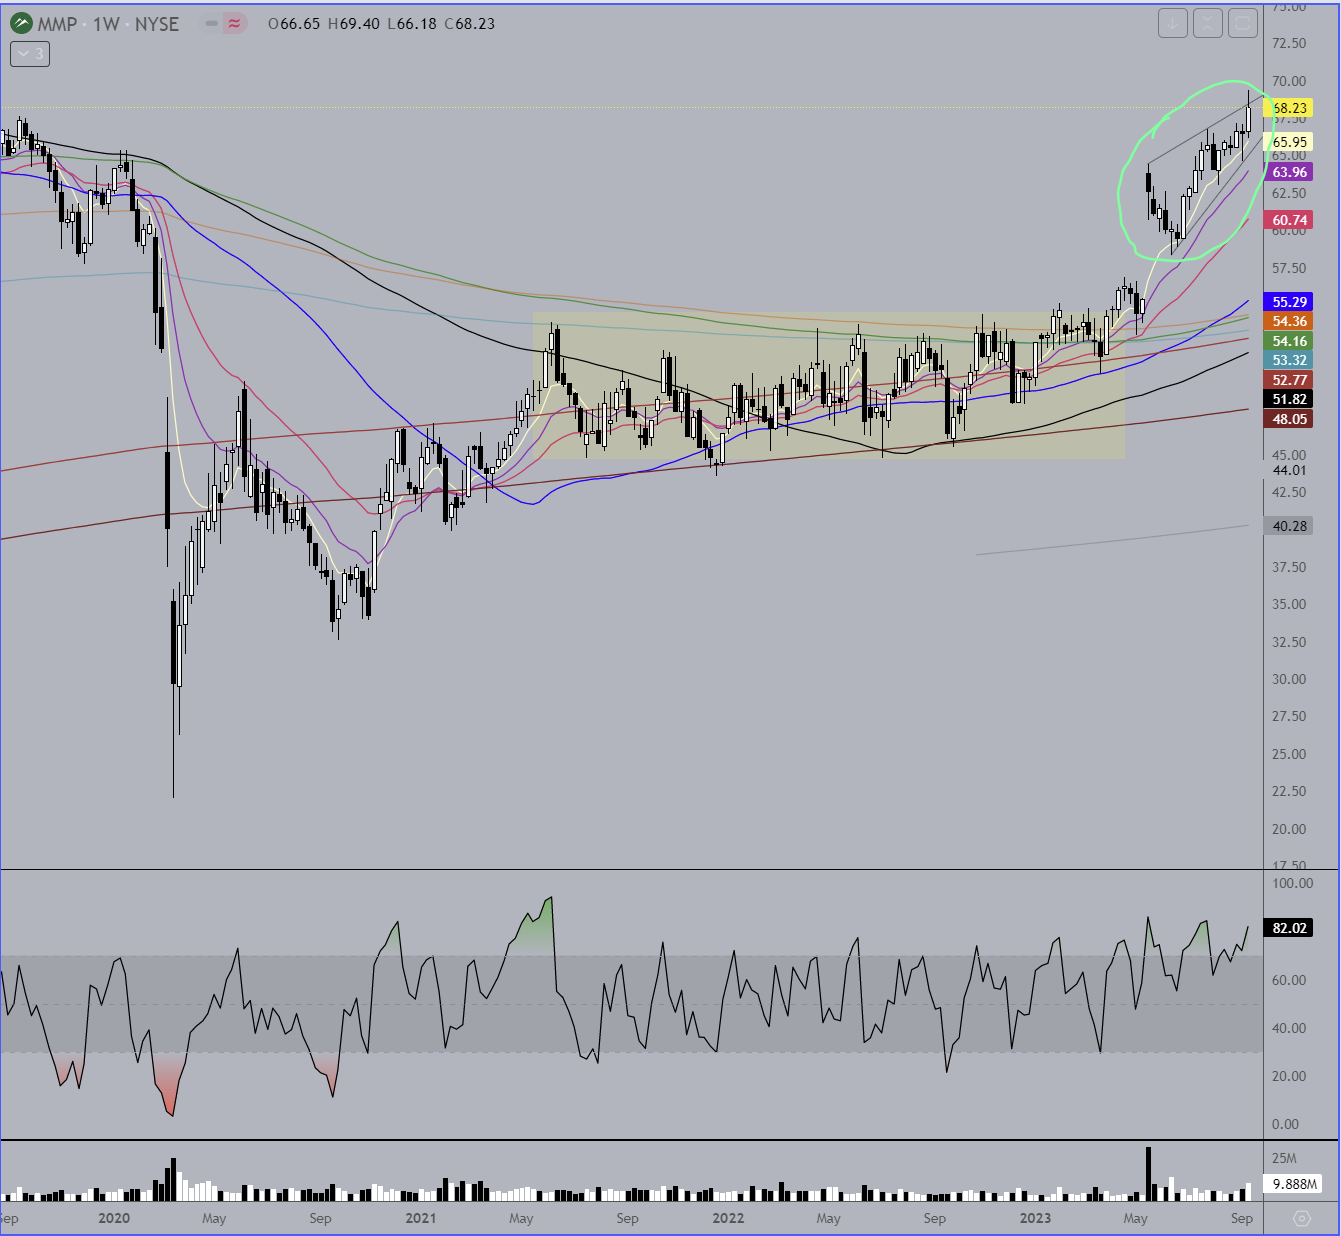
MMP - As of May of this year this company was announced to be acquired at a price of around 67.50 per share. It’s .75 above that now with a rising wedge formation almost completed. I don’t know where the deal is at now, but I don’t think I’d be buying this one at this time. ONEOK to Acquire Magellan Midstream Partners in Transaction Valued at $18.8 billion – ONEOK
The time to buy was during this consolidation phase that ended in April on the weekly chart…
Recommended reading… https://pracap.com/
Anyone interested in uranium investing, make sure you look at the two most recent entries. I’m personally not knowledgeable or all that interested in uranium, but there may be a big opportunity playing out now and for the next couple years based on the Sept 13 article.
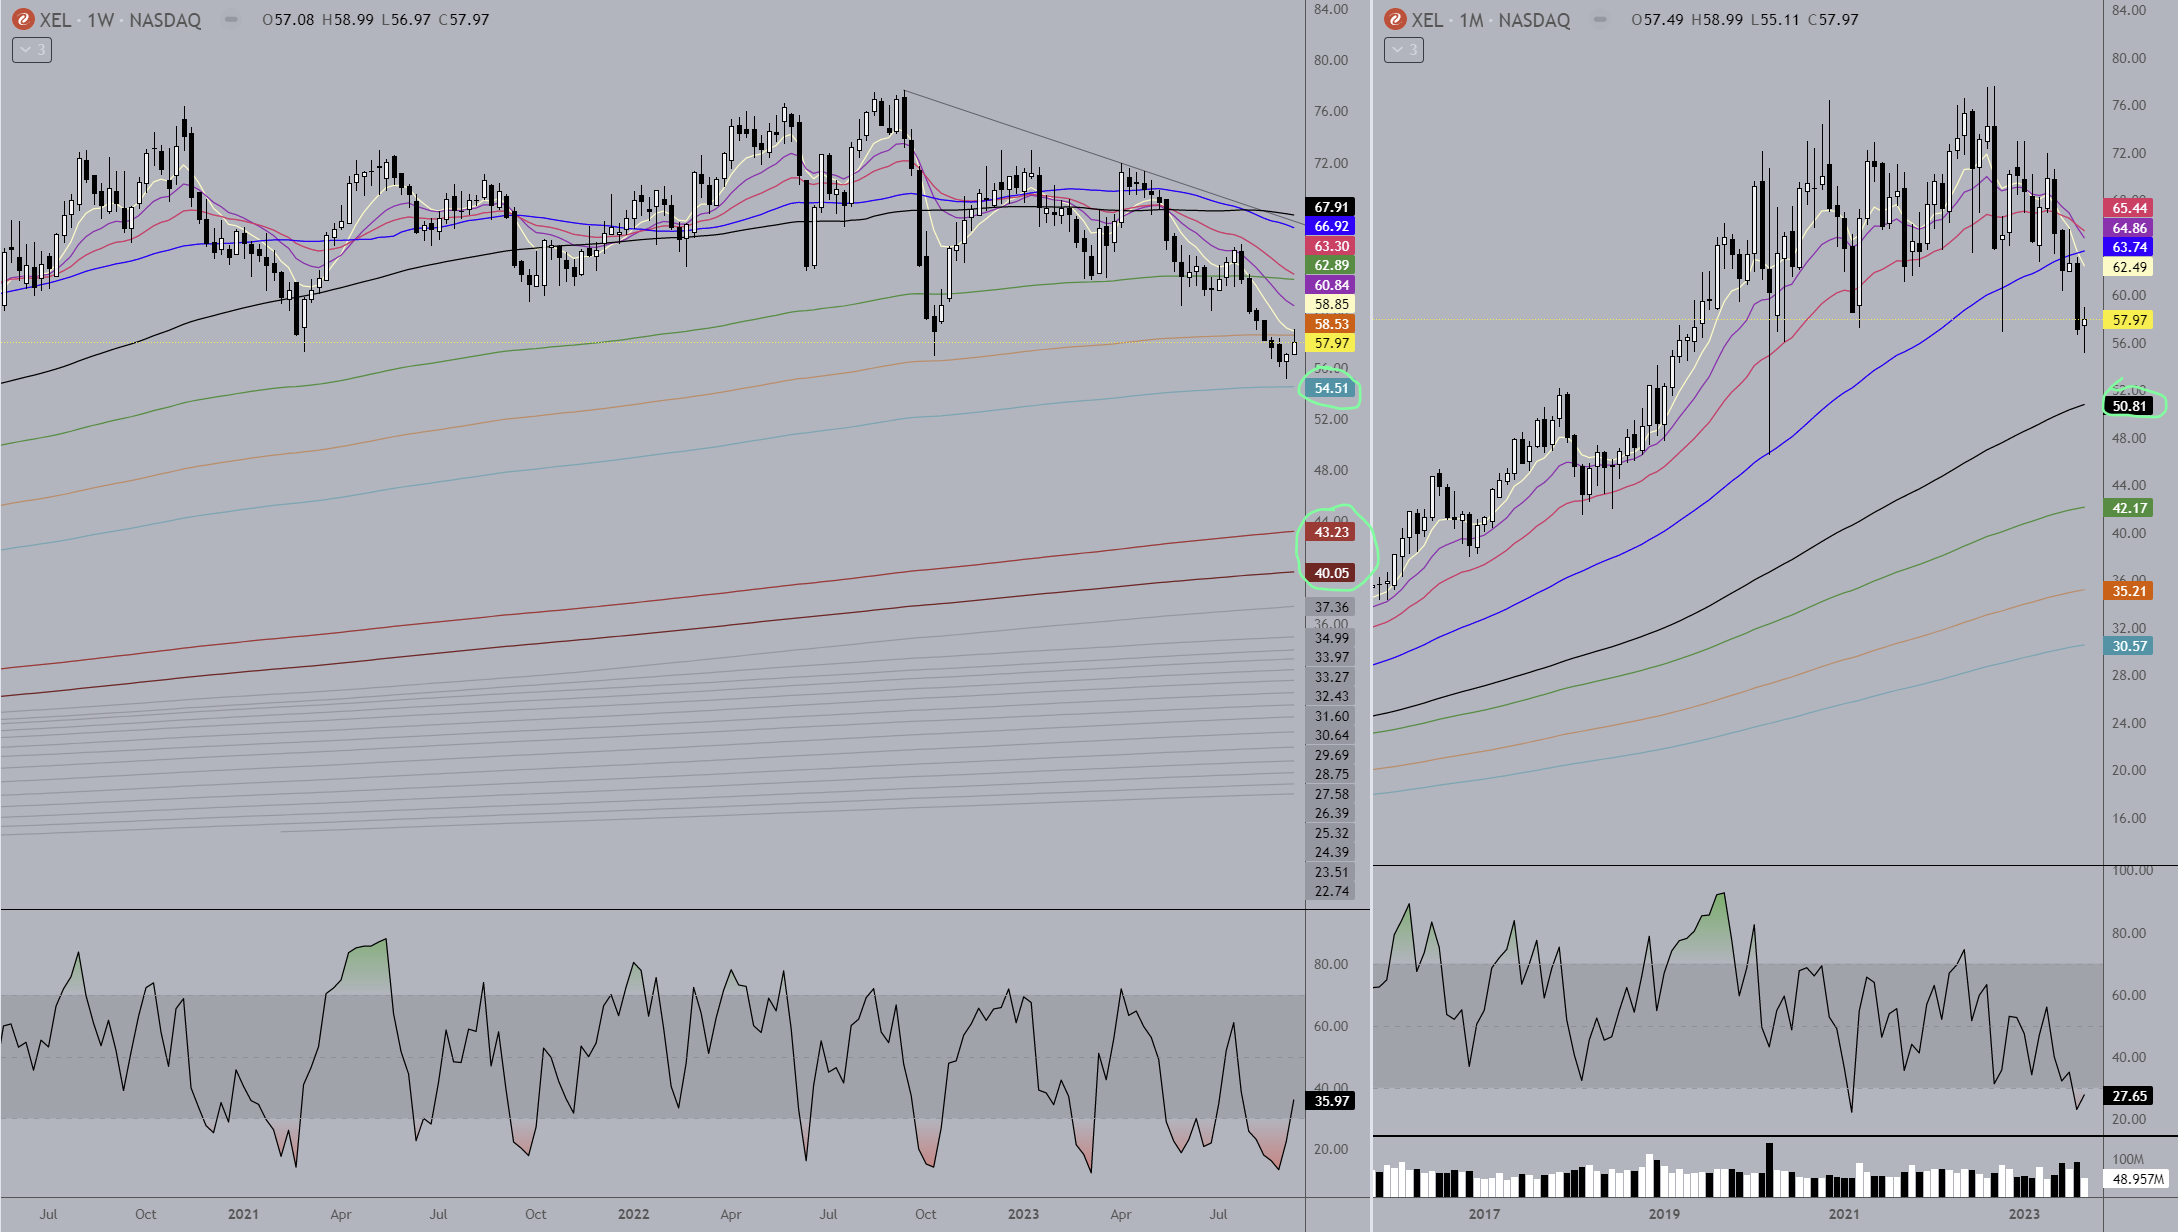
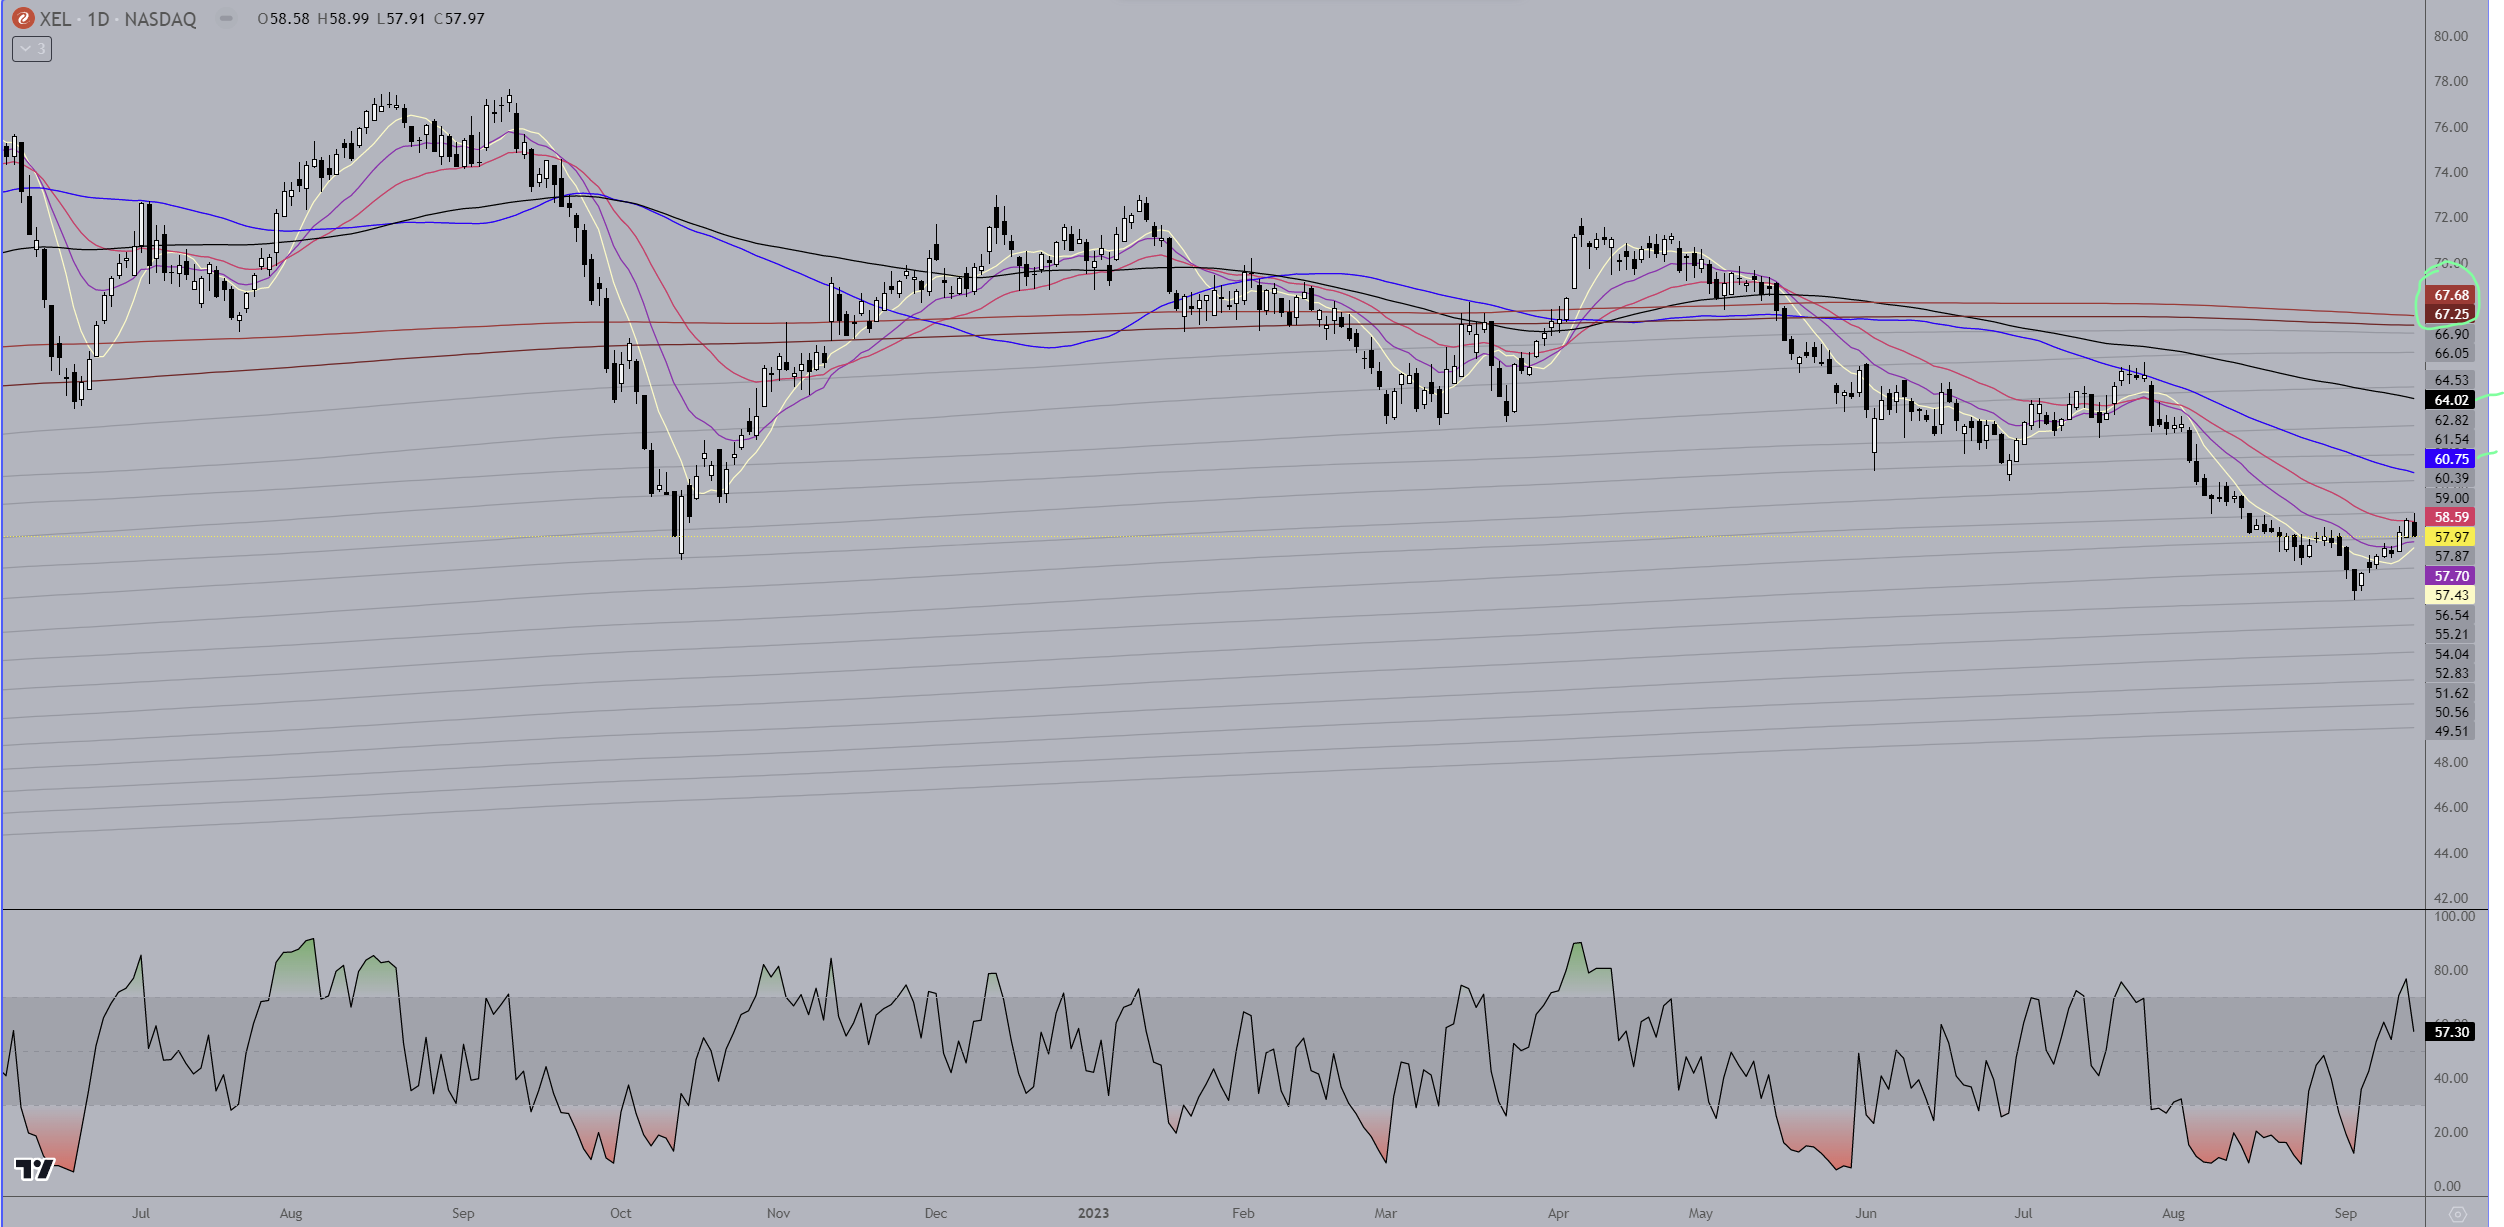
XEL
Monthly - Below the blue MA with the three faster MAs all in bearish crosses. Decent chance this gets to the black MA.
Weekly - It got a bounce two weeks ago off the lt blue MA but found resistance at my fastest MA and closed the week not looking great. The good news for now is you’ve got a range to keep an eye on between 54.50 and 58.50. If 54.50 is lost there’s a good chance it’ll see the low $50s and possibly lower…
Daily - Clearly shows the strong downtrend. Keep in mind, the black and sometimes green MA’s are usually where the trend reversals occur. So far this hasn’t gotten support at the red. Notice how the grey MA’s can work quite well for finding invisible support. 55.21 is where the bounce occurred, so see if it holds again if that price level is revisited. The two fastest MAs are turning up, but that can change quickly if XEL doesn’t get legs early next week.
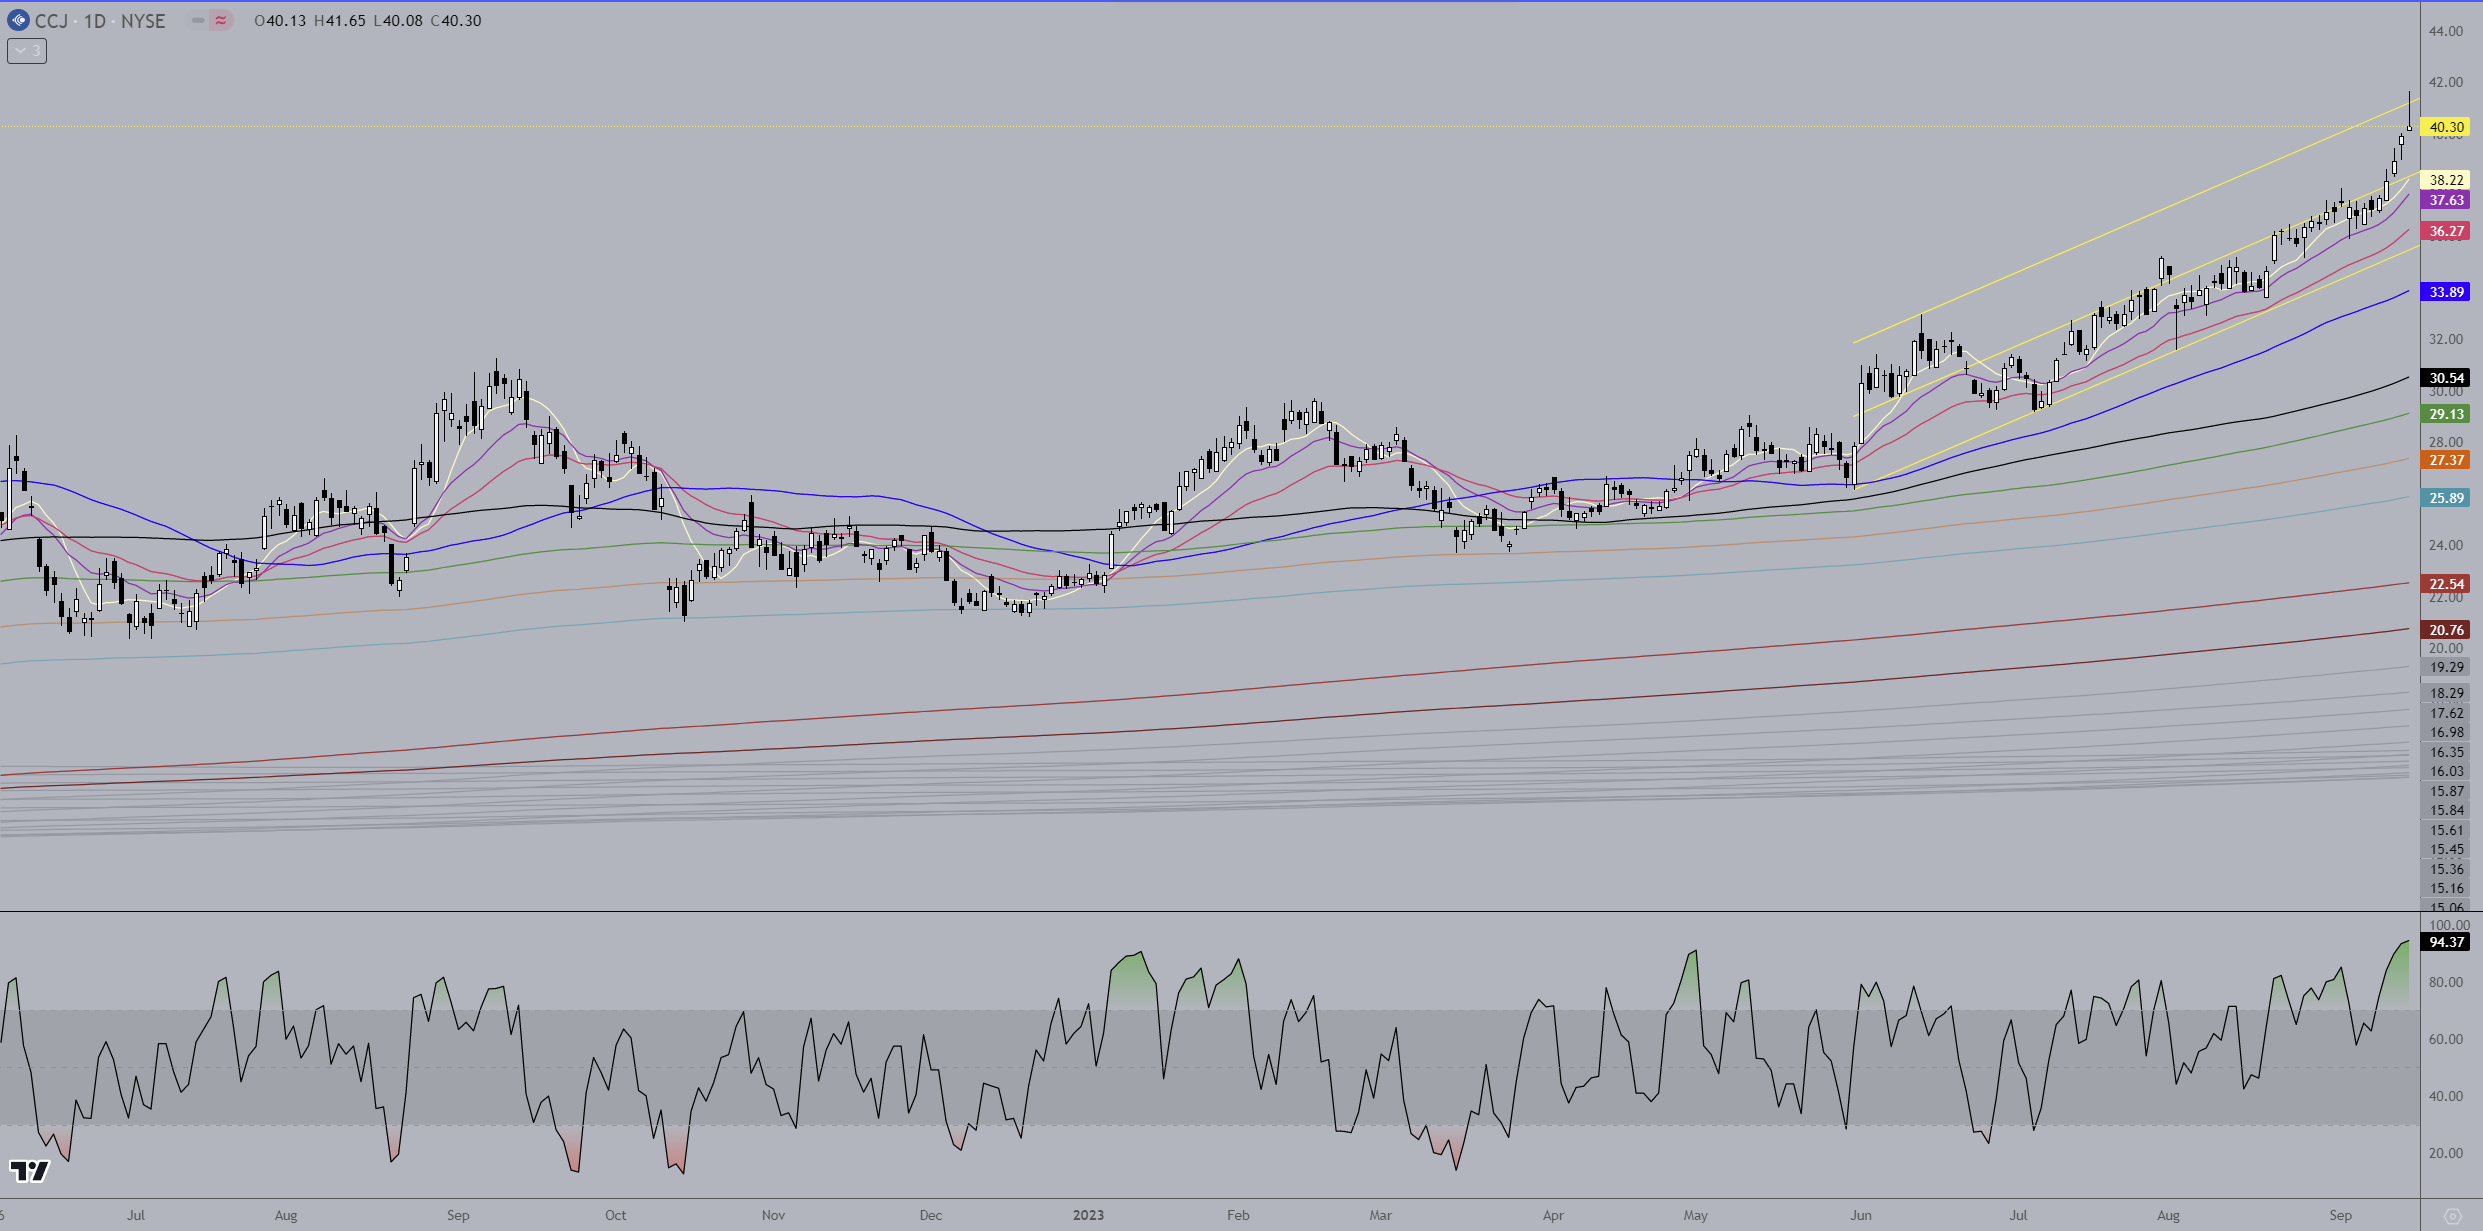
CCJ - Monthly - Nice symmetrical triangle for a year and a half setting up for this move, and look at the volume during that time compared to the volume in the breakout phase! It gives the impression anyway that there is a lot more energy for this run.
Weekly - CCJ holds the MAs pretty well. You can see a nice progression from below the brown MA’s up through them, from bearish to bullish, then the long consolidation period riding along the upper brown MA until the black MA crosses up above the upper brown and price ceases to test the upper brown anymore. A nice bull flag at the top of the consolidation after the first bit of strong movement and then off to the races.
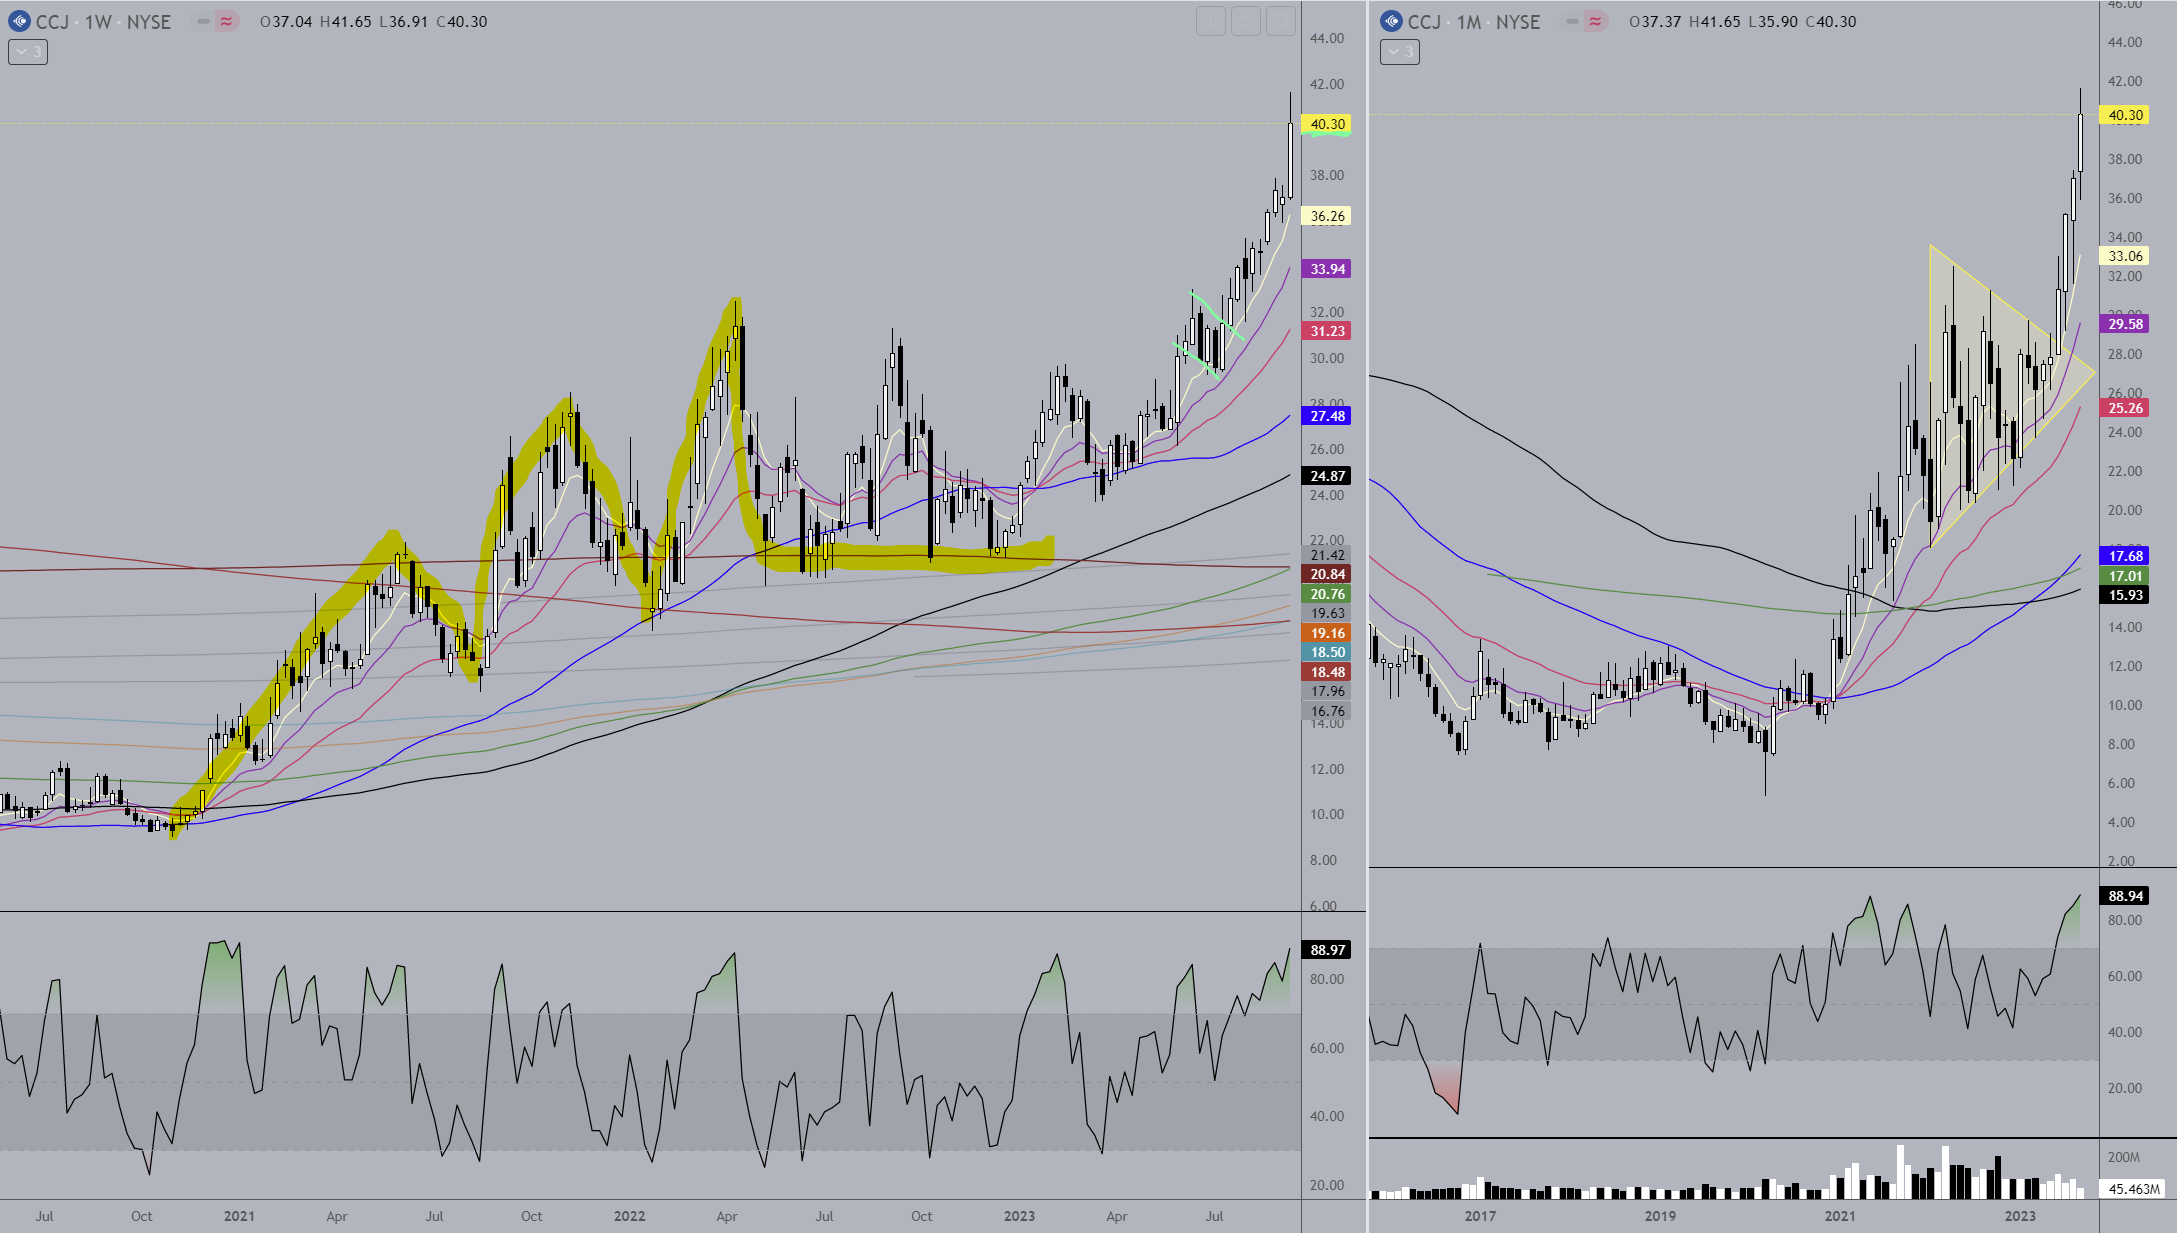
Daily - This has had a gradual move higher with an increase in momentum starting just last week. There will be pullbacks and if you’re looking to get in I would guess that the pullbacks aren’t going to go much below the red MA for now. The shallower the pullback the stronger the trend and all the signs point to this trend being pretty strong. A test of price in the area of the blue MA would be a gift, and if/when it gets to the area of the black/green MAs you have to be wary of the potential end of the uptrend, although they are also the MA’s where the deepest retracements occur before resumption of the trend.
GEN
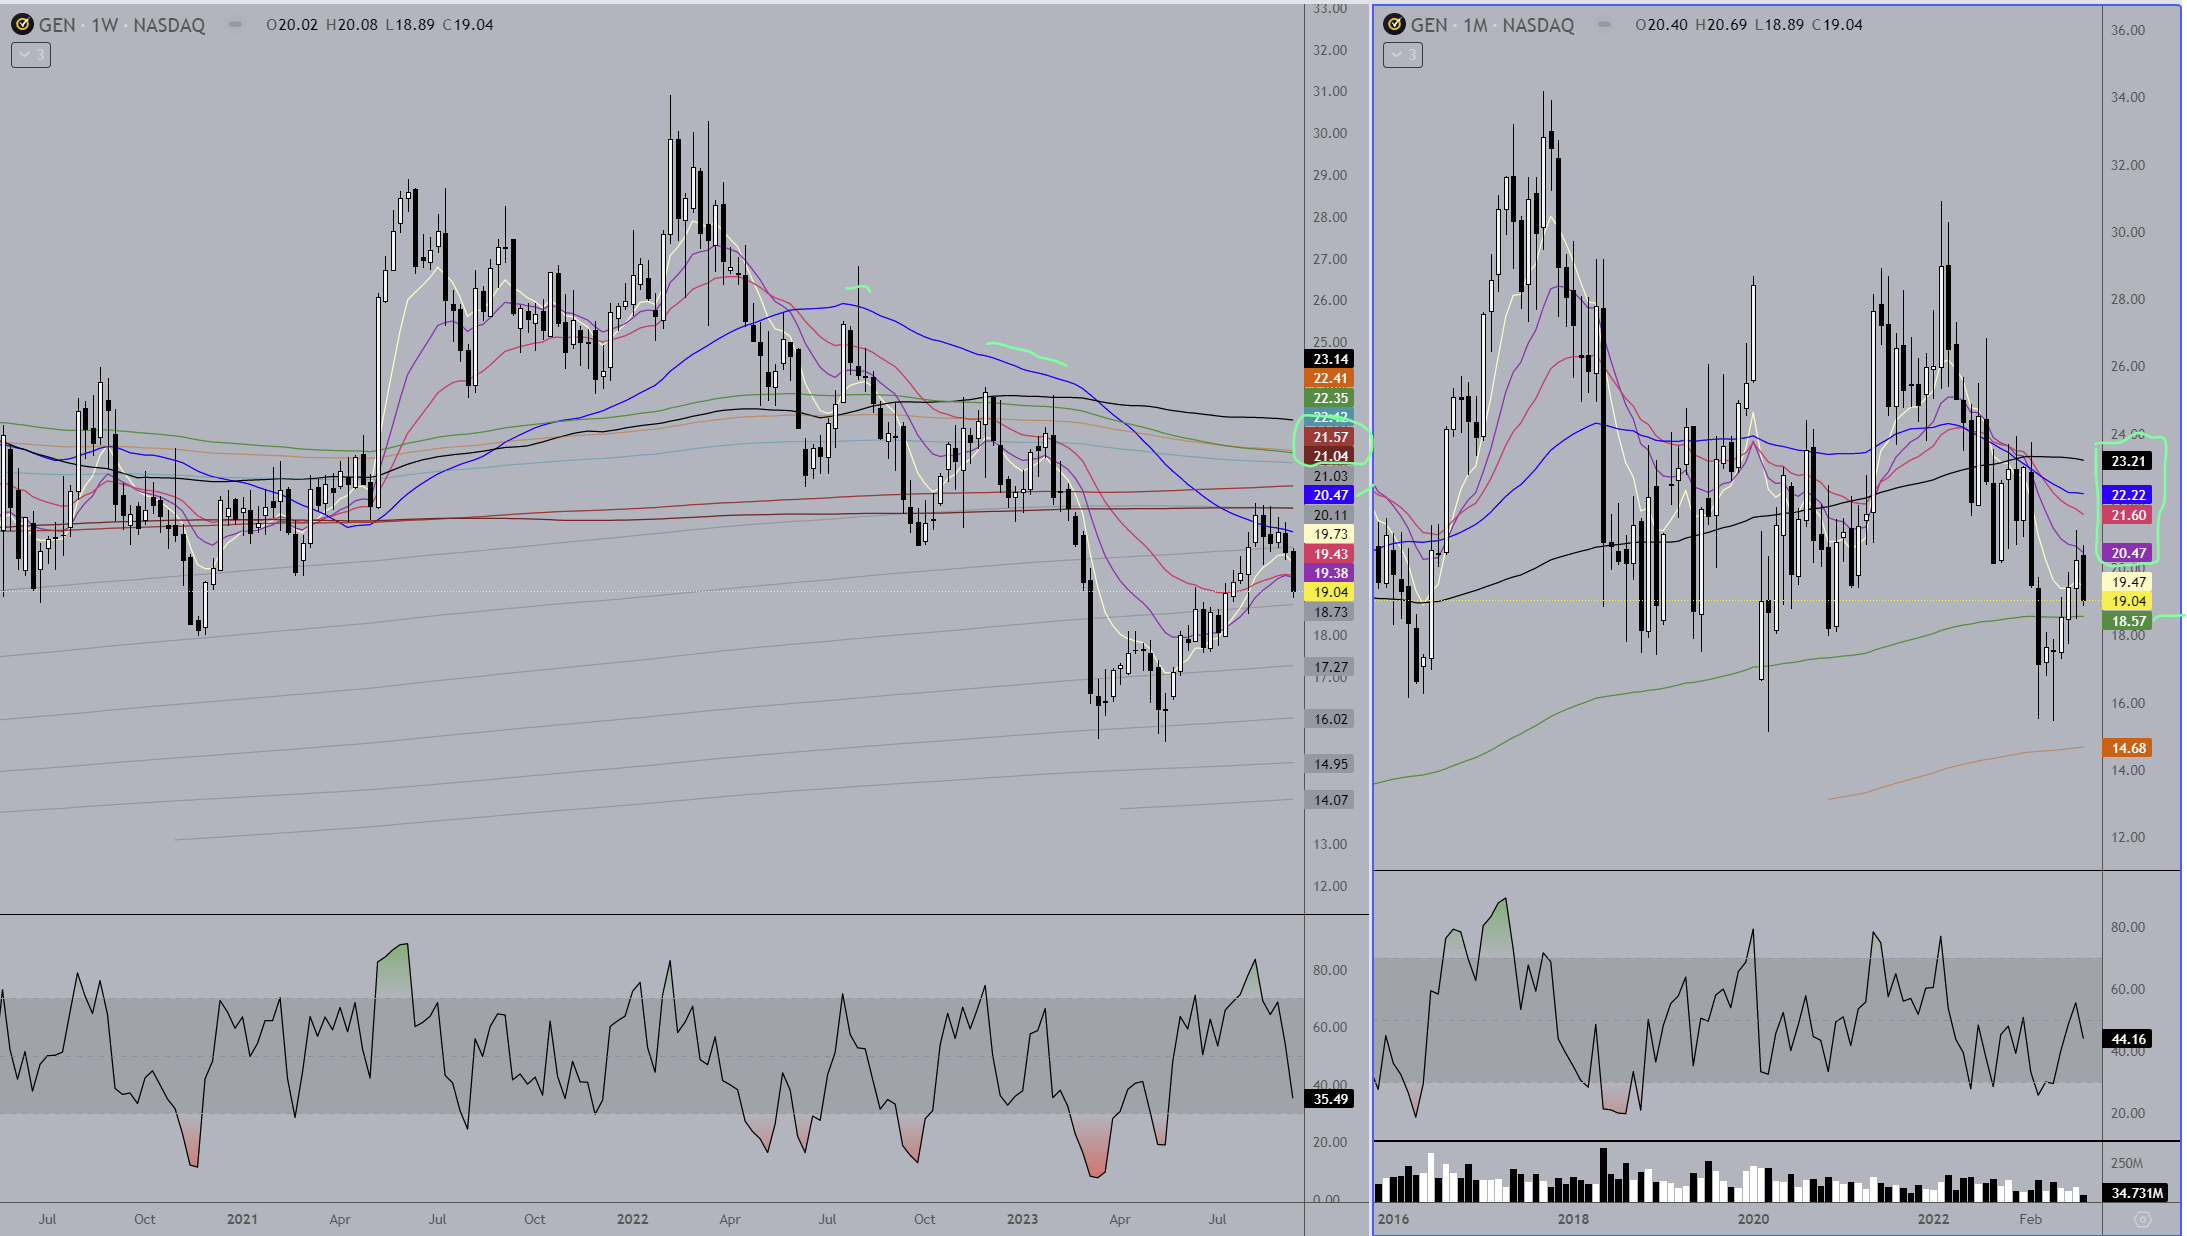
Monthly - Overall in a downtrend. It just finished a nice counter trend rally from the $15’s just into the 20’s but couldn’t get through the violet MA. Watch the price level around the green MA for support, as the other two intervals will show support levels in this area as well.
Weekly - The stock took a strong dive early this year to move it under the two brown MAs and into the land of bears. It found support in the high 15’s around one of the grey MAs, did a double bottom and had a nice counter trend move back up to the blue and browns where it attempted to consolidate in a bull flag. But, the bears said “nope” and last week had a breakdown which closed it below all the fast MAs. The grey MA at 18.73 was a decent resistance area where a bull flag formed under for a month before a move higher, so it could act as support now and it correlates with the green MA on the monthly. So now keep an eye on the price areas where the greys are and see if one of them gives support before a move back down to the lows.
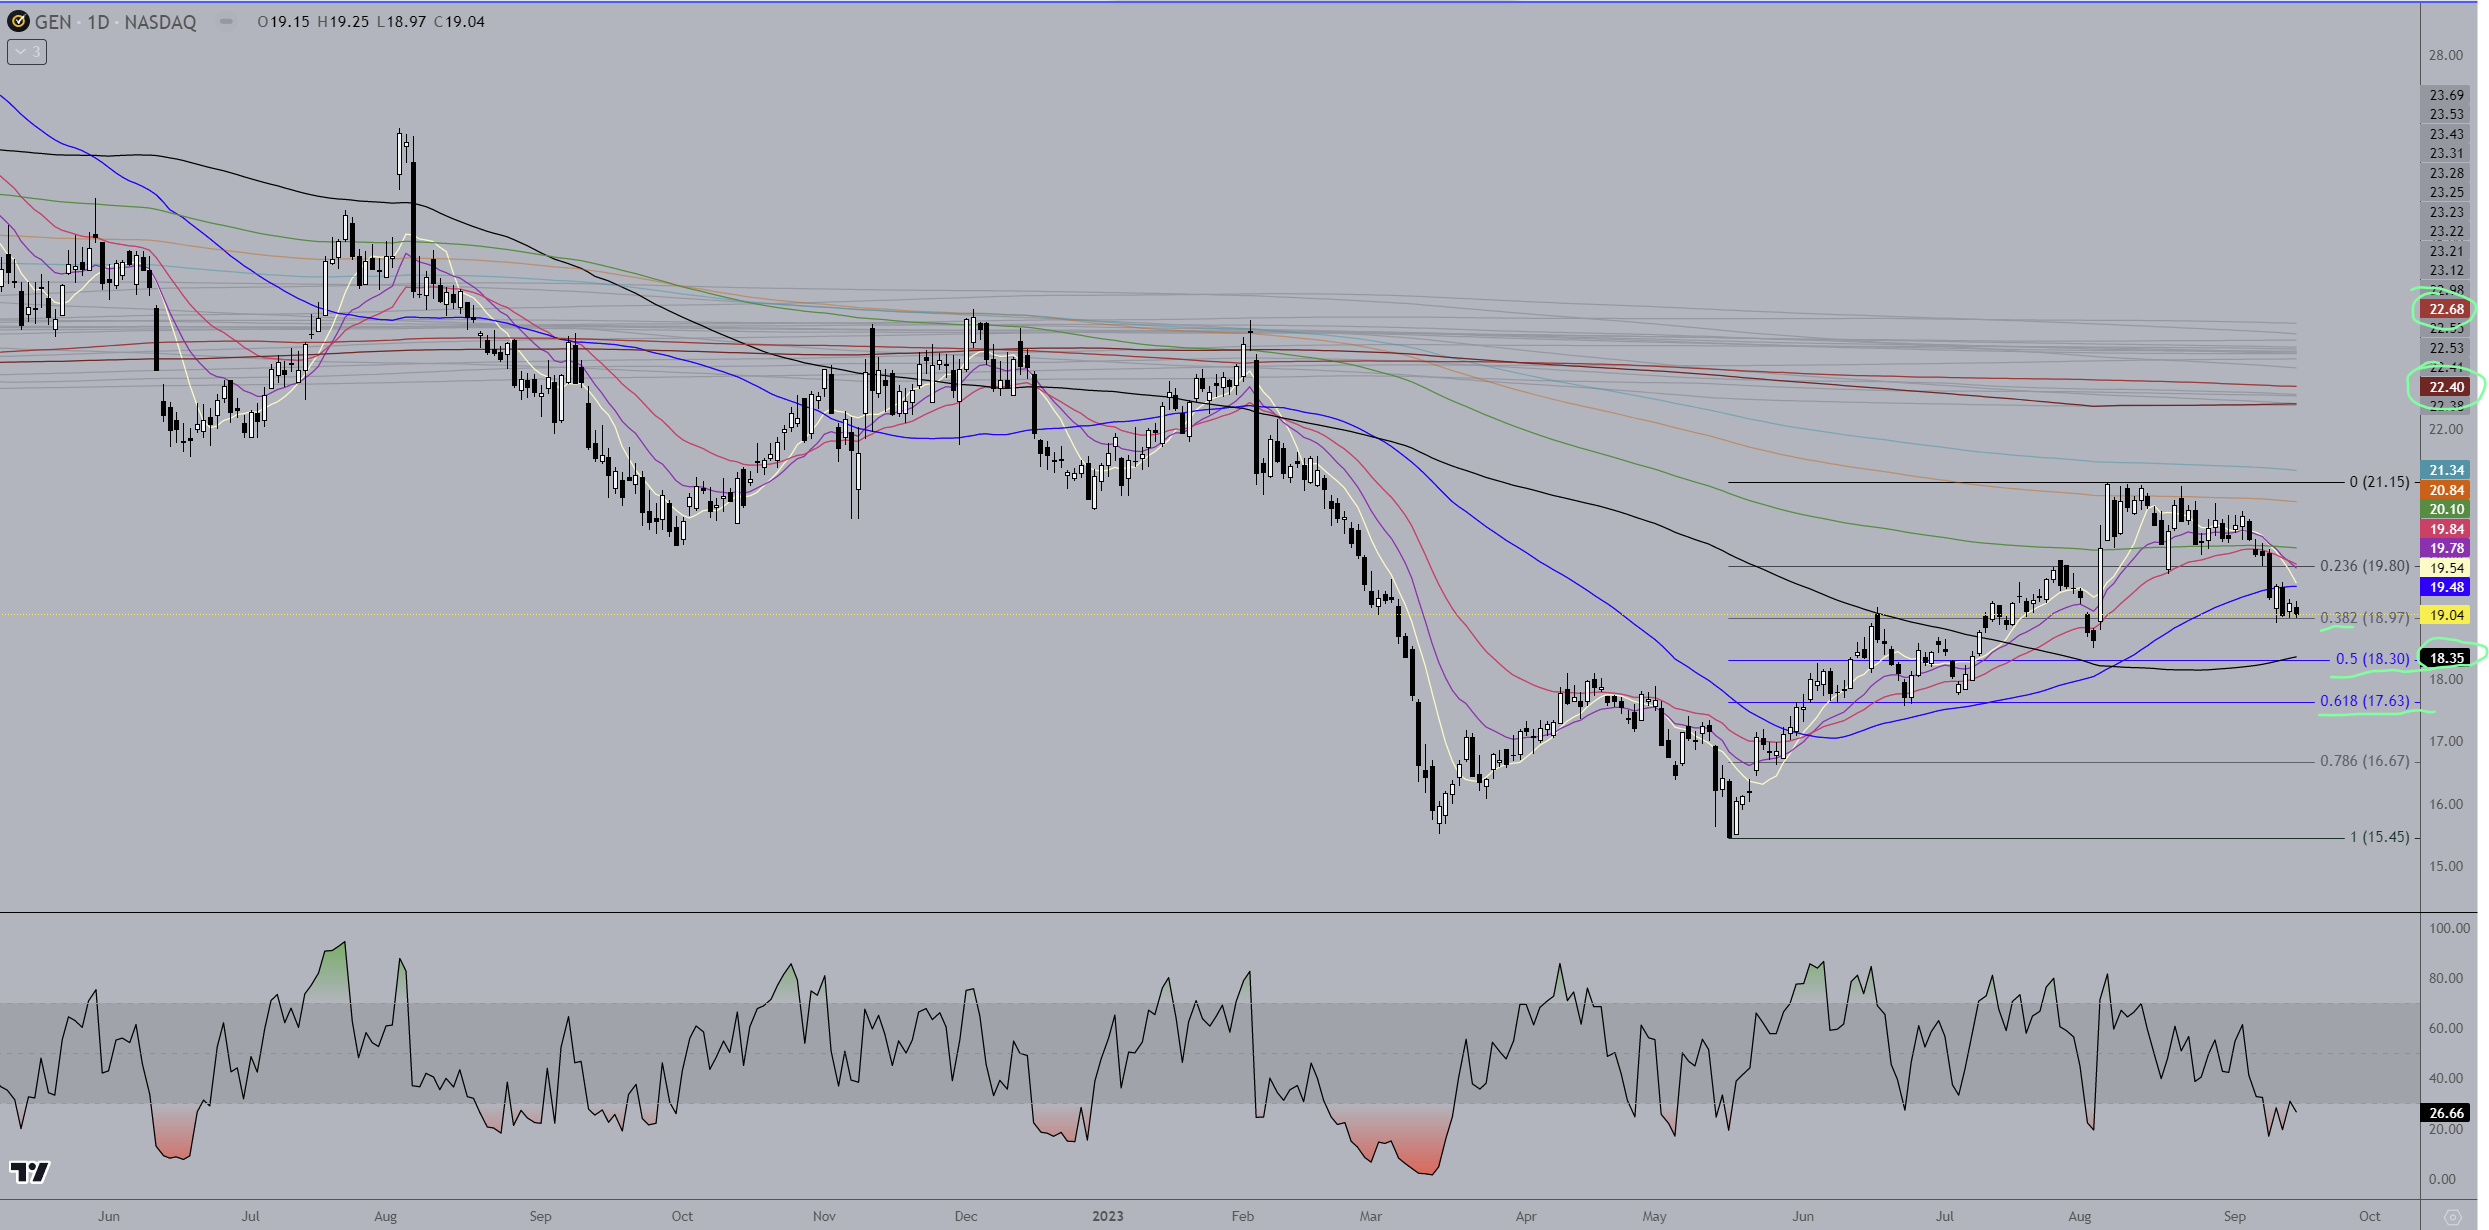
Daily - There are three separate things to pay attention to on this chart; 1. The lows of each retracement, which so far are all higher lows, so the uptrend is currently intact. 2. The stock has had a 37% run in 4 months, so a retracement is normal. So far it is holding the 38% retracement. Although it would in one sense end the uptrend, the 50 - 68% retracement levels are acceptable, normal levels for retracements to go to. Watch those areas for support and a continuation of the uptrend. 3. Although the fast MA are turning down, the black is the one that can make or break it, and it’s sitting on the 50% retracement area and turned up. The blue is still turned up as well. So between the 3 interval charts here there are several areas to watch for support on a continued pullback. Do keep in mind though that on both the weekly and daily charts the stock is trading under the brown MAs. It may be in the process of working its way back up to the bull side, but I would be cautious until it does.
PSYTF
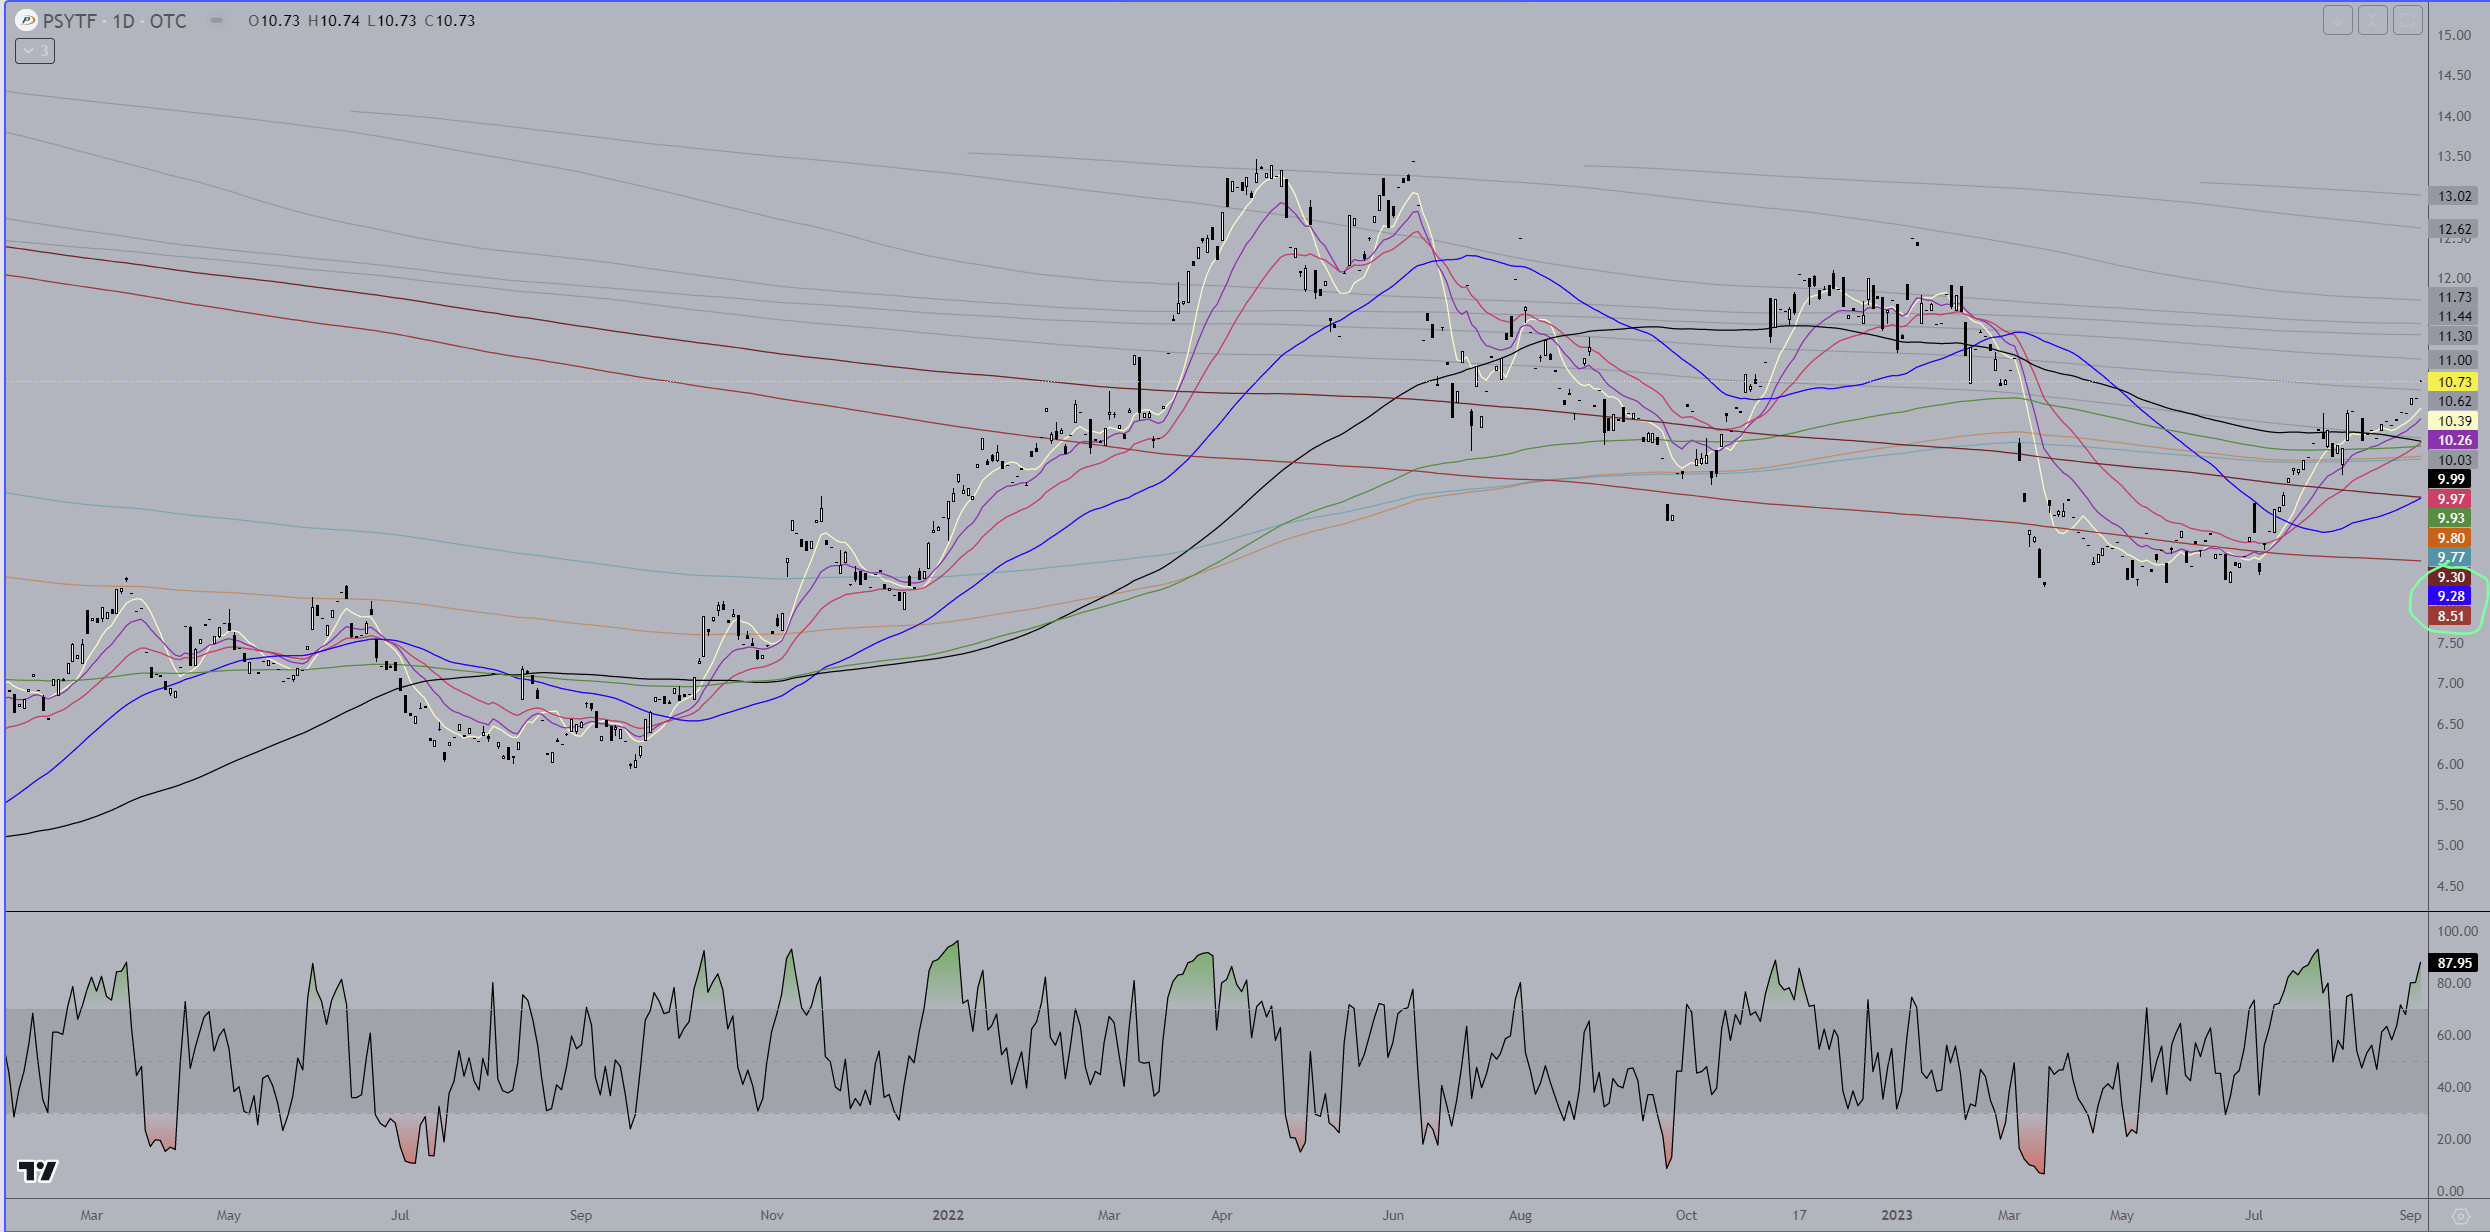
And saving the hardest for last… we have a super low volume OTC stock… but the MAs work surprisingly well on it, at least what there are of MAs.
Weekly - The stock took a hard fall from early 2015 into bear territory and stayed there until it began toying with the bullish side of things early last year. You can’t see the brown MAs on this chart because it hasn’t been trading long enough for there to be any, but they’re on the daily. The stock bottomed in late 2020 and made a nice progression up through the fast MAs until early 2022 where it began what appears to be a consolidation in a slightly falling channel. Because of the extreme low volume here, (it hasn’t traded 5000 shares yet this month), it’s not going to hold the MAs very well, although it’s still pretty good. Currently the channel its in is looking like a bullish consolidation. The black MA is sloping slightly upward, the blue is above it though sloped slightly downward and moving towards a pinch between the black and blue. Price has moved back above all the fast MAs and the three shortest are all turned up nicely. So now watch and see what a move to the upper channel does if it gets there. A breakout will likely take it to the lt blue MA at 13.31 and a break above that could get it to 15-16.
, probably due to the very low trading volume, preparing for an eventual breakout into the $15’s - 16’s.
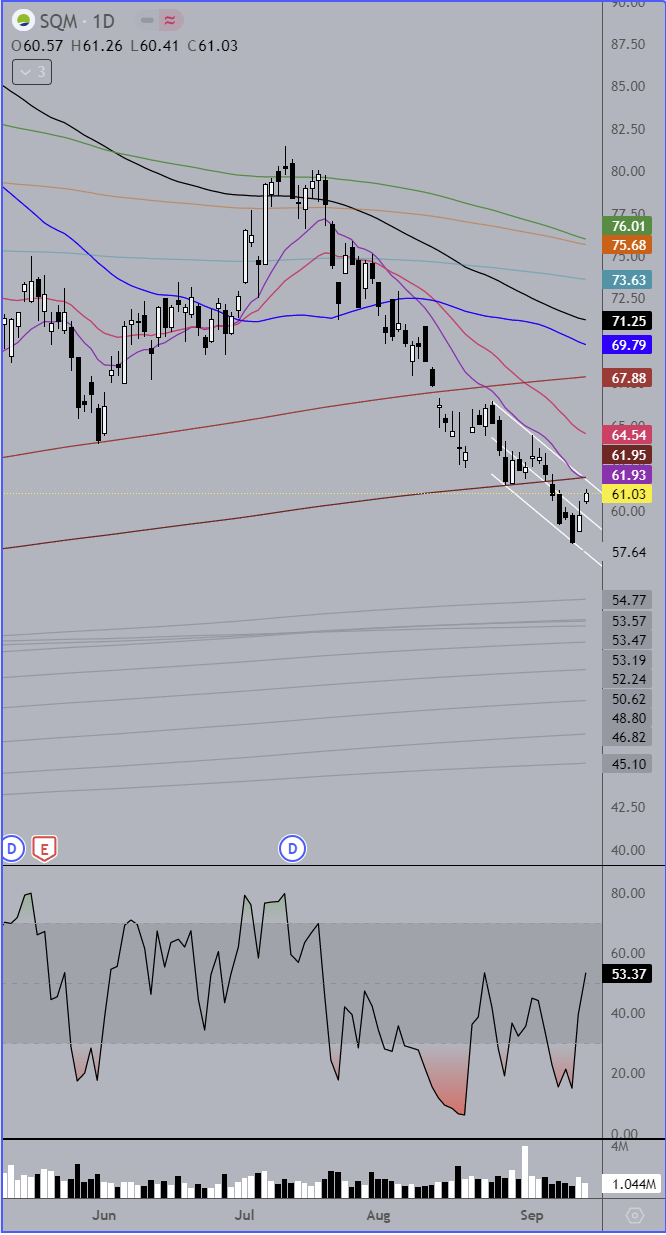
SQM Update
Daily - I previously posted about the falling channel this was trading in. It did break up out of the channel Friday and of course closed right on the channel line. It probably means price will head lower back into the channel, but keep an eye on the price level of the lower brown MA right at $62.
1 Like