Hi JimmyP,
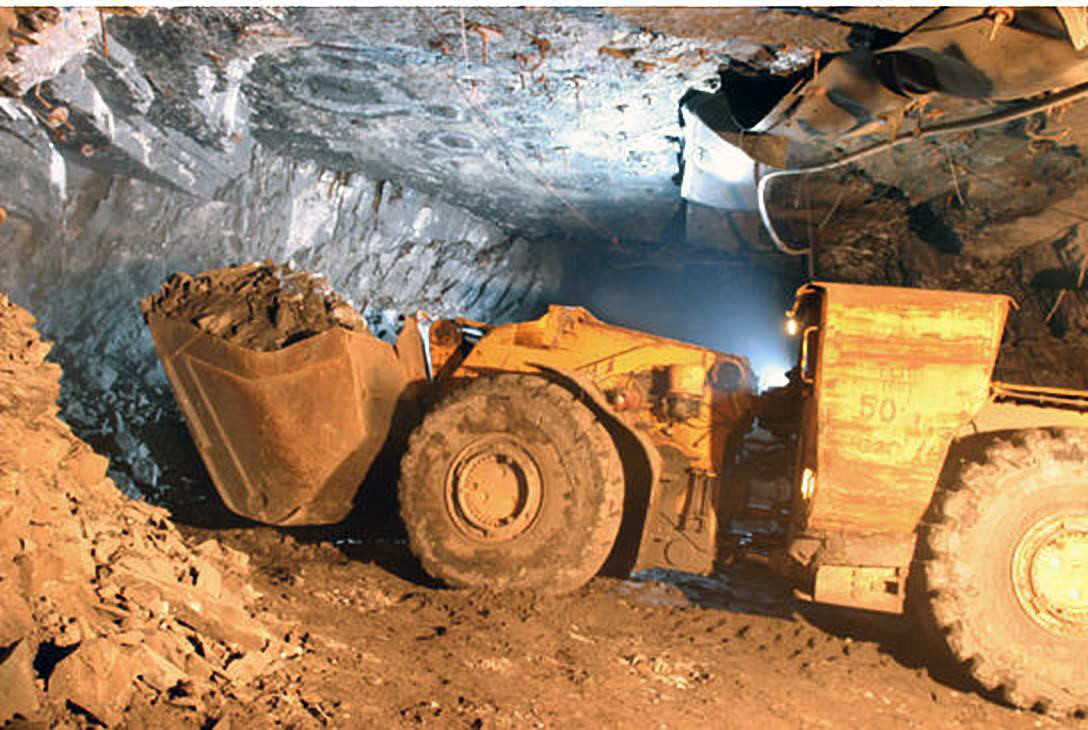
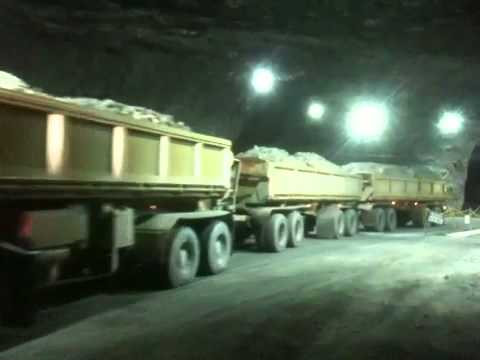
In mining, a lot of the costs are FIXED and based on a PER TONNE MINED or PER TONNE PROCESSED basis. Labor is one of the largest costs. I like to think of costs in terms of cost per “blast cycle”. In an underground project, each blast cycle involves the miners drilling a dozen or so holes into the working face of the adit, stuffing the holes with dynamite or ANFO and blowing it up. They then let the dust settle and scoop up the ore and deliver it to Auryn’s on site crusher and then deliver the crushed ore to ENAMI where it is processed. At the Fortuna project, each blast cycle produces about 50.4 tonnes of ore. WHETHER THAT ORE GRADES OUT AT THE NORMAL 6 OR 7 GPT ORE IN MOST UNDERGROUND OPERATIONS OR 45 GPT ORE LIKE AT THE DON LUIS 1 VEIN, THE MINERS WILL BE PAID THE SAME AND ENAMI WILL BE PAID THE SAME. Actually, ENAMI charges less per tonne processed when you send them high grade ore. This is because they will pay you copper, moly and silver “byproduct credits” if the ore grades are over 25 gpt gold.
When you’re talking about the economics of a mining operation, you can talk in terms of what you’re paid per tonne of ore processed and the costs per tonne of ore extracted or you can break it down into what you’re paid per ounce of gold produced (about $1,800 per ounce) and what it cost to produce an ounce of gold. When you’re dealing with extremely high-grade ore like that present at the DL 1 Vein, the relatively fixed costs per tonne get spread out over a lot more ounces than in the case of the operation next door mining 6 or 7 gpt ore. Thus, the cost on a PER OUNCE basis is extremely low compared to the mine next door. There is an inverse relationship between the grade mined and the cost “per ounce” mined. Last year, the average “All In Sustaining Cost” (AISC) worldwide to mine an ounce of ore was $907. An average ore grade of 45 gpt gold is EXTREMELY high. On a per ounce basis, the cost to produce that ounce of gold is going to be EXTREMELY low when compared to operations dealing with ore grades of 6 or 7 gpt gold. The guys next door are still probably making a lot of money at $1,800 gold but an operation mining 45 gpt gold will blow it out of the water from an economics point of view. My gut feeling is that once Auryn starts hitting on all cylinders, their costs will be well below that $700 figure. If that comes to fruition, then multiply the number of ounces produced per year by $1,000 to get an estimate of potential profits.
As far as your question about the proper EPS multiple to use for an operation like Auryn’s, the new producers able to grow their production by a couple of hundred per cent in a hurry won’t trade by multiples of EPS. Smart investors will factor in the “PEG” ratio. This is the EPS ratio divided by the projected 5-year growth in production. The lower the “PEG” ratio, the better an investment represents. If a major miner is trading at 20-times earnings and has a projected 5-year growth rate of 20% then its PEG ratio will be a somewhat neutral! If a new producer is trading at 20 times earnings and it has the ability to increase the number of working faces it produces 10-fold (900%) in 5 years, then its PEG ratio would be 20 divided by 900 or .022. What’s the better buy? A PEG ratio is much more accurate than an EPS ratio. I intentionally put my 20 times earnings ratio knowing it was grossly conservative.
Notice the relationship between GRADES and PROFITS. High grades give you low costs when dealing on a “per ounce” basis. When dealing with $1,800 gold low costs give you higher profit margins and higher earnings per share (EPS). The higher growth rates belonging to a brand-new producer able to go from 1 to perhaps 6 working faces rapidly, will command a much higher EPS multiple than the norm. Let’s say maybe 40 or 50-times but only for a while until the growth inevitably plateaus out. Being able to multiply a much higher MULTIPLE of EPS times a much higher EPS because of low costs on a “per ounce” basis allows for significant potential share price enhancement.
Below is an article on PEG ratios:
What’s Considered a Good PEG Ratio?
J.B. MAVERICK
Reviewed by
AMY DRURY
Updated Aug 12, 2021
The price/earnings to growth ratio, or PEG ratio, is a stock valuation measure that investors and analysts can use to get a broad assessment of a company’s performance and evaluate investment risk. In theory, a PEG ratio value of 1 represents a perfect correlation between the company’s market value and its projected earnings growth. PEG ratios higher than 1 are generally considered unfavorable, suggesting a stock is overvalued. Conversely, ratios lower than 1 are considered better, indicating a stock is undervalued.
PEG Ratio vs. P/E Ratio
The price-to-earnings (P/E) ratio gives analysts a good fundamental indication of what investors are currently paying for a stock in relation to the company’s earnings. One weakness of the P/E ratio, however, is that its calculation does not take into account the future expected growth of a company. The PEG ratio represents a fuller—and hopefully—more accurate valuation measure than the standard P/E ratio.
The PEG ratio builds upon the P/E ratio by factoring growth into the equation. Factoring in future growth adds an important element to stock valuation since equity investments represent a financial interest in a company’s future earnings.
Calculating PEG Ratios
To calculate a stock’s PEG ratio you must first figure out its P/E ratio. The P/E ratio is calculated by dividing the per-share market value by its per-share earnings. From here, the formula for the PEG ratio is simple:
\begin{aligned} &\text{PEG}=\frac{\text{P/E}}{\text{EGR}}\ &\textbf{where:}\ &\text{EGR = Earnings growth rate over five years}\ \end{aligned}PEG=EGRP/E where: EGR = Earnings growth rate over five years
The PEG calculation can be done using a projected annual growth rate for a longer period of time than five years, but growth projections tend to become less accurate the further out they extend.
An Example
If you’re choosing between two stocks from companies in the same industry, then you may want to look at their PEG ratios to make your decision. For example, the stock of Company Y may trade for a price that’s 15 times its earnings, while Company Z’s stock may trade for 18 times its earnings. If you simply look at the P/E ratio, then Company Y may seem like the more appealing option.
However, Company Y has a projected five-year earnings growth rate of 12% per year while Company Z’s earnings have a projected growth rate of 19% per year for the same period. Here’s what their PEG ratio calculations would look like:
\begin{aligned} &\text{Company Y PEG = 15/12% = 1.25}\ &\text{Company Z PEG = 18/19% = 0.95}\ \end{aligned}Company Y PEG = 15/12% = 1.25Company Z PEG = 18/19% = 0.95
This shows that when we take possible growth into account, Company Z could be the better option because it’s actually trading for a discount compared to its value.
Other Factors to Consider
The PEG ratio doesn’t take into account other factors that can help determine a company’s value. For example, the PEG doesn’t look at the amount of cash a company keeps on its balance sheet, which could add value if it’s a large amount.
Other factors analysts consider when evaluating stocks include the price-to-book ratio (P/B) ratio. This can help them determine if a stock is genuinely undervalued or if the growth estimates used to calculate the PEG ratio are simply inaccurate. To calculate the P/B ratio, divide the stock’s price per share by its book value per share.
The Bottom Line
Getting an accurate PEG ratio depends highly on what factors are used in the calculations. Investors may find that PEG ratios are inaccurate if they use historical growth rates, especially if future ones may deviate from the past. In order to make sure the calculations remain distinct, the terms “forward” and “trailing” PEG are often used.