I hope you find this as interesting as I do. This Michael Oliver video is 5 months old, but it’s a good narrative on what his method is showing in various sectors, especially precious metal miners and commodities. Oliver has a unique way of evaluating markets (Momentum Structural Analysis - MSA). Superlative narrative, so listen closely. I’ve followed him for years and found him highly accurate. This is mostly an explanatory interview of what he was predicting months ago, looking forward and back, for a macro view of the market. He knows what he’s talking about. Listen to what he says about Bitcoin at about the 29 minute mark. No Charts to follow in this one.
Michael Oliver
https://www.youtube.com/watch?v=WMtQ0V4WoBg
This one is 6 months old with lots of charts visually to show his MSA methodology. Easy to follow and very convincing. Anyone can see how his analysis panned out since early July.
Michael Oliver’s URGENT Warning to Gold Buyers
https://www.youtube.com/watch?v=vH5nvNjvf1I
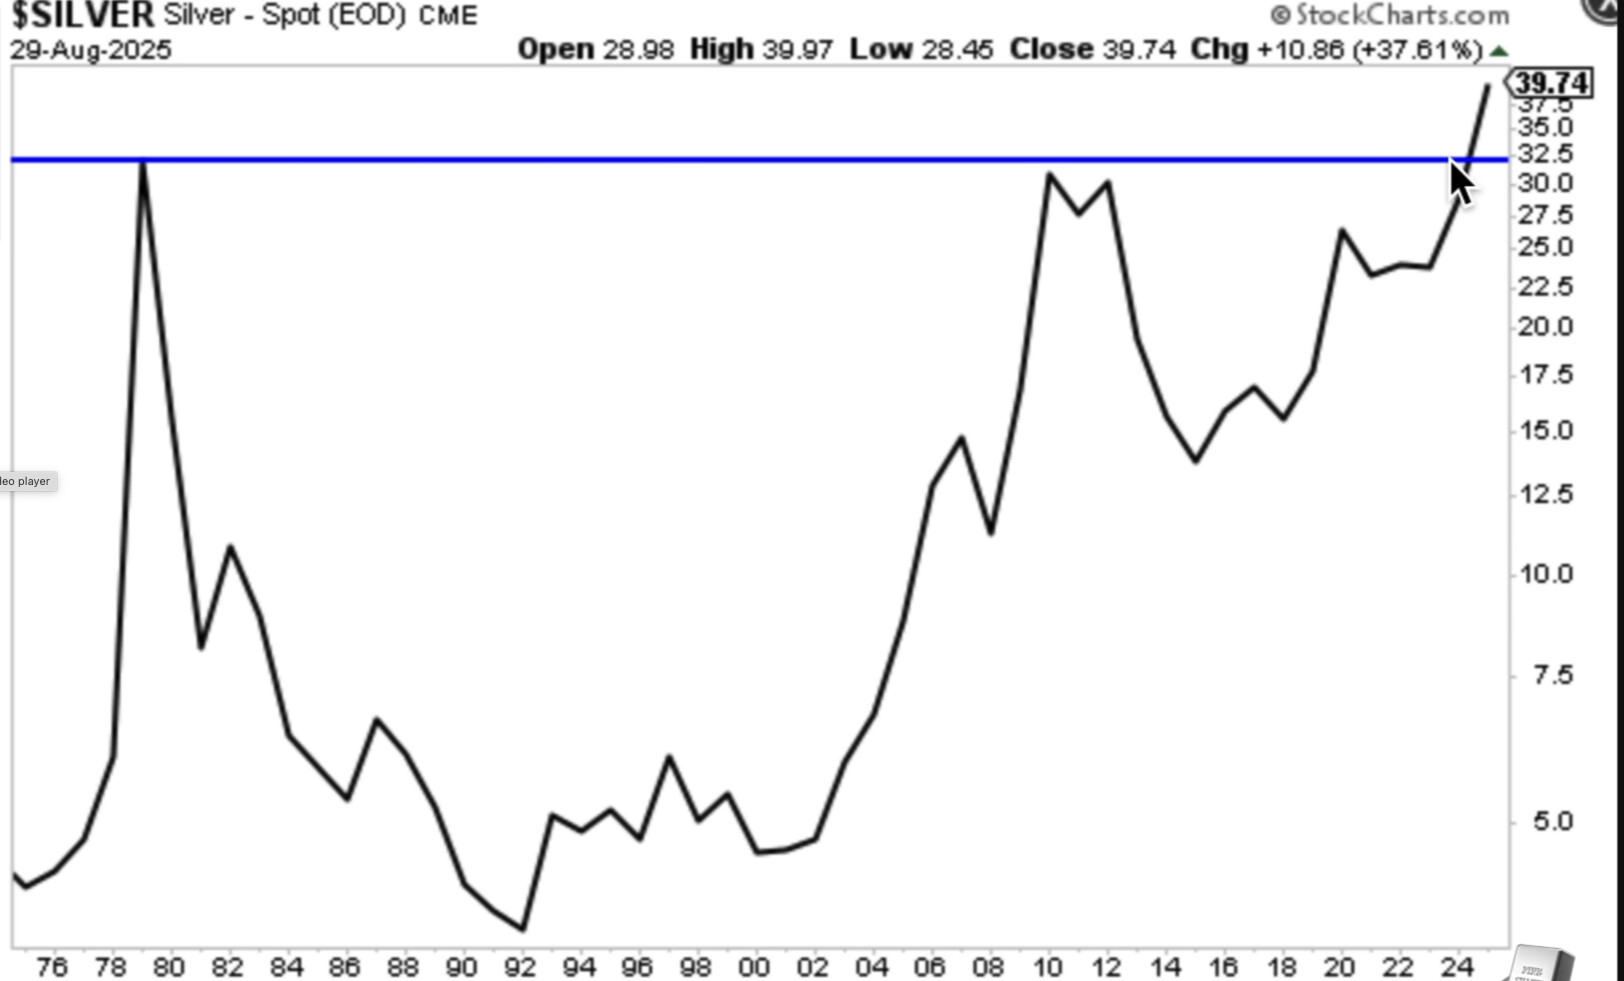
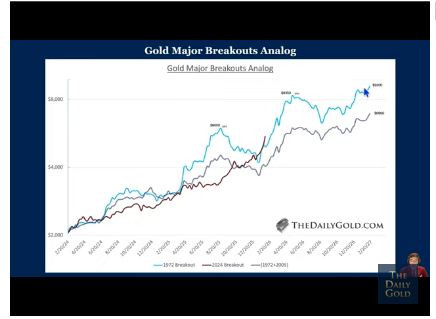
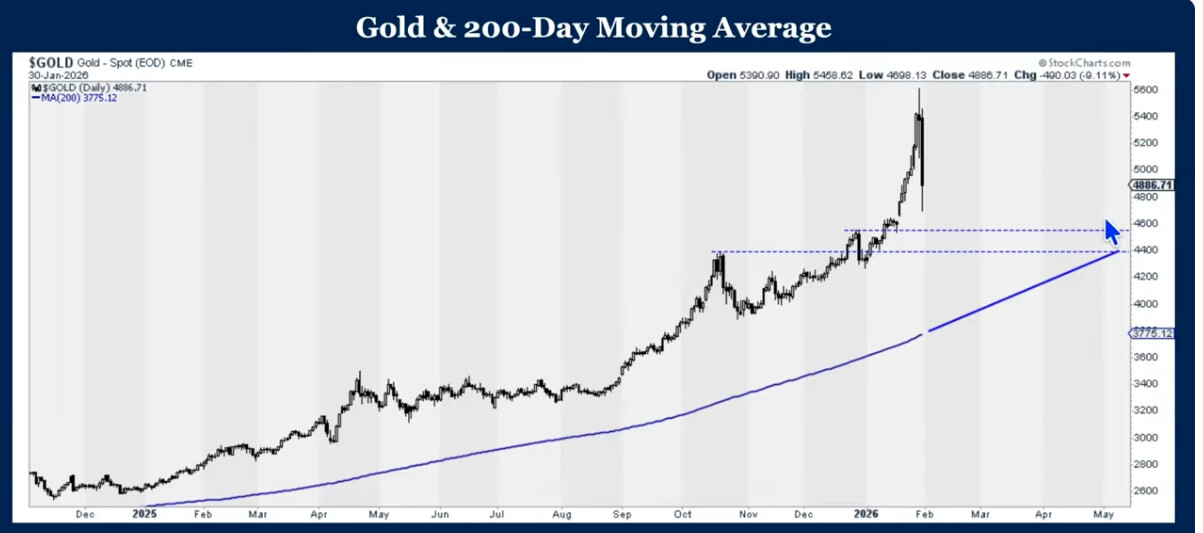
Michael presents a very important narrative above in explaining each of his charts. Important to hear all of what he has to say as he walks through each sector. In the line graph below, silver is close to closing at an annual 45 year high for 2025. (It has since closed end of year 2025 at ATH)
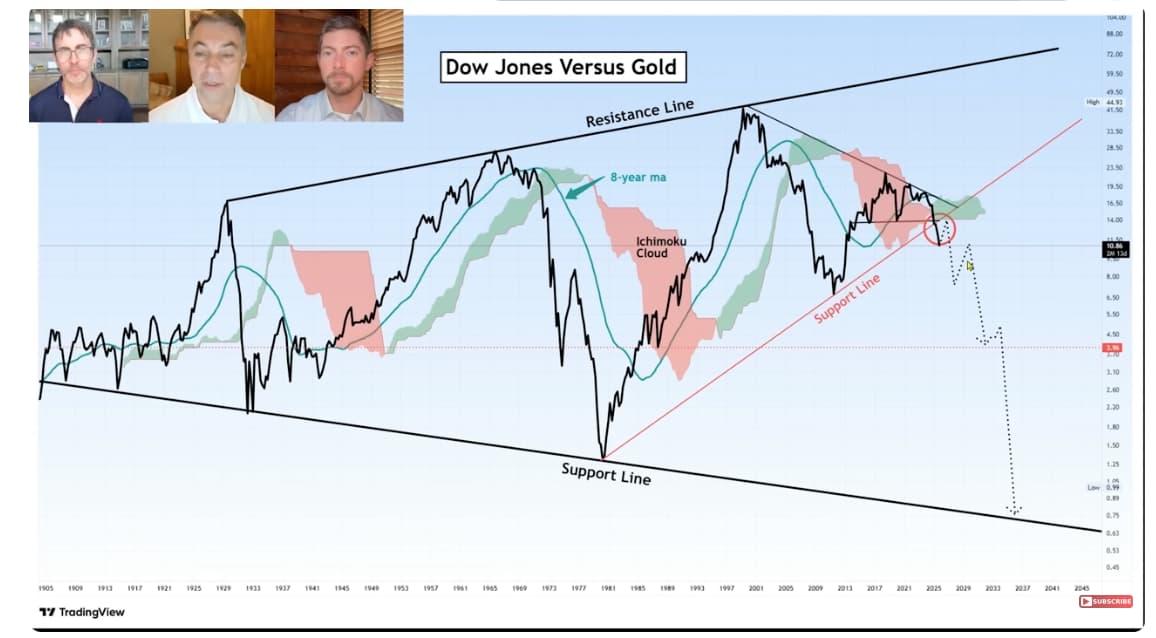
The nominal price “melt-up” in mutual funds and IRA investments over the past 15 years was driven by a combination of strong corporate performance, technological innovation, an influx of retirement capital, and most significantly, the Federal Reserve’s prolonged period of historically low interest rates and quantitative easing (QE). In response to the 2008 financial crisis and again during the COVID-19 pandemic, the Fed aggressively cut the federal funds rate to near-zero levels (0%-0.25%). With interest rates on safe investments like savings accounts, certificates of deposit (CDs), and government bonds offering very low yields, income-oriented investors were incentivized to move their money from the bond market to the equity market in search of higher returns. This influx of capital increased demand for stocks and bond funds, driving up their prices. The Fed undertook large-scale asset purchases, buying trillions of dollars worth of Treasury and mortgage-backed securities. This action injected significant liquidity into the financial system, putting downward pressure on longer-term interest rates and making other assets, like stocks, relatively more attractive. In essence, the Fed’s policies, by making borrowing cheaper and returns on fixed-income investments less attractive, channeled significant capital into the stock market, contributing substantially to the nominal price appreciation in mutual funds and IRAs during this period. But look what’s happening if the sector is priced to gold instead of the dollar. Is this just inflation of fiat currency?
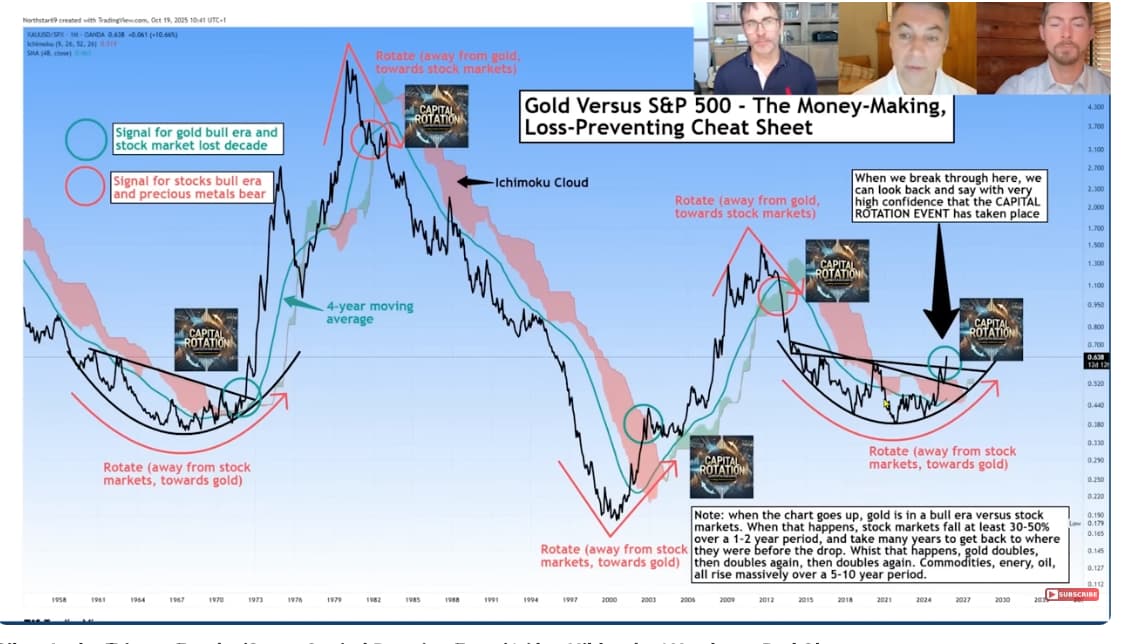
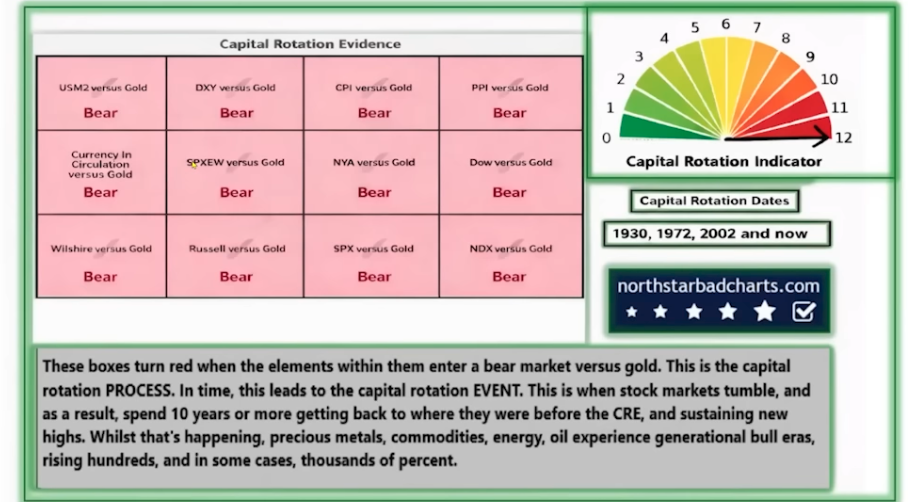
Capital Rotation Gold vs S&P 500
As those investors making phenomenal profits sell off and redeploy cash it is moved prominently into the commodity sector. This includes all commodities, but special focus is on gold, silver, and the PM miners. Some analysts suggest the current rotation could escalate into a “super capital rotation,” where a significant amount of capital shifts from stocks to hard assets like gold and silver, especially if the stock market experiences a severe bear market. Commodities, especially the precious metal miners, are ascending into a very noticeable long trend Secular Bull Market at the present point in time. Michael Oliver, The Northstar and Bad Charts guys, Kevin Wadsworth and Patrick Karim make the case:
https://youtu.be/6YA5HyPs_D8
^^^Capital Rotation Event 2026
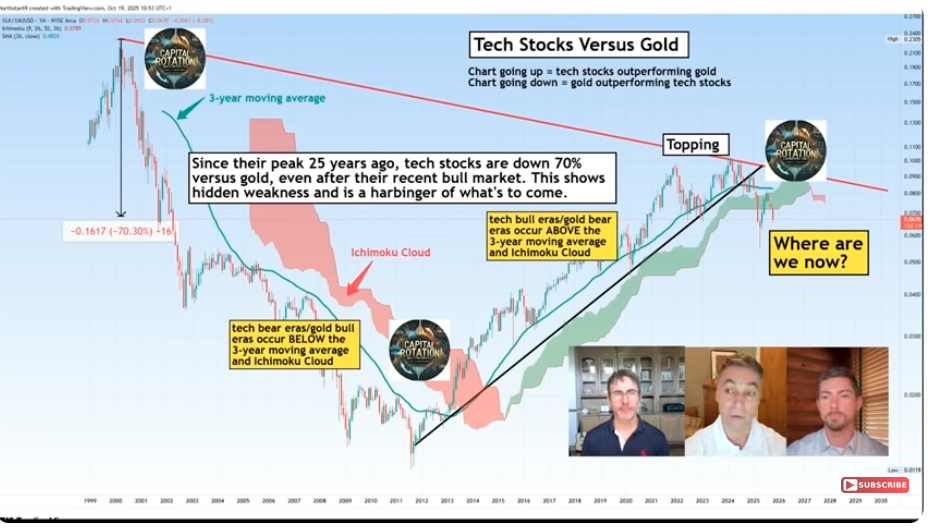
Actually, miners are a leveraged play as outsized profits result from the increased price of the underlying metal for each ounce produced; this includes uranium, platinum and base industrial metals. Eventually, oil will follow. There will be a lot of volatility along the way, but the miners will continue to make oversized new highs as a parabolic move in prices increase … starting mostly mid 2026 and become fully parabolic in 2027. You have to realize the graphs being shown are not traditional price charts, as explained throughout the earlier part of the video. Of special interest to me was the tech:gold chart at the 37 minute mark and explanation of what appears to be the start of a Bear Market as the tech sector rolls over.
In the video, charts display the ratio of a sector based on the price of gold at each point in time instead of price in dollars. (Nominal prices typical of the stock market charts most investors are all familiar with are in dollars.) The base line displayed is the 3 year average of the ratio (based to the price of gold to the total sector value in dollars). If the sector is displayed above this 3 year green average base line, the sector is in a bull market (compared to the price of gold). Compared to this baseline, all sectors (accept for tech) have started a long bear market decline as shown throughout the earlier part of the discussion. Commodities, especially the precious metal miners, are ascending into a very noticeable long trend Secular Bull Market at the present point in time. Note the accuracy of these charts as they were made some time ago. “It’s tough to make predictions, especially about the future.” Yogi Berra
Anyway, enough to get started for a few new ideas. 
EM