Other Mining Stocks

Why McEwen Mining Inc’s Shares Plunged 10% Today
Weak earnings and rising costs are hurting this gold miner today.

Travis Hoium (TMFFlushDraw) Mar 2, 2017 at 4:40PM
What happened
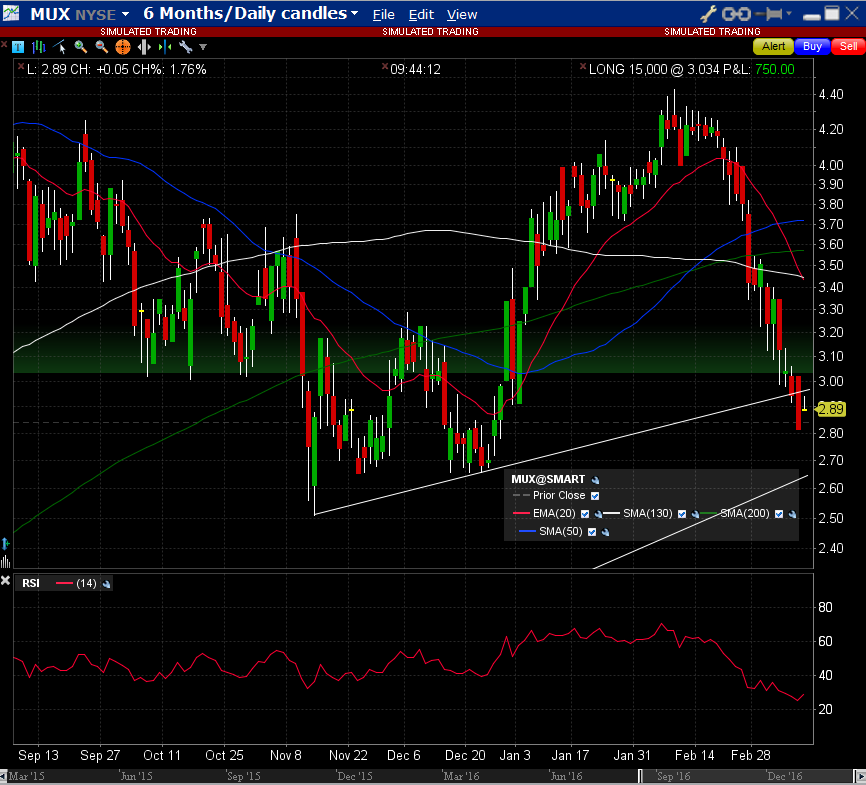
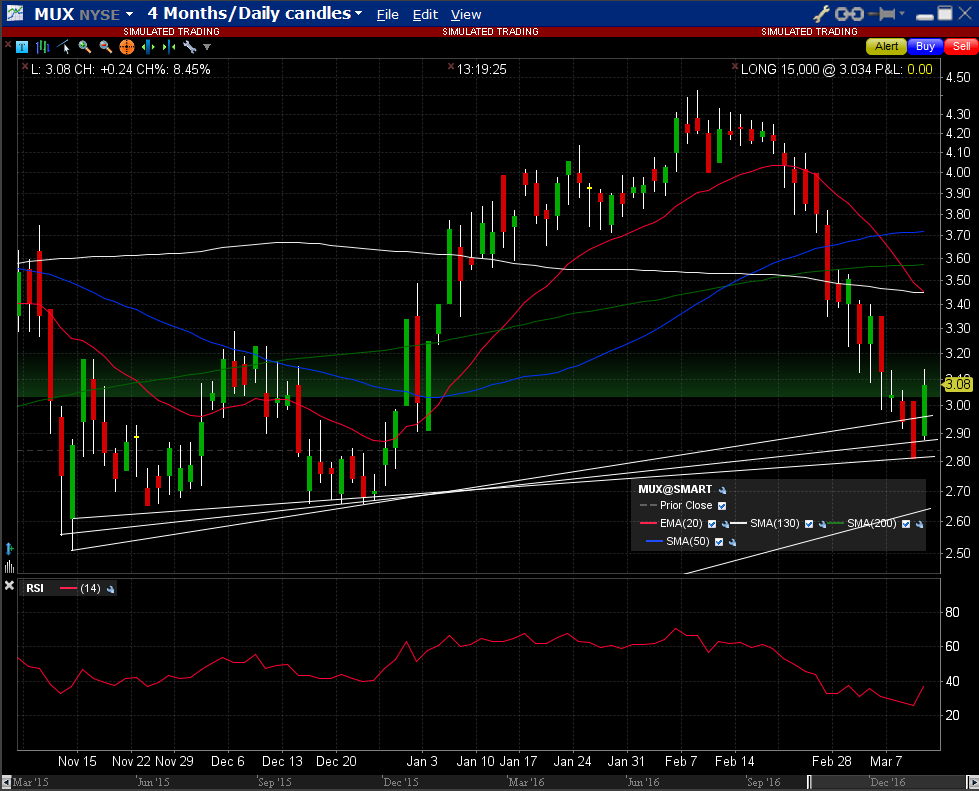
Shares of McEwen Mining Inc (NYSE:MUX) fell as much as 10.3% on Thursday after reporting fourth-quarter earnings. Shares settled down slightly, to an 8.6% gain, at 3:30 p.m. EST.

So what
Gold equivalent-ounces produced fell 18.2% in the quarter, to 31,521, and cash costs weren’t trending positively, either. El Gallo mine gold-equivalent cash costs rose 41% from a year ago, to $699, while San Jose mine costs fell 5%, to $729, although 2017 guidance is for costs to be $780 per gold ounce equivalent.

Net income for 2016 rose slightly, to $21.1 million, or $0.07 per share, but in the fourth quarter, the company lost 0.01 per share.

Now what
The cost trend is really what investors have to worry about in both the quarter and going forward. Management said that El Gallo cash costs are expected to rise from $524 per gold equivalent ounce in 2016 to $760 in 2017. And at the San Jose mine, the same cost will rise $20, to $780 per gold equivalent ounce.

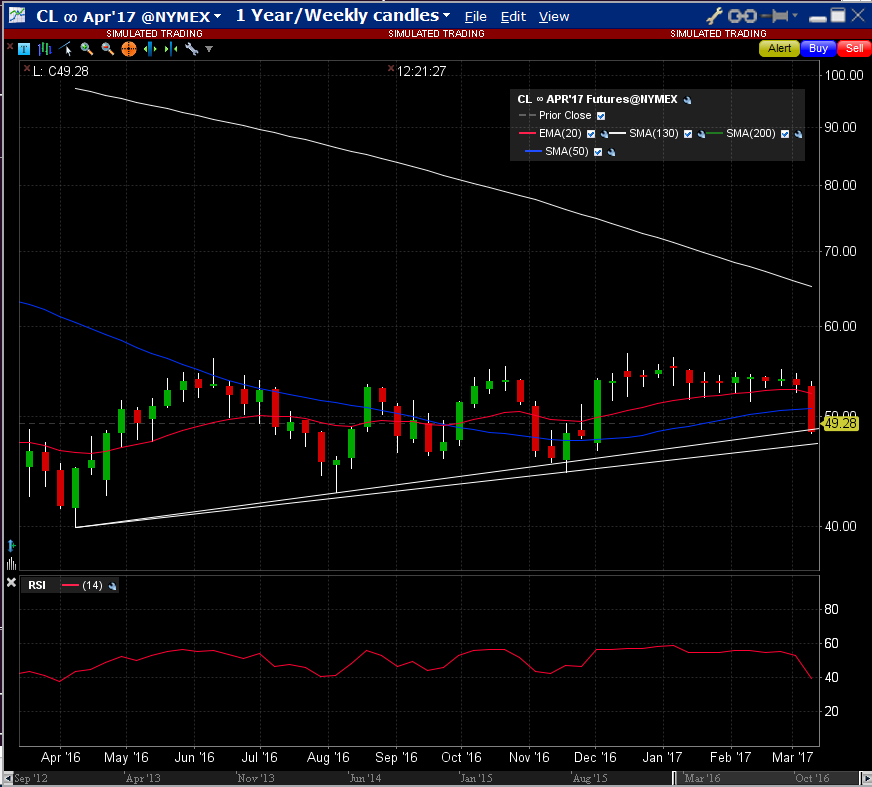
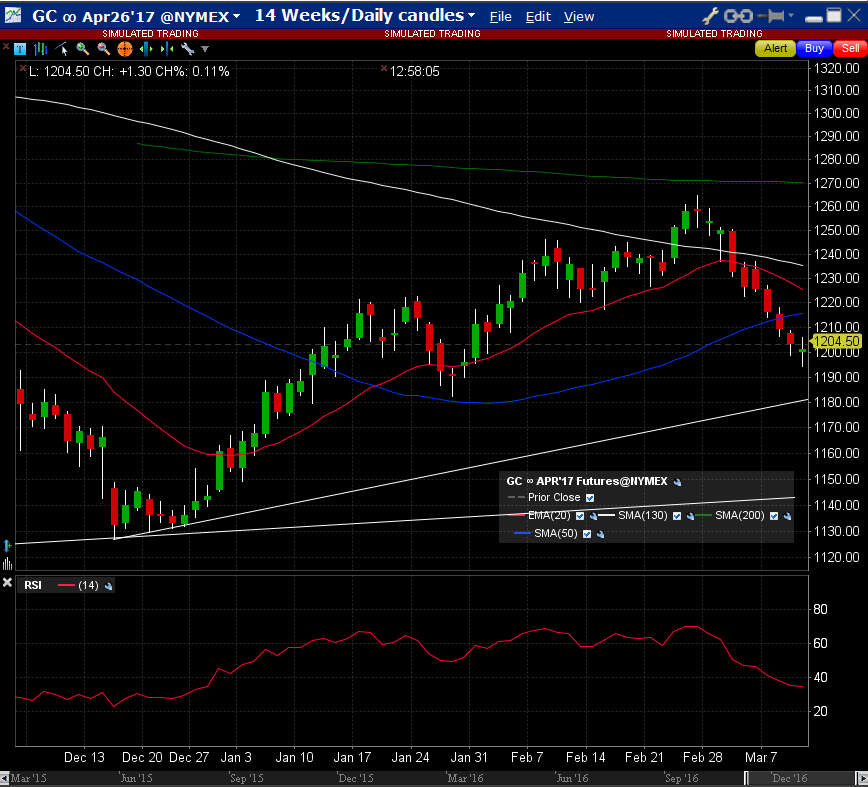
With costs rising, investors are seeing less upside from the rise in gold and silver prices in the past few months, and the company could be ready to spend even more if a new Nevada mine is approved. If you want to play gold and silver prices, then it may be better to do so directly, because rising costs for McEwen is offsetting the commodity leverage in the business, making it a stock I would stay away from today.

Actually their income for 2016 was not that great.

3 Likes

Thanks for sharing Hulkster

Yes, very true and what I tried to point out when I posted “see pg 39 10K:
Selected Consolidated Financial and Operating Results” in my previous post. Generally, PM miners were hit hard today.
There were some positives that came out for MUX today, however FWIW (10 pg. transcript):

McEwen Mining’s (MUX) CEO Rob McEwen on Q4 2016 Results - Earnings Call Transcript

Mar. 2, 2017 5:40 PM ET
FY: 03-01-17 Earnings Summary
Before I asked them to present, I’d like to make several comments. I was very pleased with our performance in 2016 for McEwen Mining’s (MUX) CEO
Rob McEwen on Q4 2016 Results - Earnings Call Transcript

First, we significantly improved our financial strength. Our treasury doubled in size, and now stands at $55 million. I want to emphasize that this growth in the treasury was achieved from operations. It was not the result of a debt or equity financing or a sale of metal streams or royalties.

Second, the change in government in Argentina who are pro-business pro-form investment administration, coupled with improved gold silver and copper prices has definitely increased the value and contribution of these assets in our portfolio. Third, we added significant depth to our senior management in areas of project management, construction, and underground and open pit operations.

These additions were done in preparation for our next phase of growth, which we are now entering. This phase of growth includes new production coming on stream in Nevada, and a change in the ore type in Mexico, and the belief that the exploration potential there is greater than originally envisioned.
McEwen Mining's (MUX) CEO Rob McEwen on Q4 2016 Results - Earnings Call Transcript | Seeking Alpha

1 Like

This is a non-chart update…

Gold futures are now testing the 20 weekly EMA. If you care to scroll up to the last weekly interval chart I posted it is the red moving average on that chart. The white 130 weekly MA on the same chart is at about 1218. The 50 daily moving average for gold is sitting at right about 1210, so keep an eye on those areas if gold should fall lower.

Silver futures are moving toward testing the weekly 20 ema right around 17.50. The 130 weekly MA is currently at 16.78. The daily interval chart for silver is showing price having dropped below the 130 MA at 17.72 so far. Watch for a close above that as a potential sign of strength, though I wouldn’t buy it until seeing what Monday brings. The 50 daily MA for silver sits at right around 17.33.

I’ll update the charts either over the weekend or when something substantial happens on the charts that inspires me.

Gold and silver both bounced today after hitting the 130 MA’s on the 8 hour interval charts. The MA is the white line on each of the charts below, (gold first and then silver). Yes, the price did dip below the 130 for each metal, but charting is an art and not an exact science. We now have immediate short-term support and resistance levels to keep an eye on next week on top of those I’ve discussed on the larger time frames.

FYI, gold retraced 50% of the range covered between yesterday’s high and this morning’s low, whereas silver retraced about 40% of the same range.

Enjoy the weekend.

PDAC underway, FWIW.

The convention gets into full swing on Monday, March 6 with seminars on various aspects of Canadian, American, Latin American, African, Australian, European and Asian mining.
PDAC 2017 kicks off with mining investment seminars - Timmins News

Wonder what private placements Rick Rule is making as intimated from his audio interview 3/5/17?

For anyone interested in crude oil, here’s a weekly interval chart. So far the trend line has held.

Here’s the daily interval chart for gold. It has fallen below all the major moving average support, so now I’m watching the uptrend line which is currently sitting at about 1176.

1 Like

Here’s the daily interval chart for silver. Like gold, it has lost all major moving average support, so now we watch for uptrend line support. The first is at 16.76 today. Bear in mind that each day the support price increases a bit due to the upward slope of the line.

I’ll update these charts once those lines are hit, or when some other form of support appears to be in play.

1 Like

Here are updates for the previous three charts I posted yesterday…

Oil is still holding the trend line on the weekly interval chart…

Gold has bounced a little after hitting an overnight low of 1194.50. Has yet to test the uptrend line…

Silver is moving with gold but has tested the first uptrend line. Now we watch for a reversal pattern or a loss of that trend line support. The second uptrend line on the chart might be hit around the same time gold hits its uptrend line. Time will tell. Nothing to do but watch for now.

1 Like

MUX lost support at one trend line, now it’s looking to test a longer one at around 2.65.

2 Likes

Here’s an update on the weekly interval chart for oil. The candle for the week is very bearish and would on its own lead one to strongly believe that lower prices are likely for next week. The closing price was a tad below the first uptrend line, but close enough that an open above or on said trend line is not unreasonable next week. If not, there’s a lower trend line to keep an eye on and a couple of horizontal areas of support that I’ll post when/if necessary.

2 Likes

Here’s an updated daily interval silver chart. The first uptrend line was penetrated but held support thus far. Next week should be telling as to whether we find some support or if more downside is coming. I’d expect lower prices eventually. I’m not going to post the gold chart because it’s not much different than the last one I posted. Gold has a ways to go yet to hit its first uptrend line and I expect that silver will continue to move with gold. We’ll see what next week brings. (I’m going to have company from Monday - Thursday so not sure if or when I’ll have time to post yet).

1 Like

MUX Daily interval chart…

If you look at the last chart I posted for MUX, you’ll see that I had only one trend line drawn. This one has three. As I always say, charting is an art and a science. You can’t be too rigid in how you go about doing things because you never know what will help. If you follow each trend line from its start to where it ends you can see how they all were helpful and useful. If you’re not a chartist then you probably won’t understand how I came about drawing each trend line, but anyone who is or has studied charting to much of an extent will likely see and understand the reasoning behind how and why each line was drawn. Each way has merit and each way has proven useful, so I choose to be flexible and use them all. I’ll keep them up and see if they prove further usefulness in the near future.

Anywho, MUX had a nice little retracement yesterday which came late in the day. Likely some short covering for the weekend. They made some good money on the move. Now next week we watch to see if MUX gets some support or if this was a relief bounce prior to another leg lower.

3 Likes

Gold will probably have a nice rally next week.

Hey TR… thank you for posting your charts. It is great to see your different ideas. Cheers! John

I’m happy to do it John, and thank you. I’m finding it harder to let go of the charting aspect of trading than I thought I would. I always enjoyed the charting aspect of the markets. A friend recently suggested that I start a service where subscribers send me their investment symbols and I analyze their charts for them. I’m entertaining the idea but not sure yet if I’ll do it.

3 Likes

WOW!


Real deal, or Head Fake … ?

It topped out just above the 130 MA thus far. I’ll update gold & silver soon.

Real deal I hope.