I just posted that one first because I promised a chart for it on the CEO.CA forum yesterday. I’ll post some more here this weekend.
1 Like
I found the attached article by Greg Schnell an interesting read with some comments on charts and current trading patterns. He was using charts of FCX as an example. The lead on the story explains, “Copper continues to be frustrating. While copper is in high demand, China is a big consumer of raw copper. It’s a bit like viewing a mine site from a railway track. Can’t see much, so is all we have is the price charts of the stocks to go on.” Unfortunately the pdf was too large to post (charts and photographs take up a lot of memory, apparently). If you’re trading copper stocks you may find Gregg’s comments of interest.
So one thing that may be of interest is this comment:
What makes this trade more compelling than ever is the closing down of nuclear plants in California and other places around the world. Many are of the belief that solar and wind can make that power up. Recently, an article I read suggested France had battery backup for less than 2 minutes of consumption at a grid level. So the majority of the entire grid infrastructure from production to storage will need to be completely upgraded.
All of this keeps building into part of the world’s looming energy crisis. There is positive news, but the projects need to be vast in size and scale. On my travels today, I found two new grid level power installations of massive scale that were not there two years ago.
The new solar installation near the Hoover Dam in Nevada was vast. It covered massive acreage. The installation continued on both sides of the highway. The power line infrastructure above the solar array was part of the Hoover Dam power generation, so not all these towers were from the solar addition. I will comment on a scale of 1000 acres that have plants removed and call it green energy. Large scale sterilization of the soil or continuous elimination of the plant species? Either way, let’s not pretend this is all eco-good.
The point to make from these photos was the size and scale of the power generation and all of this requires massive land as well as large amounts of copper, steel and aluminum elements. This site also had a large battery storage facility on the east end of the property.After crossing to the east side of the Hoover dam, I found a completely new wind farm that was not there two years ago. The picture doesn’t do it justice. I took a picture of 75% of the windmills as it stretched farther left and right. All of this requires copper, aluminum, steel and concrete. This is also spread over multiple sections of land. Infrastructure roads are built into all these sites and power lines are constructed to tie into the existing grid. Once again, this one was close to the Hoover Dam, so I am guessing that it ties into the main transmission line network near there.
Since the PDF file was too large to post in the previous post, here is an earlier blog of the kind of copper chart analysis Gregg has presented recently. Also a second end of the year blog article from Dec 30, 2021 titled “The Greatest Stock Rally Ever?” He presents charts on the SPY, Nasdaq 100 (QQQ), $XVG and quite a few more including $GOLD.
https://www.gregschnell.com/copper-the-2021-pumpkin-of-october/
The Greatest Stock Rally Ever?
GREG SCHNELL
December 30, 2021In one of the greatest stock rallies ever, 2021 will go up in history as an easy market to make money. The chart opened on the lows, closed on the highs and never had a 10% pullback. What could be easier?
For all charts below, the scale on the left is in percent gain, and the scale on the right is the actual price currently.
(https://www.gregschnell.com/category/articles/)
Hoping this enlightens a few to the utility of employing charts in their future investments. Let’s all make and take some profits in 2022!
The link doesn’t go to an article. It’s a profile page of the people involved in “Chartwatchers” on Stockcharts.com.
Thanks TR for the clarification on the article that was published this morning in “Chartwatchers”. I figured that out, so I posted a couple other examples of Gregg Schnell’s chart analysis. Apologies, I was hoping it would bring up the article, but I can’t always see what a link shows when posted due to different permissions needed for general web access. I just removed it as an embedded link.
Rich,
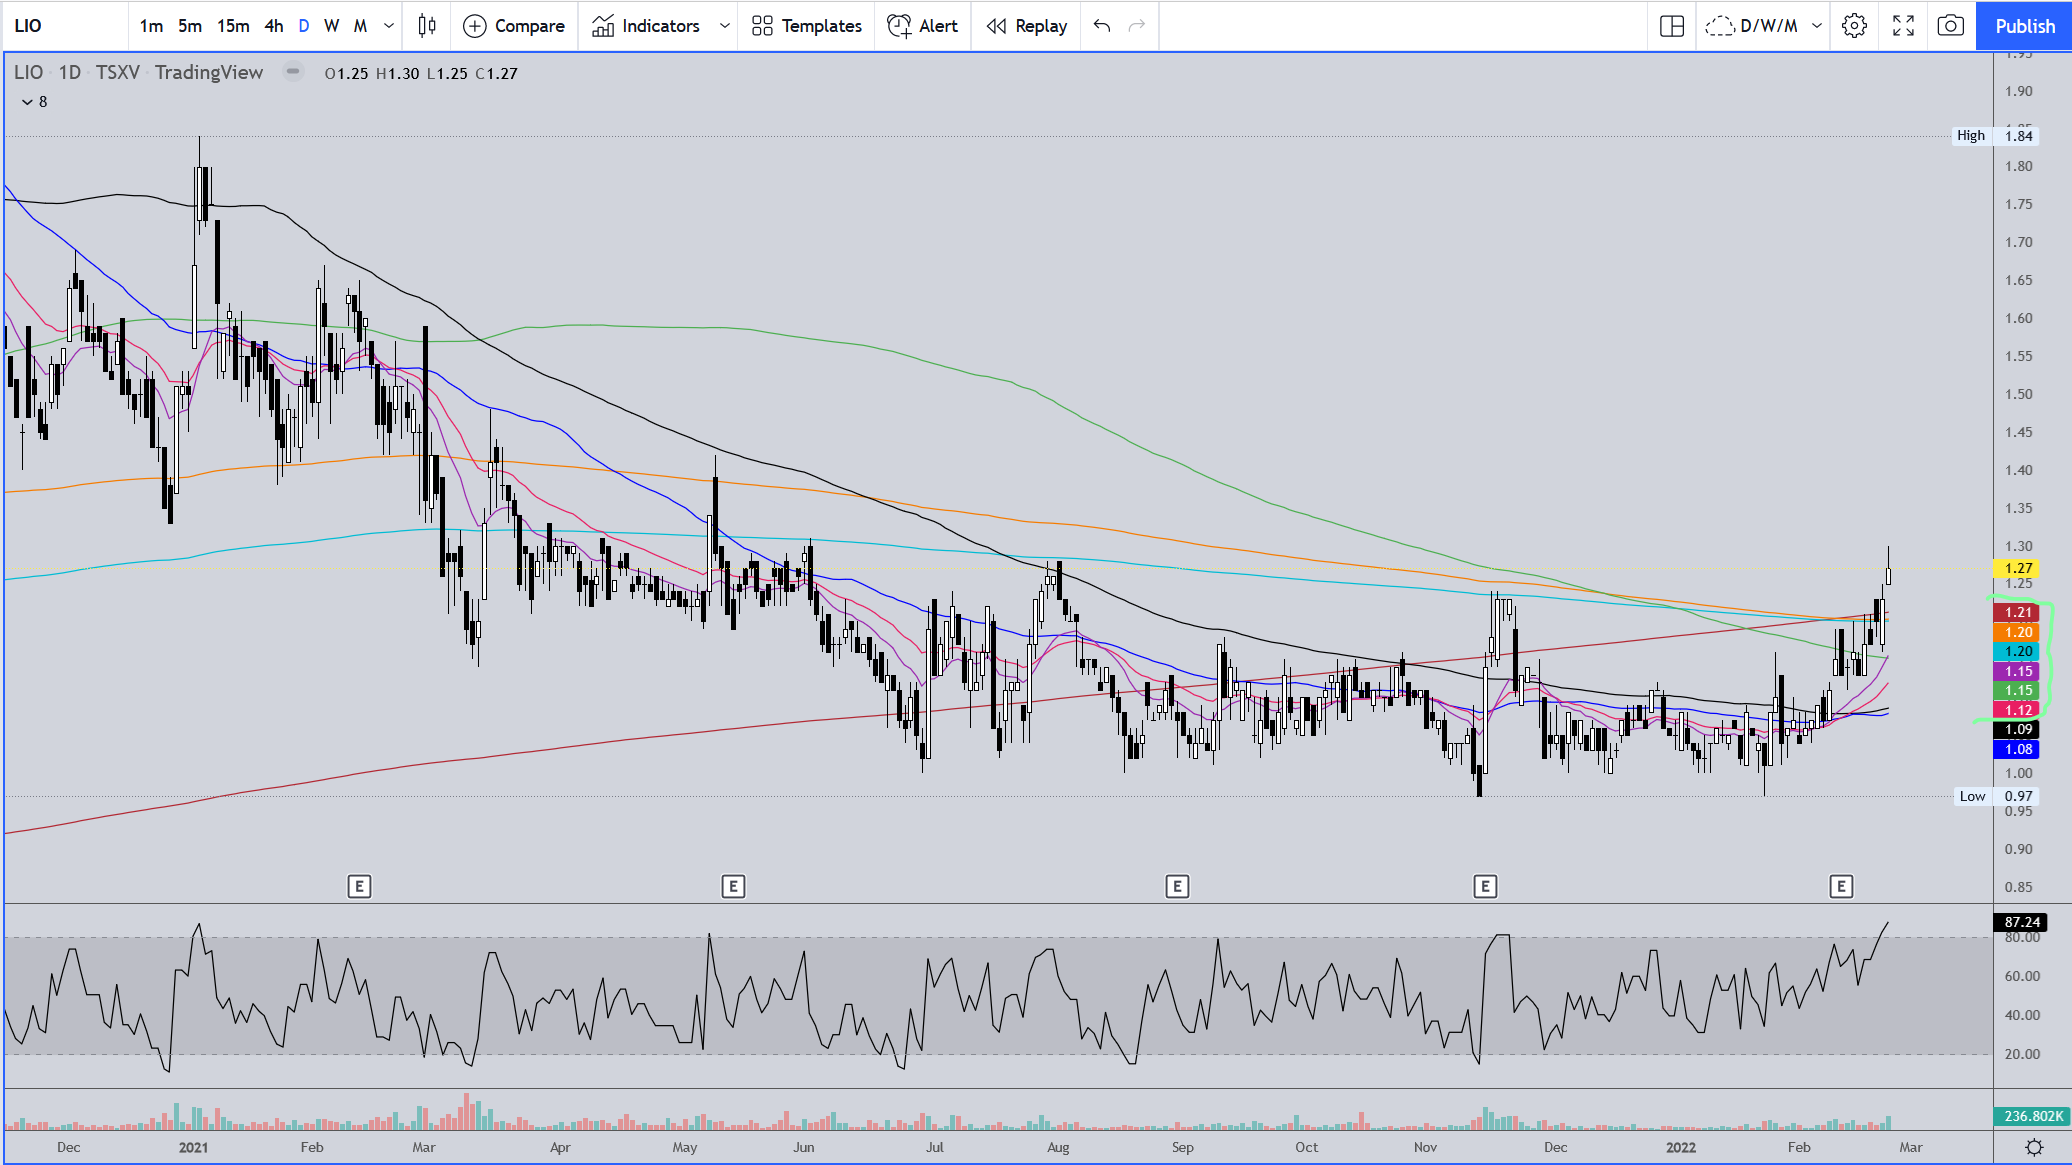
If you find time could you post a chart on LOMLF? It had some nice drill results in a PR a couple days ago. They are way down, like many other PM miners.
(https://liononemetals.com/2022/01/additional-high-grade-infill-drill-results-including-359-8-g-t-au-over-1-8m-including1616-g-t-au-over-0-4m/)
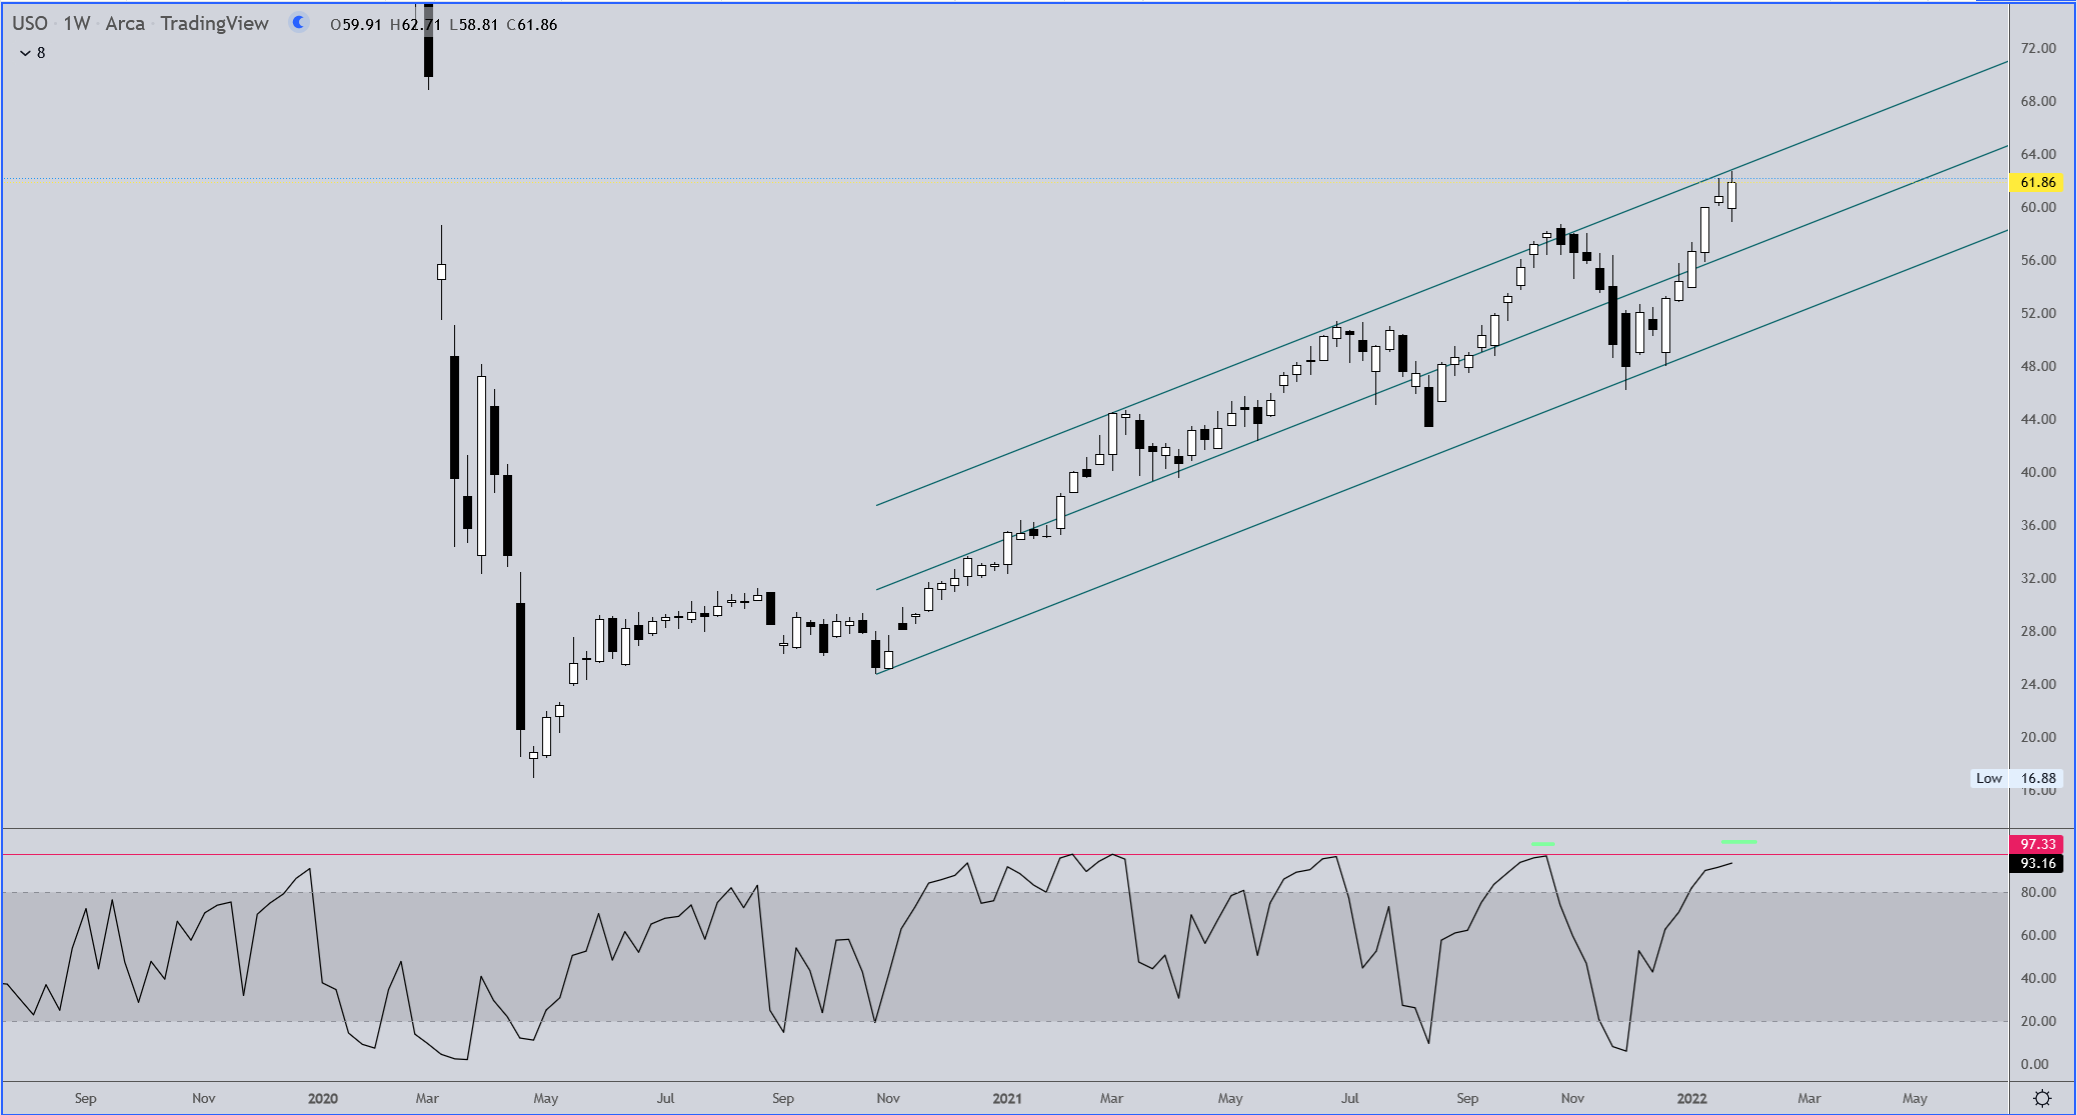
USO
The first chart is a weekly showing the stock bumping into the top of a rising channel the past two weeks. Price has hit a higher high, but RSI has not, showing negative divergence. Probably time to take profits for traders and watch the center line for support if it should pull back that far.
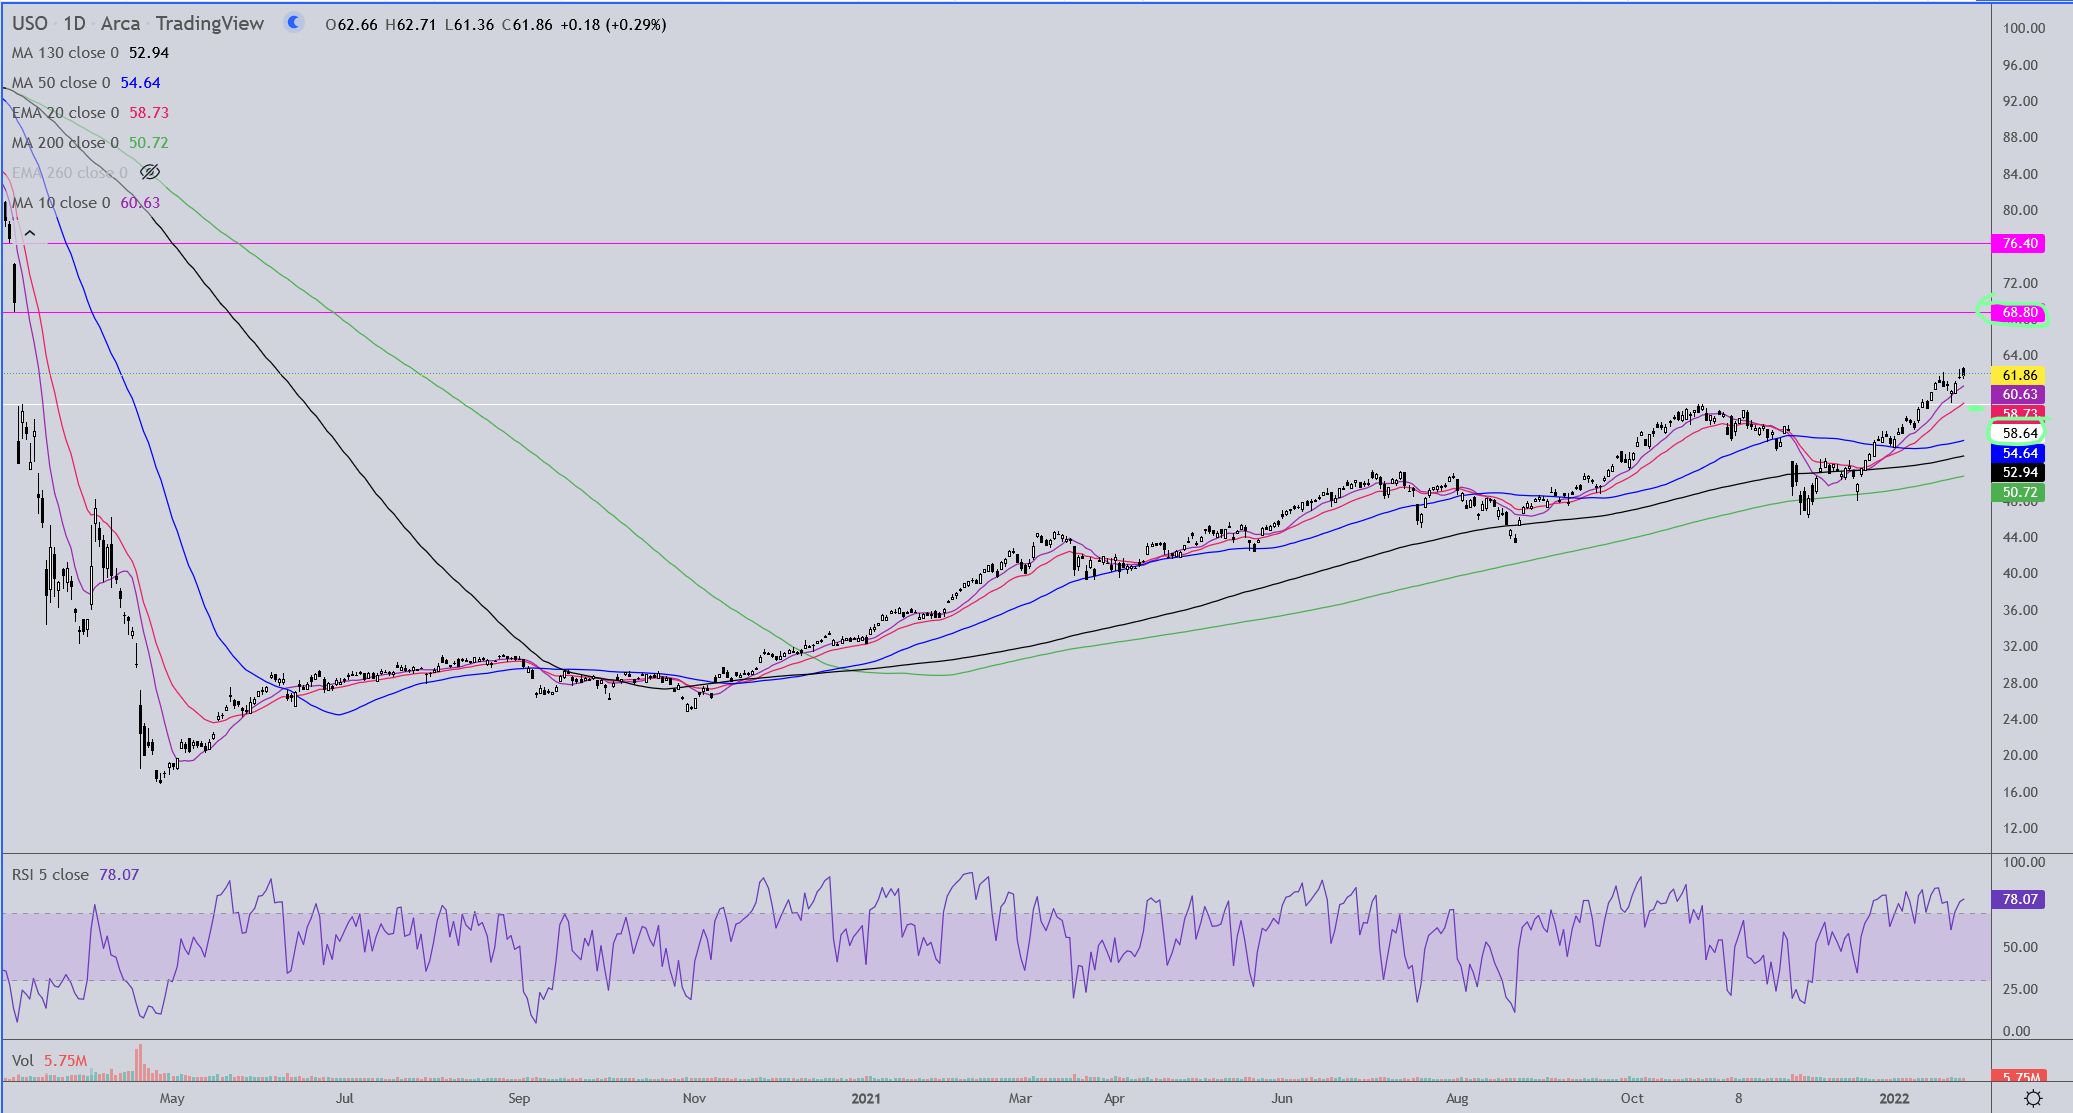
This next chart is just to show where gap support & resistance lies. Gap support is at the white line at 58.64. There are two gap resistance levels higher at 68.80 and 76.40.
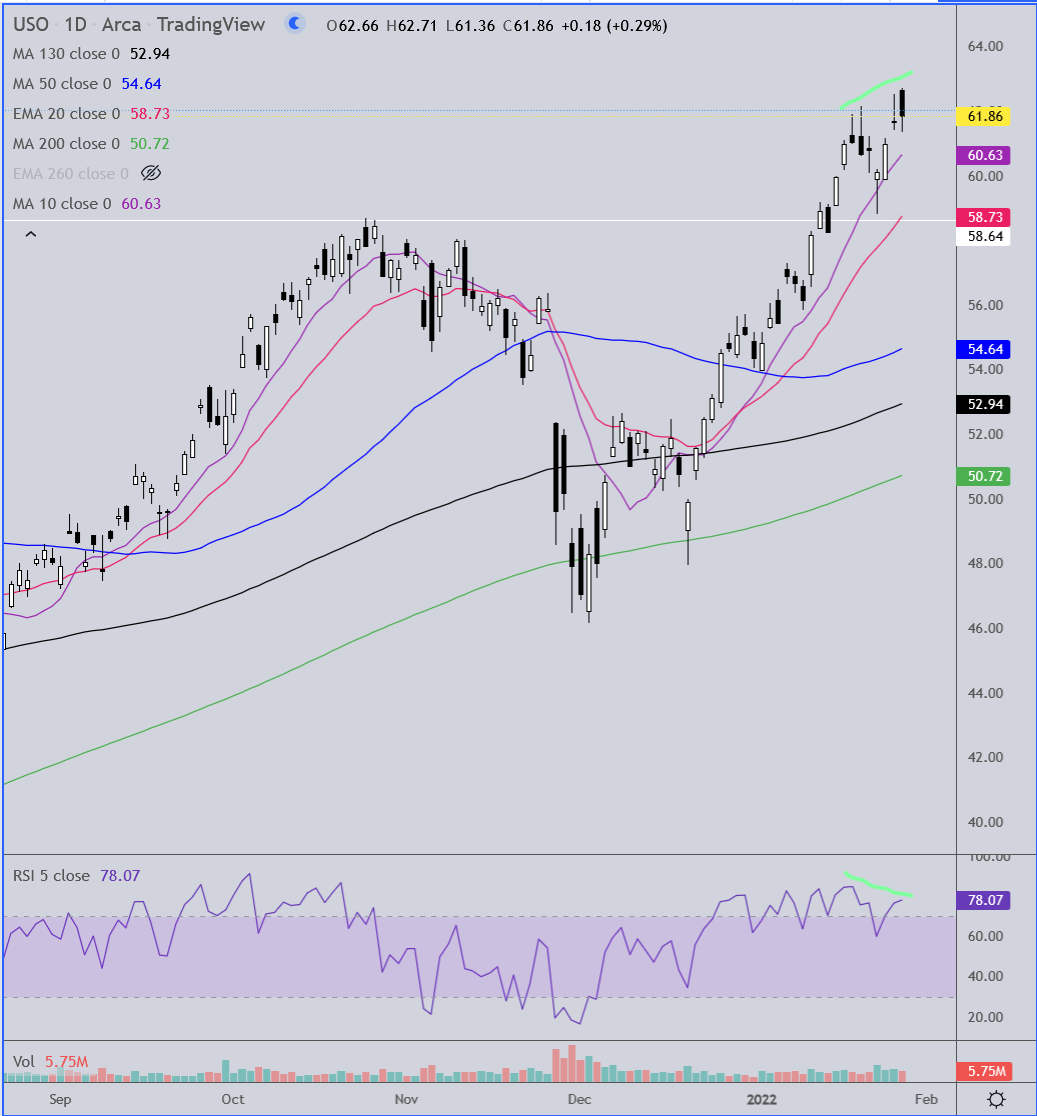
Now is a closer view of the daily chart. Although I didn’t outline it, there is a rising flag or what might be called a small rising wedge that is forming which is a sign the stock is probably getting ready for a pullback. The two most recent candles are reflecting selling pressure at current prices. Next you can see that the stock pulled back last week from new highs then moved to higher highs the past two days, but again the RSI is not hitting new highs, so it is likely the stock will pull back barring any news events that might change that. The pullback has the potential to be shallow so I would first watch the red MA and the white gap support line. If it dips lower there is a support level around 56.25.
1 Like
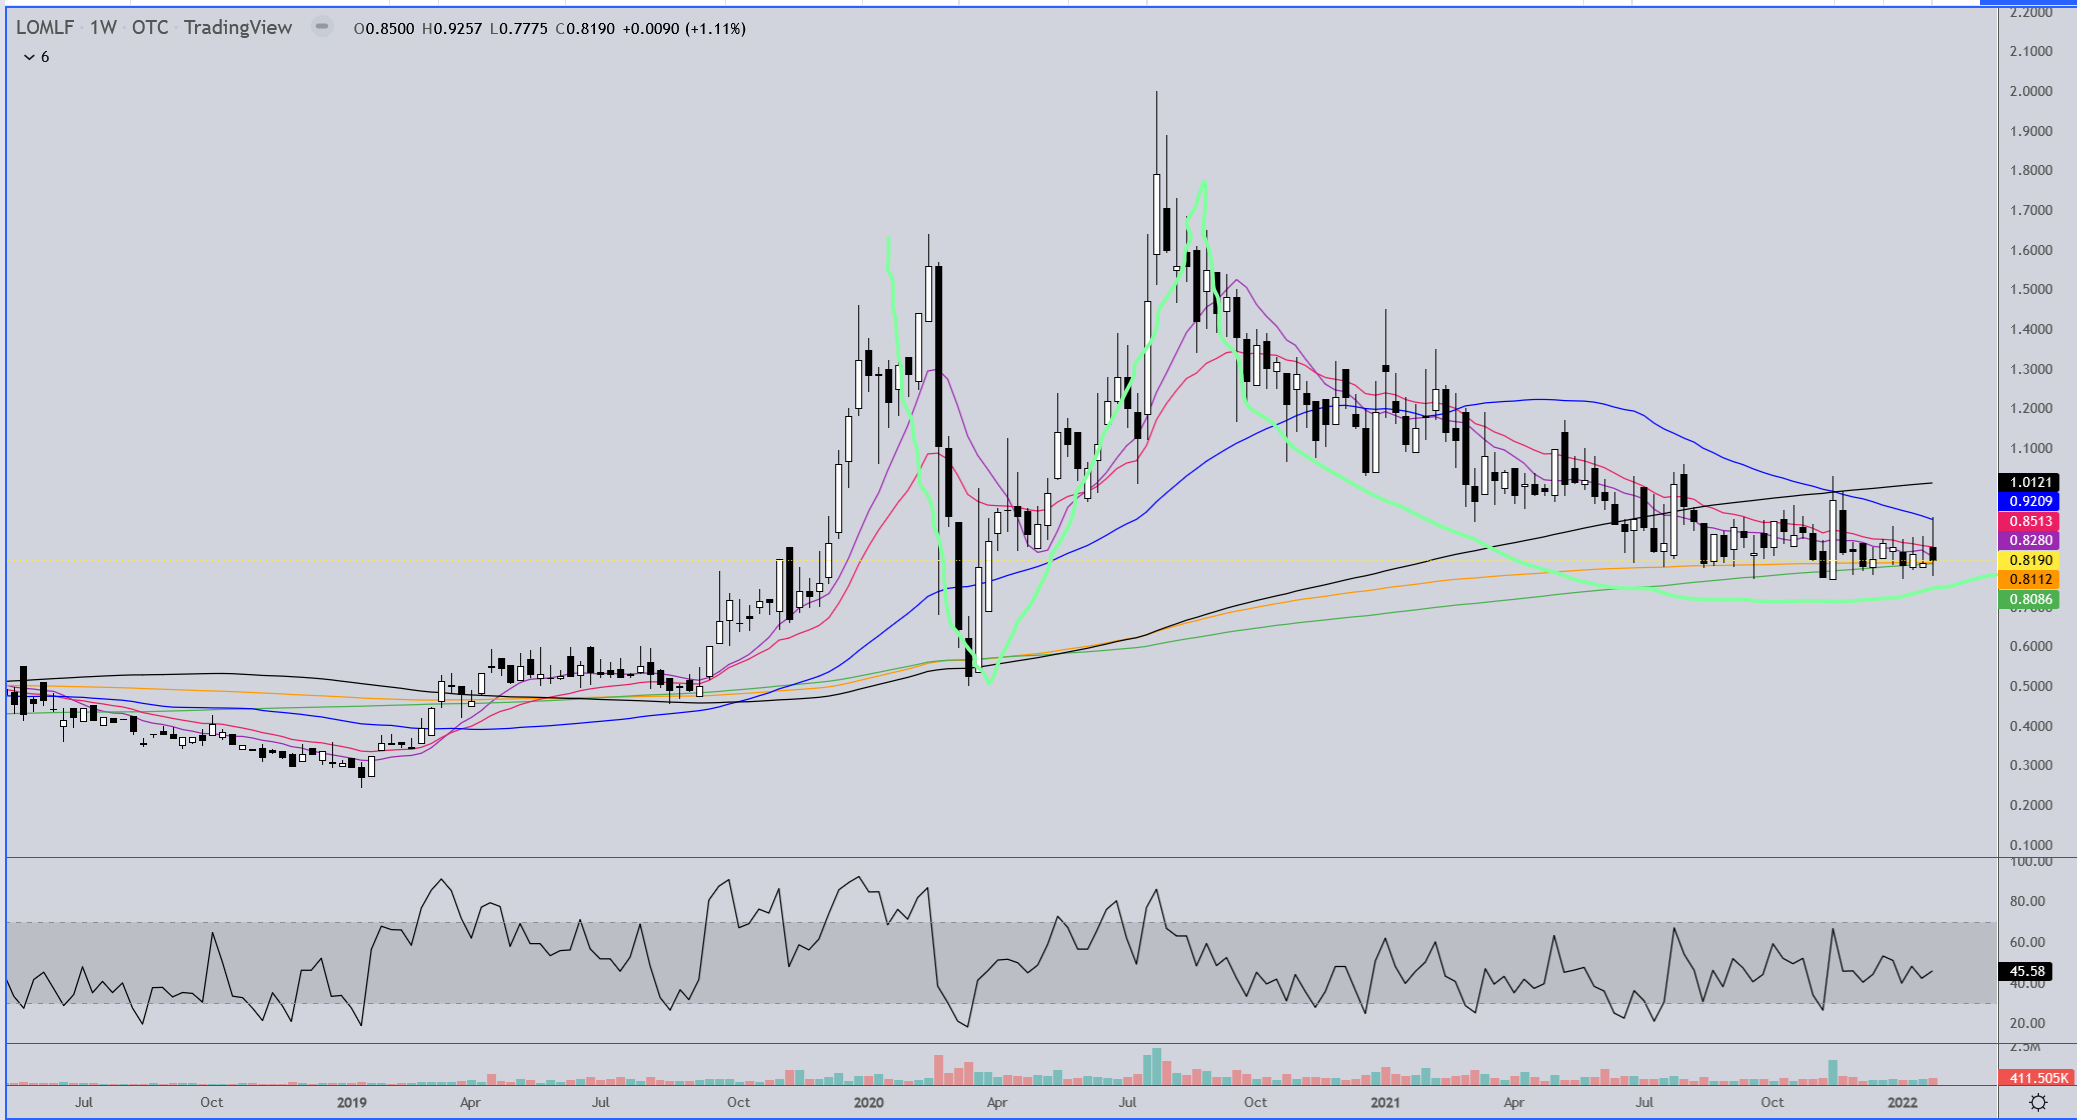
LOMLF
The weekly chart is really the only one worth looking at. It seems to be making a giant adam & eve bottom with the 200ma as loose support. On the monthly chart the 50ma is worth keeping an eye on if the 200ma doesn’t hold on the weekly chart. I don’t pay a lot of attention to gold and silver as they are some of the most highly manipulated markets, maybe just a little less or as much as the currency markets, but the couple of people I pay attention regarding the movements of gold and silver are thinking there is more downside coming here, so it may be wise to be patient and pick your spots carefully when adding to miners.
2 Likes
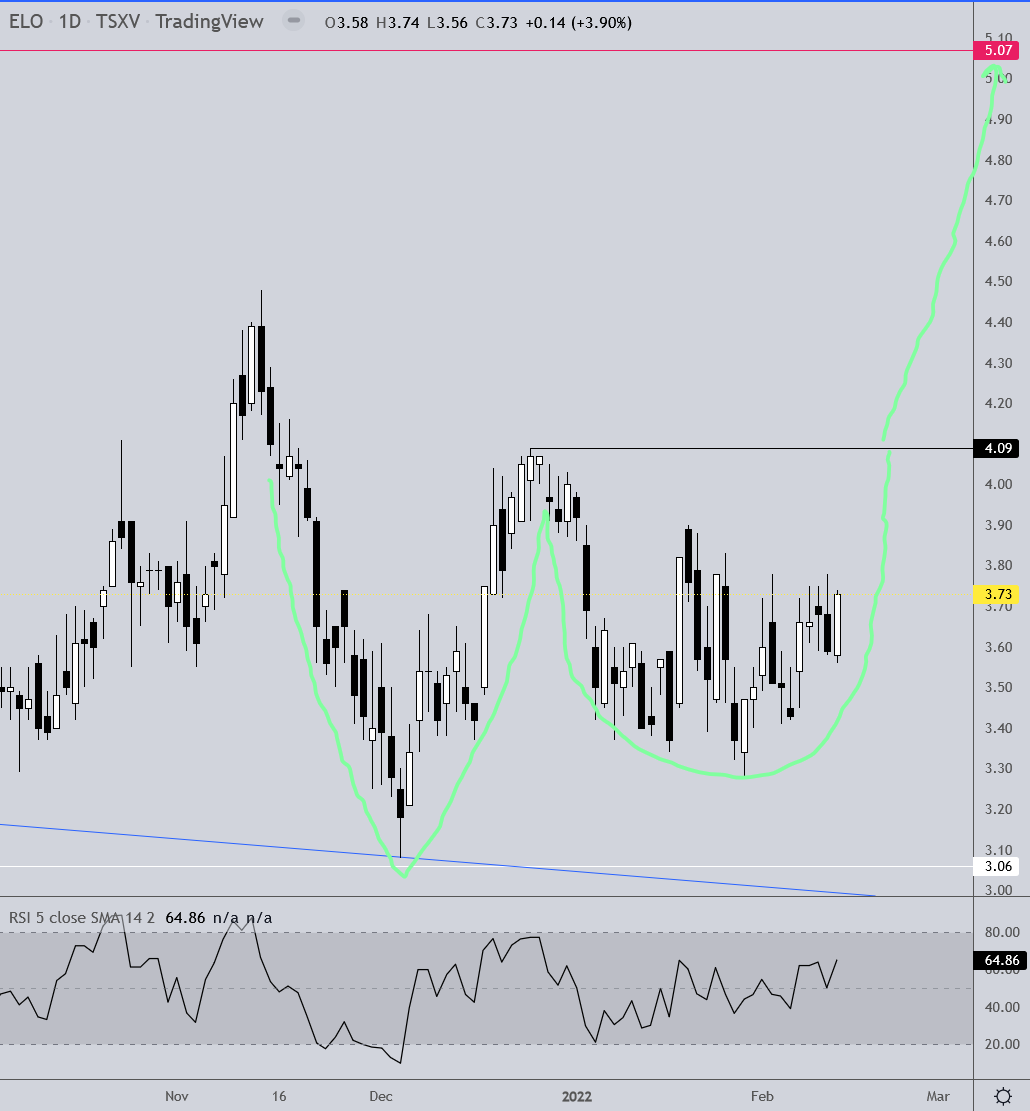
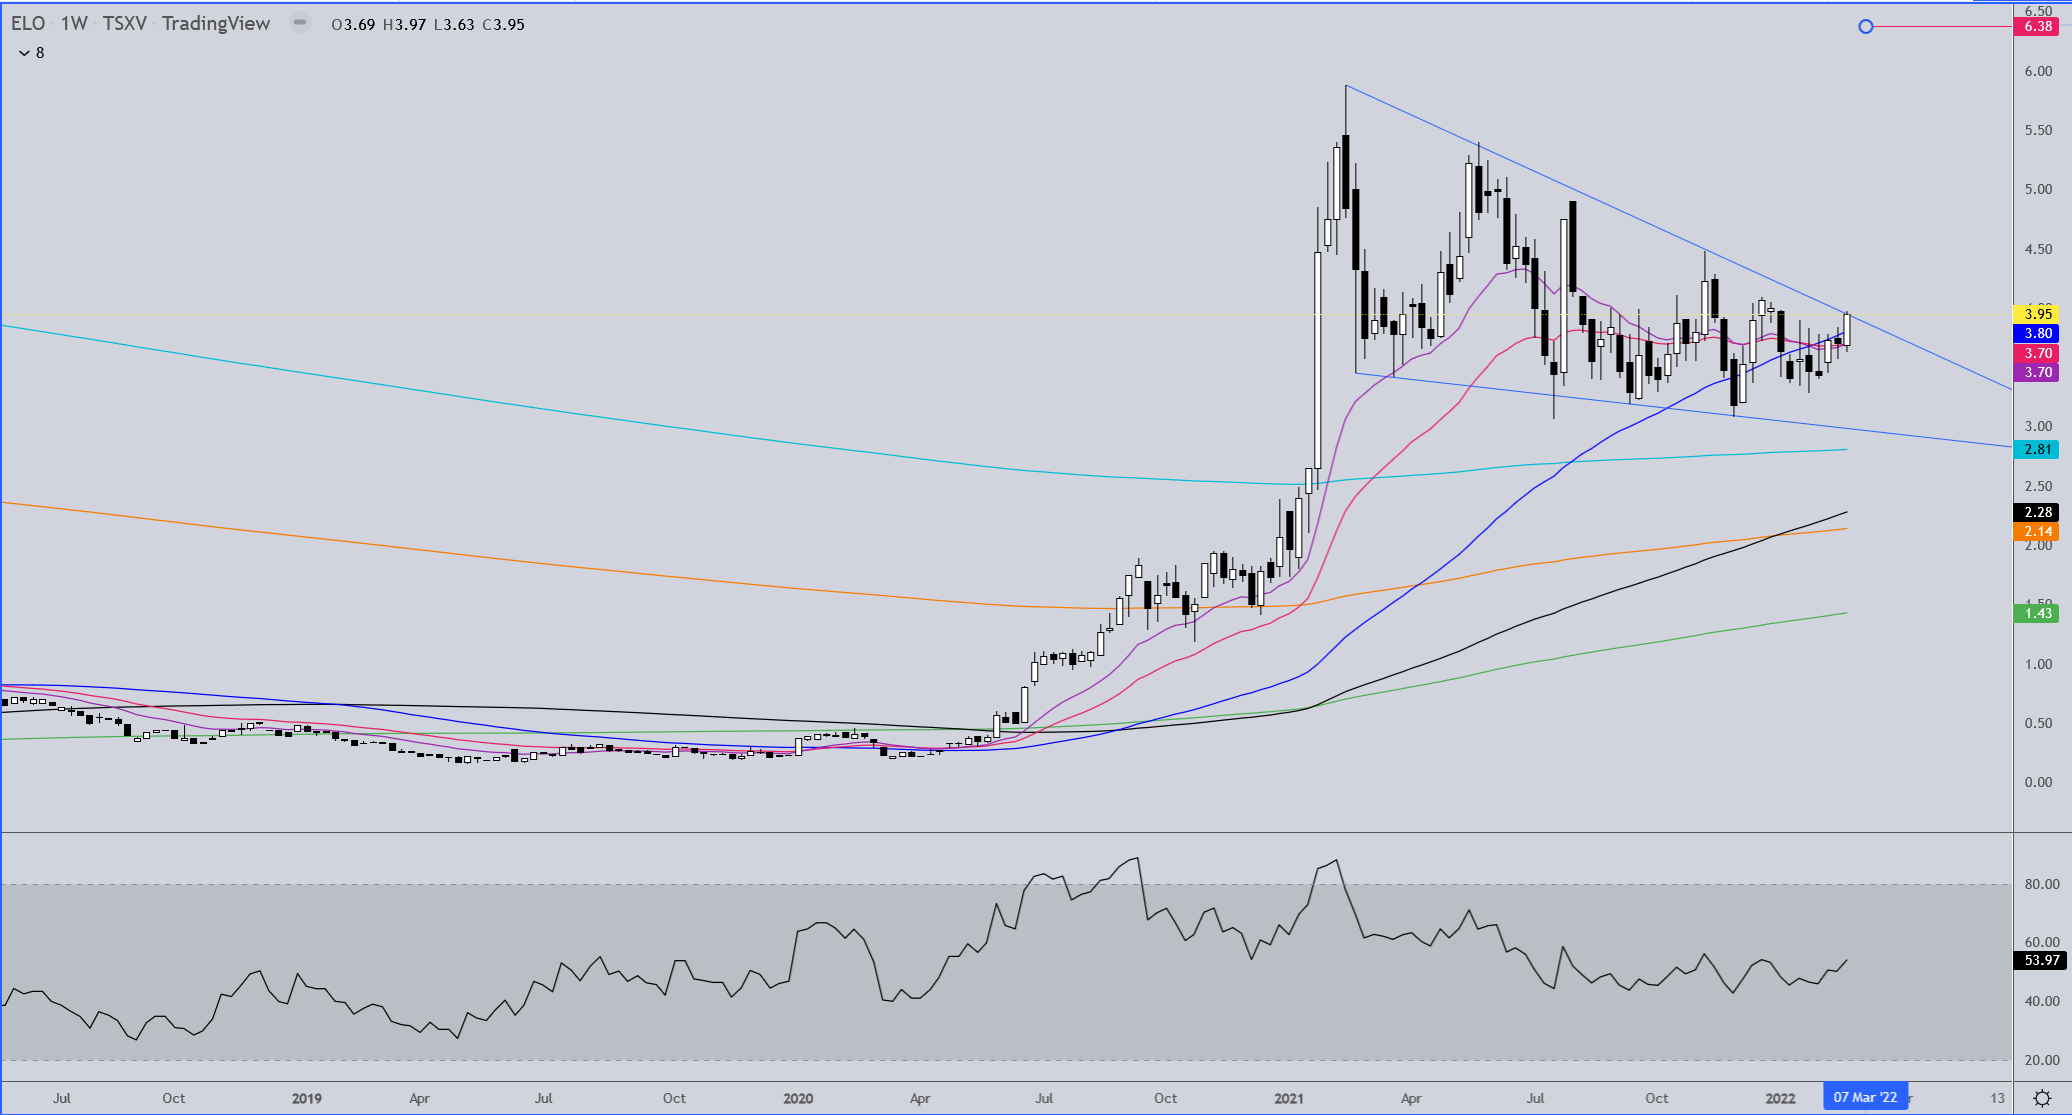
Quick ELO chart…
Potential Adam & Eve here with a target about a dollar higher. Seems to be a good chance for news in the next couple weeks.
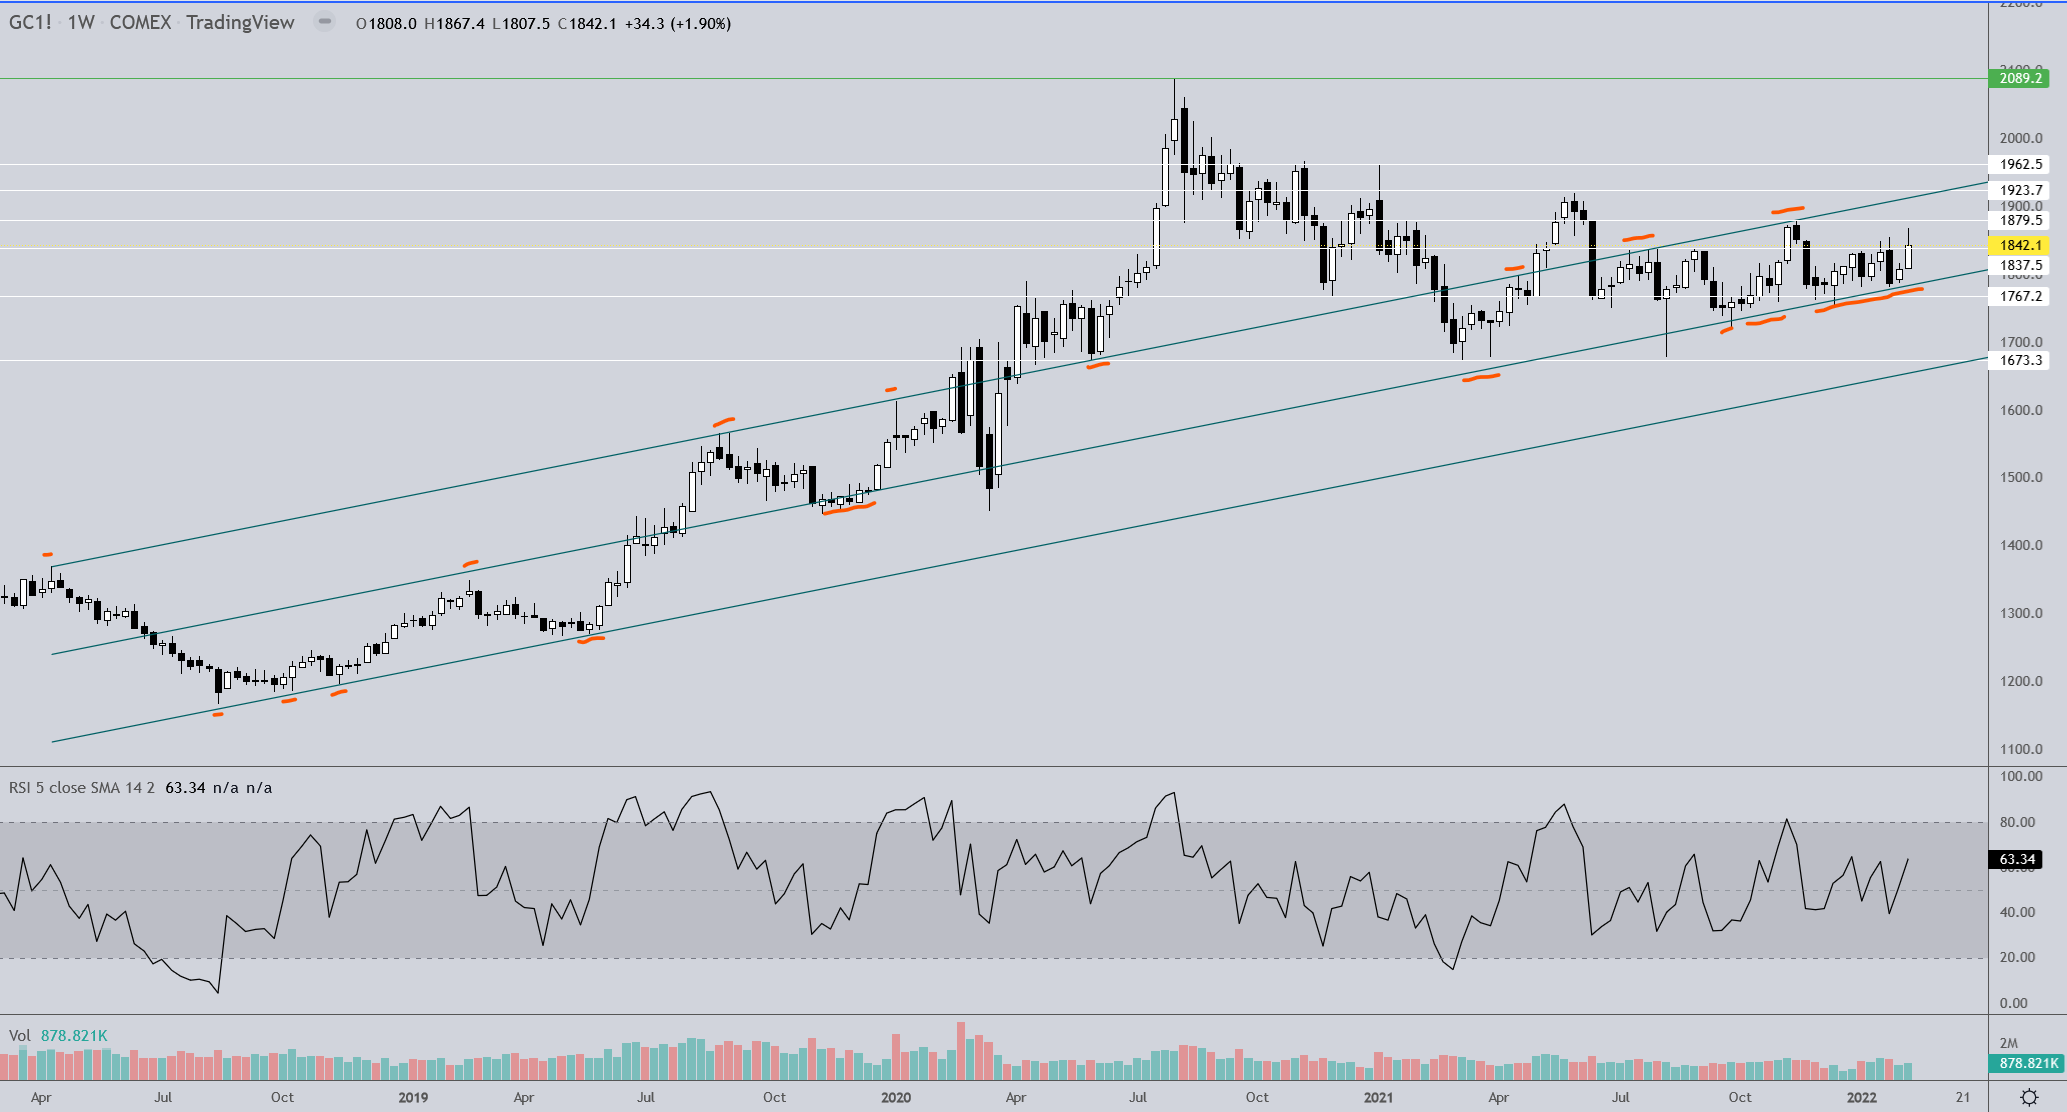
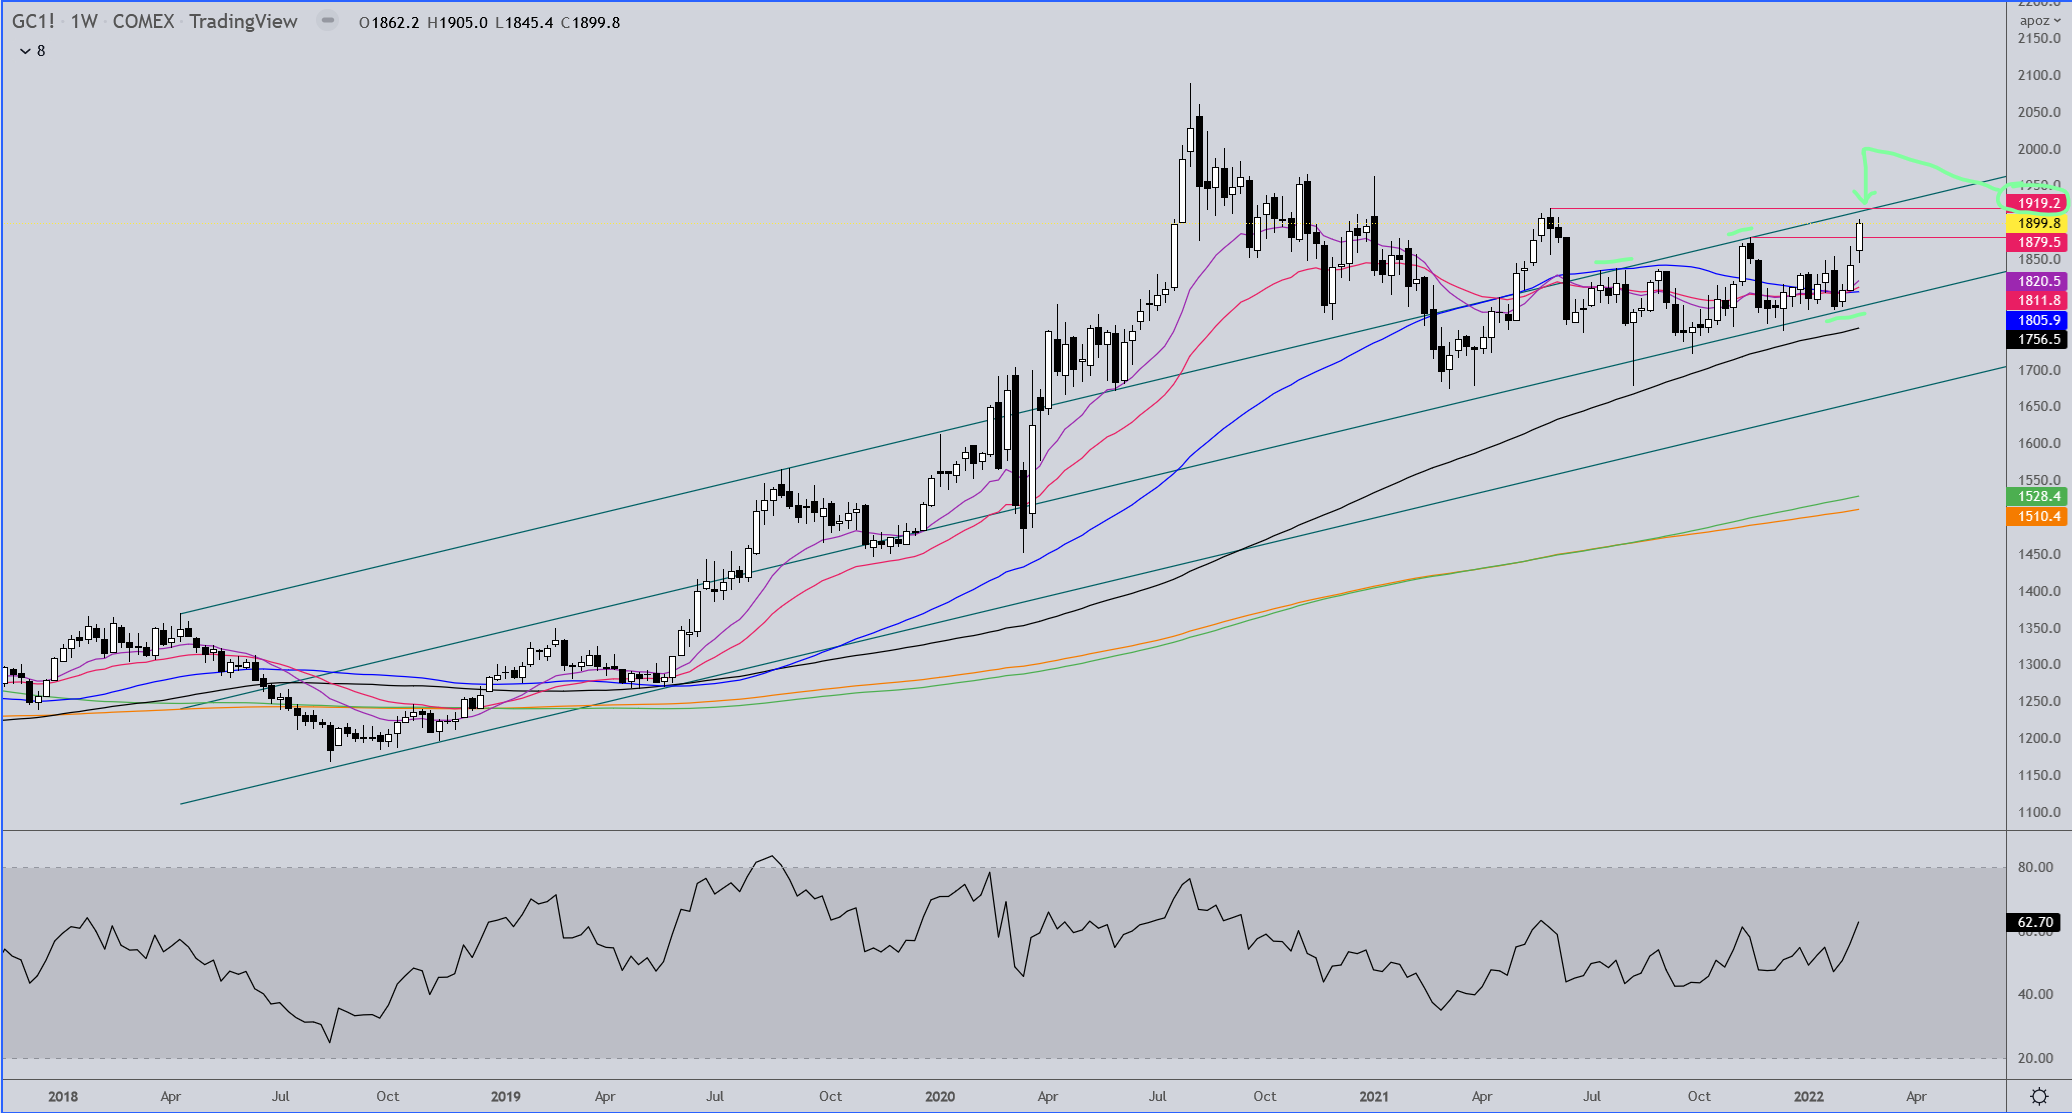
Here’s my big pic take on Gold
This first chart is a weekly interval starting at mid-2018 to present. The horizontal lines are major support and resistance. There is also a well defined channel drawn. Although gold moved up out of the channel during 2020, in 2021 gold pulled back into the channel and the centerline has held as support on every drop since April 2021 and the top channel line has been resistance on every attempted move higher since July of 2021. So on this chart, for the time being, gold is trading in a range between the upper and middle channel line…until it isn’t.
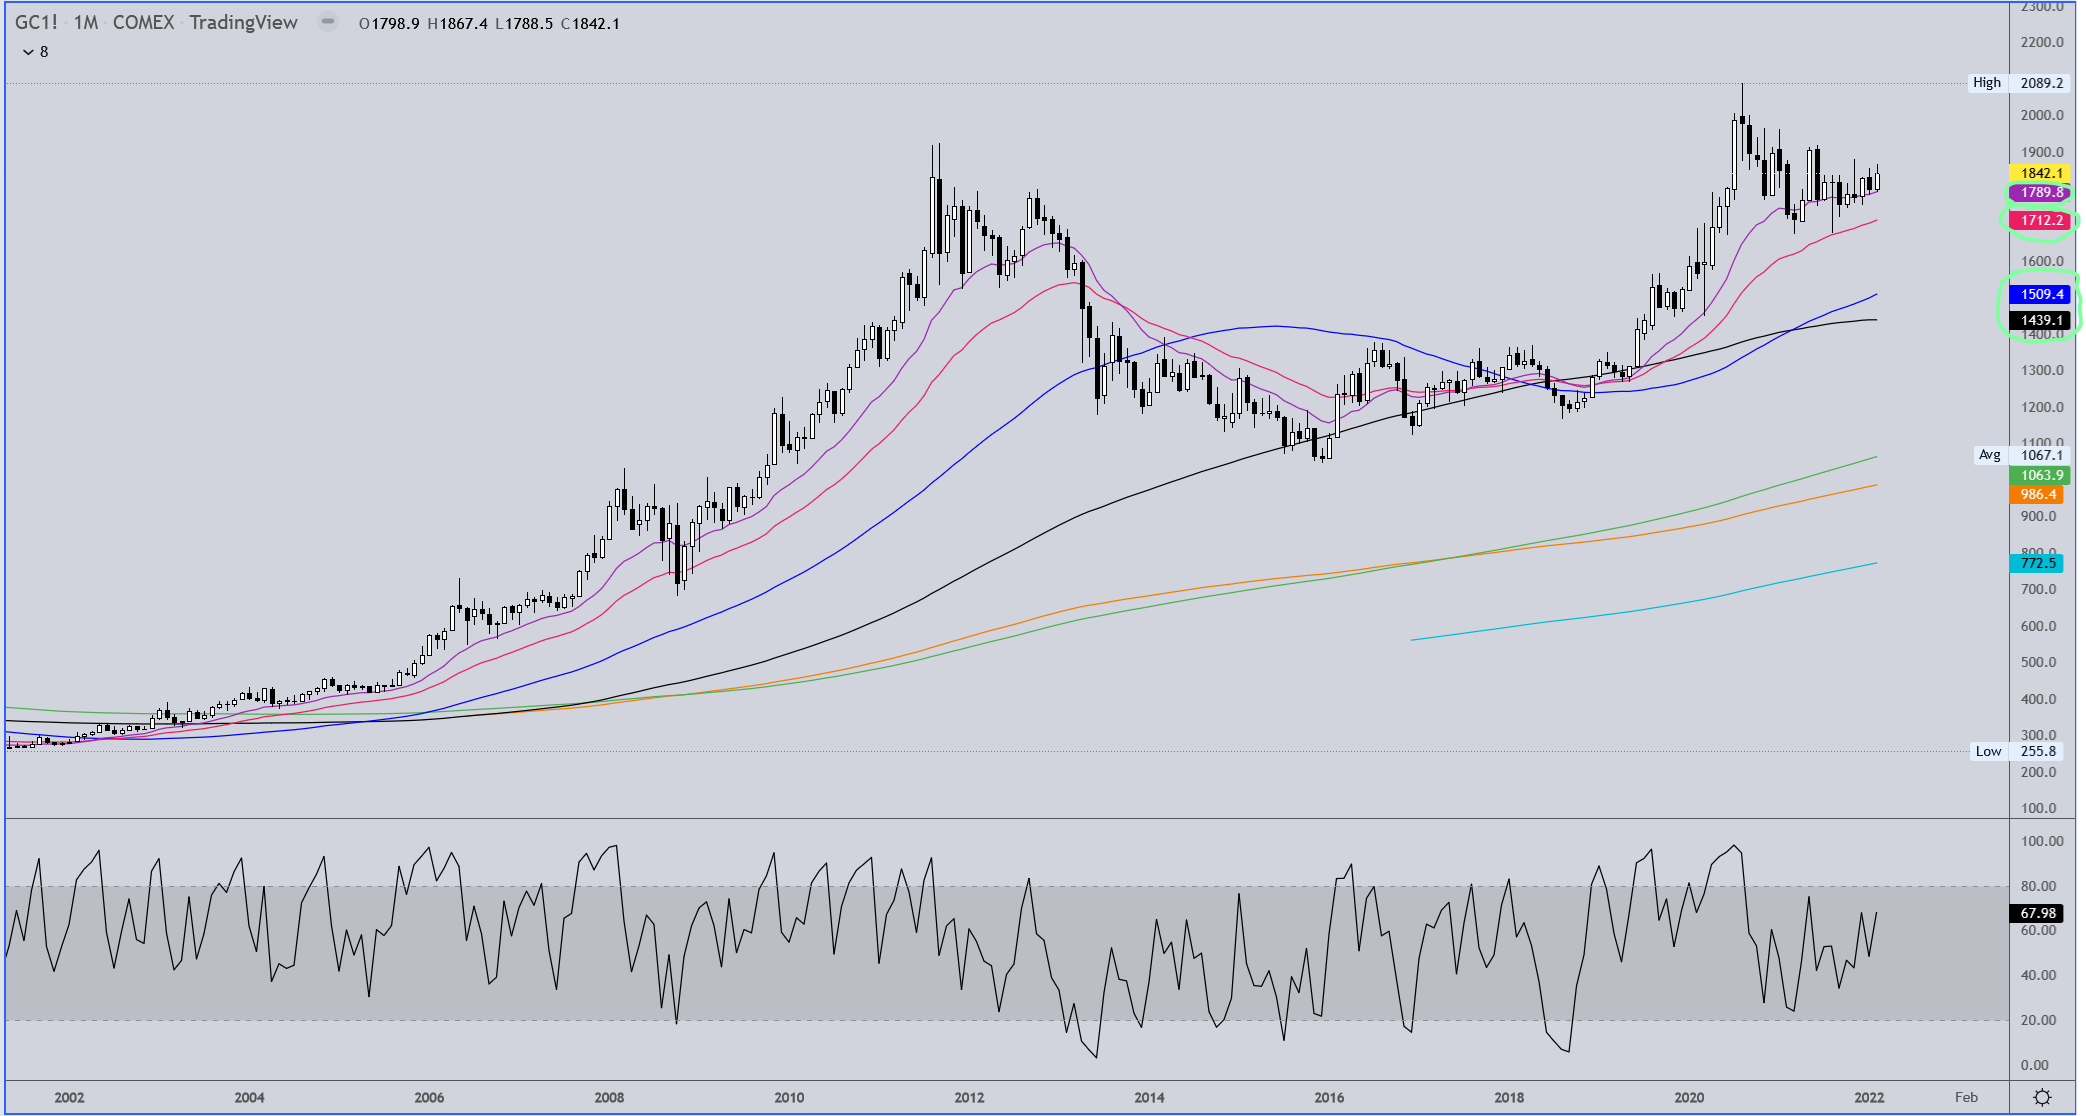
This next chart is the same weekly interval with the channel less emphasized with moving avgs added and a focus on the last two major swing highs, levels that need to be breached and held as support in golds attempt to move higher. You can see how nicely the violet and red moving avgs were dependable support from the time gold began its bullish move to all time highs starting in early summer of 2019, with the blue MA being the champion when the red MA was breached in April of 2020. Gold went on to all time highs from there and from that point drifted lower, eventually losing the support from the blue line and eventually it becoming resistance for the most part since July of 2021. All three of those MA’s started flattening out last summer when gold began a relatively narrow consolidation, staying between the upper and middle channel lines and, to some degree, the blue and black MA’s. As of last week gold has found support again at the blue MA and made a run for the previous swing high, but failed to get there as of yesterday. So this chart adds swing high resistances of 1880 and 1920 to the channel lines, as well as the converging black and blue MA’s. If the MA’s and center channel line should lose support, then we’ll likely drop to the lower channel line which is currently a little below 1700, but is rising several dollars a day. If that line should be lost, the next support is likely at the green and orange MA’s in the mid 1500s.
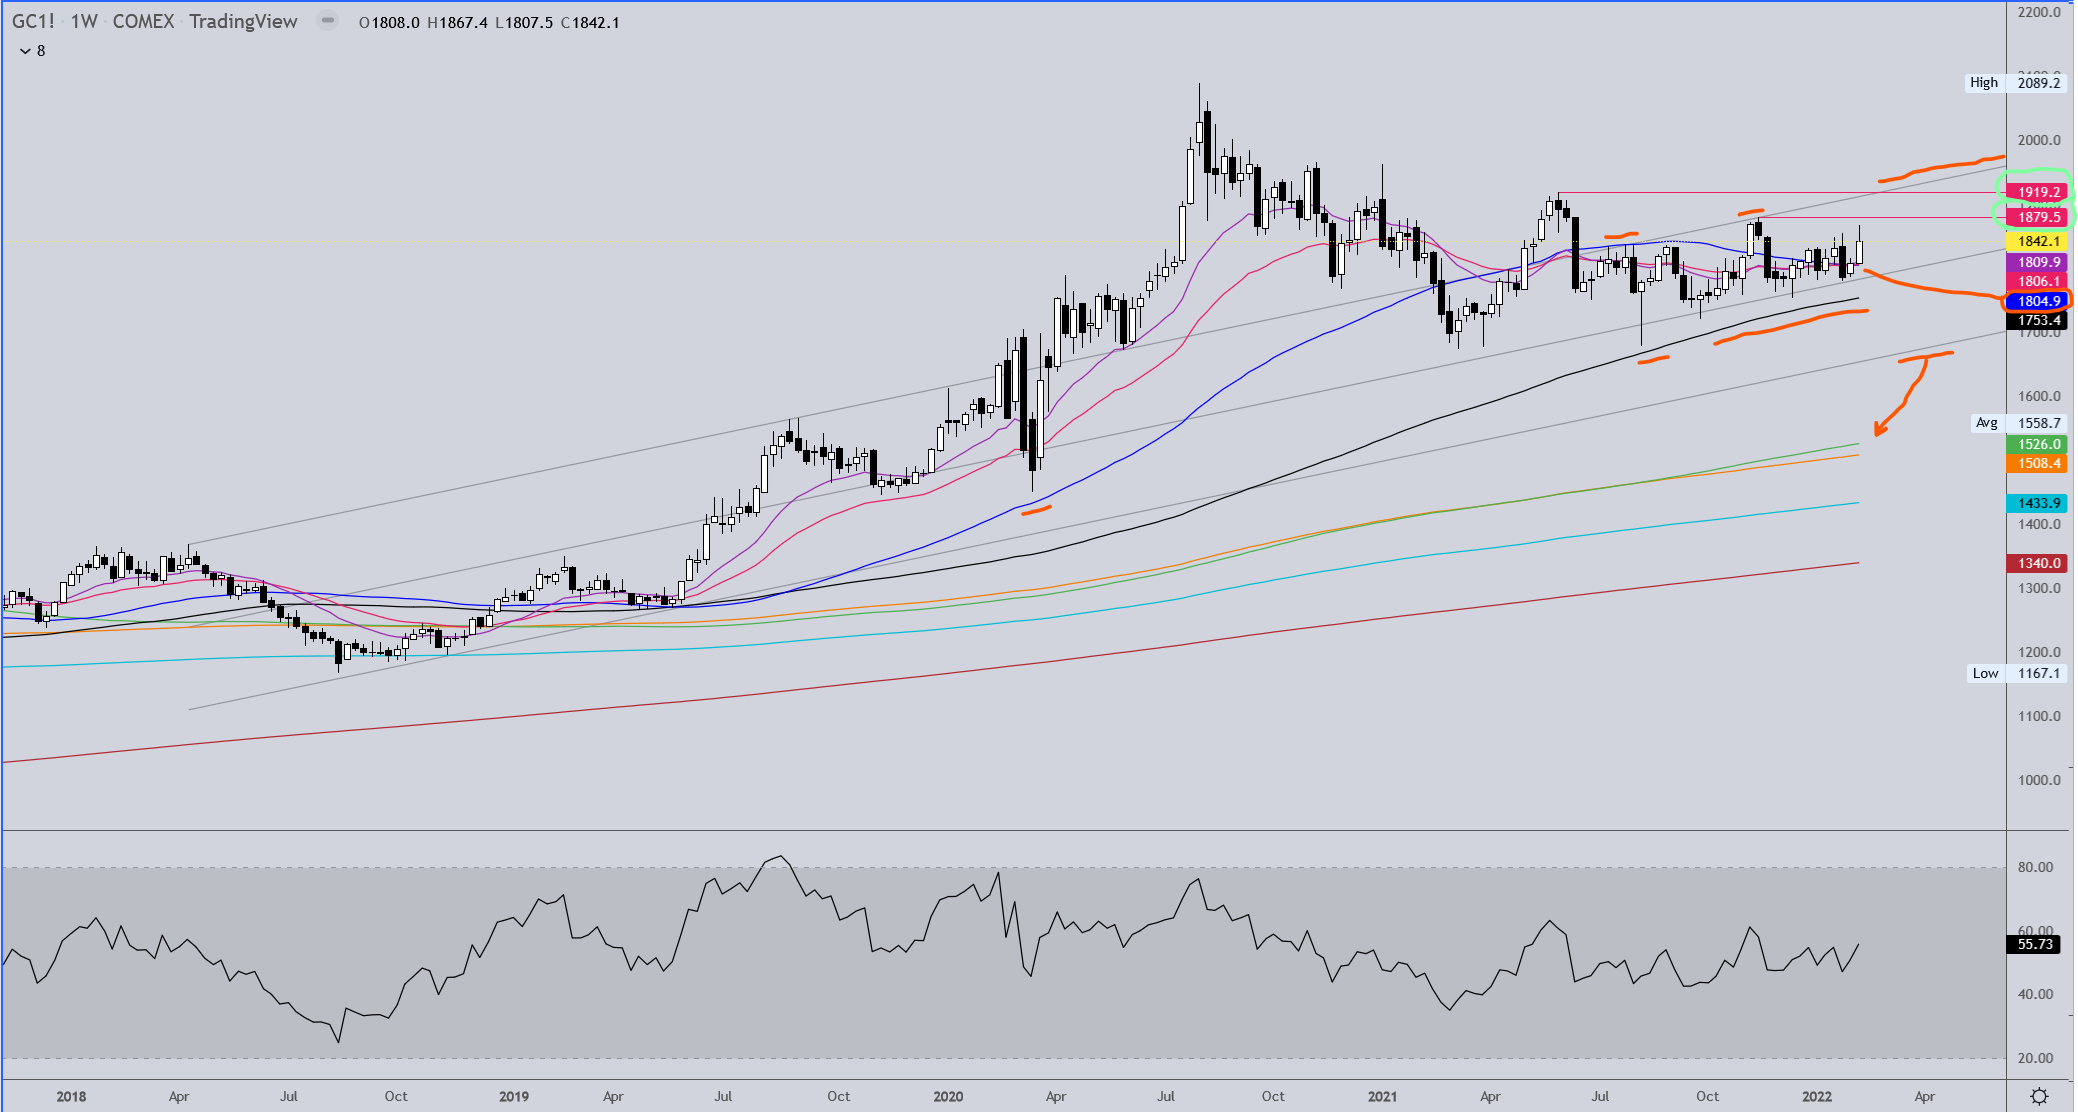
We also should keep an eye on the monthly chart as the moving averages have been quite helpful in finding support and resistance as well.
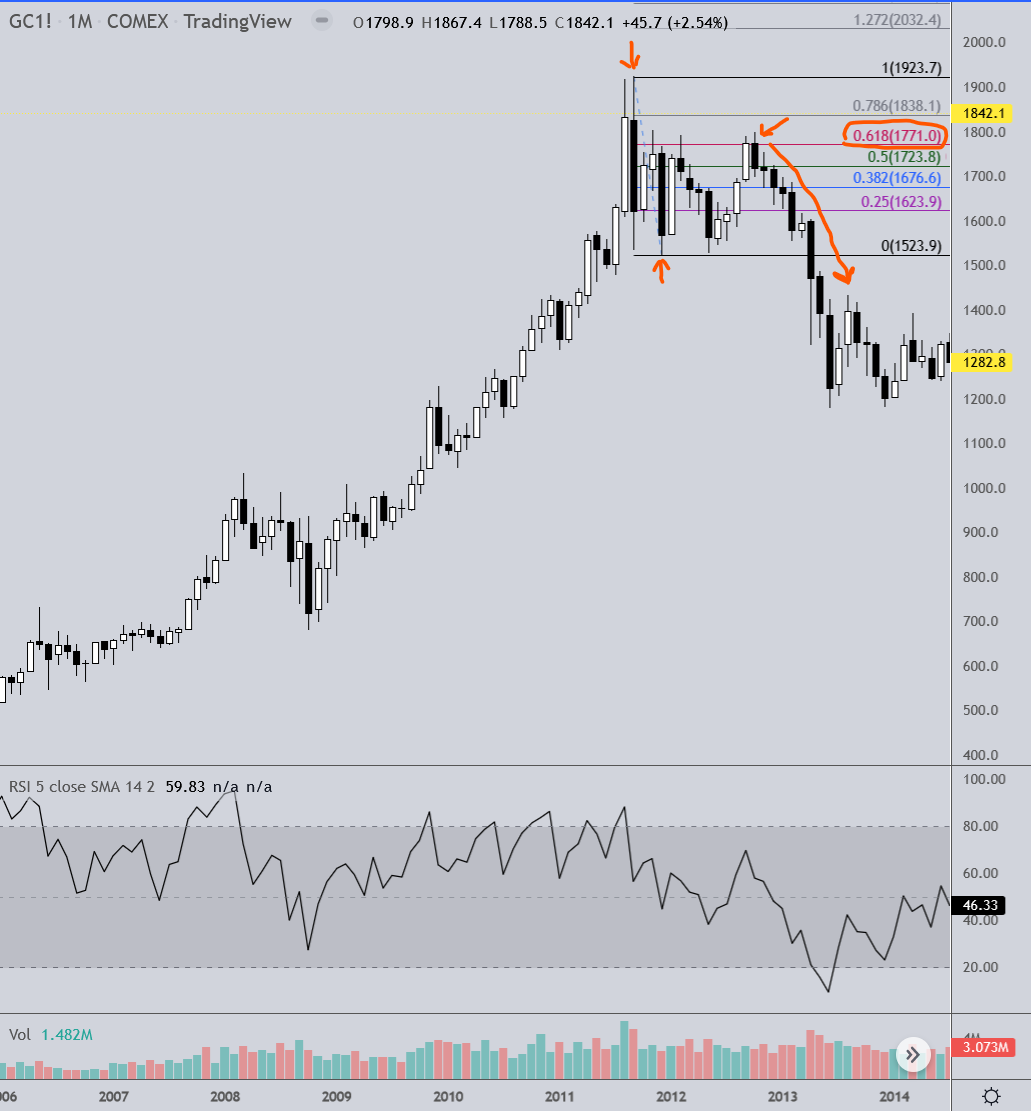
One more thing to point out in the event gold continues its upward trajectory… The first chart here is a monthly interval of the 1923.7 high from 2011 and the retracement that occurred from that high. Gold had a big drop after hitting this high. It recovered a bit more than 62% of the drop but dropped again to a slightly lower low. From there it again retraced about 62% of the drop and dropped again, where it eventually recovered again only to be rejected, again, at the 62% retracement level. The third time was the “charm” and gold fell into the 1200’s and beyond.
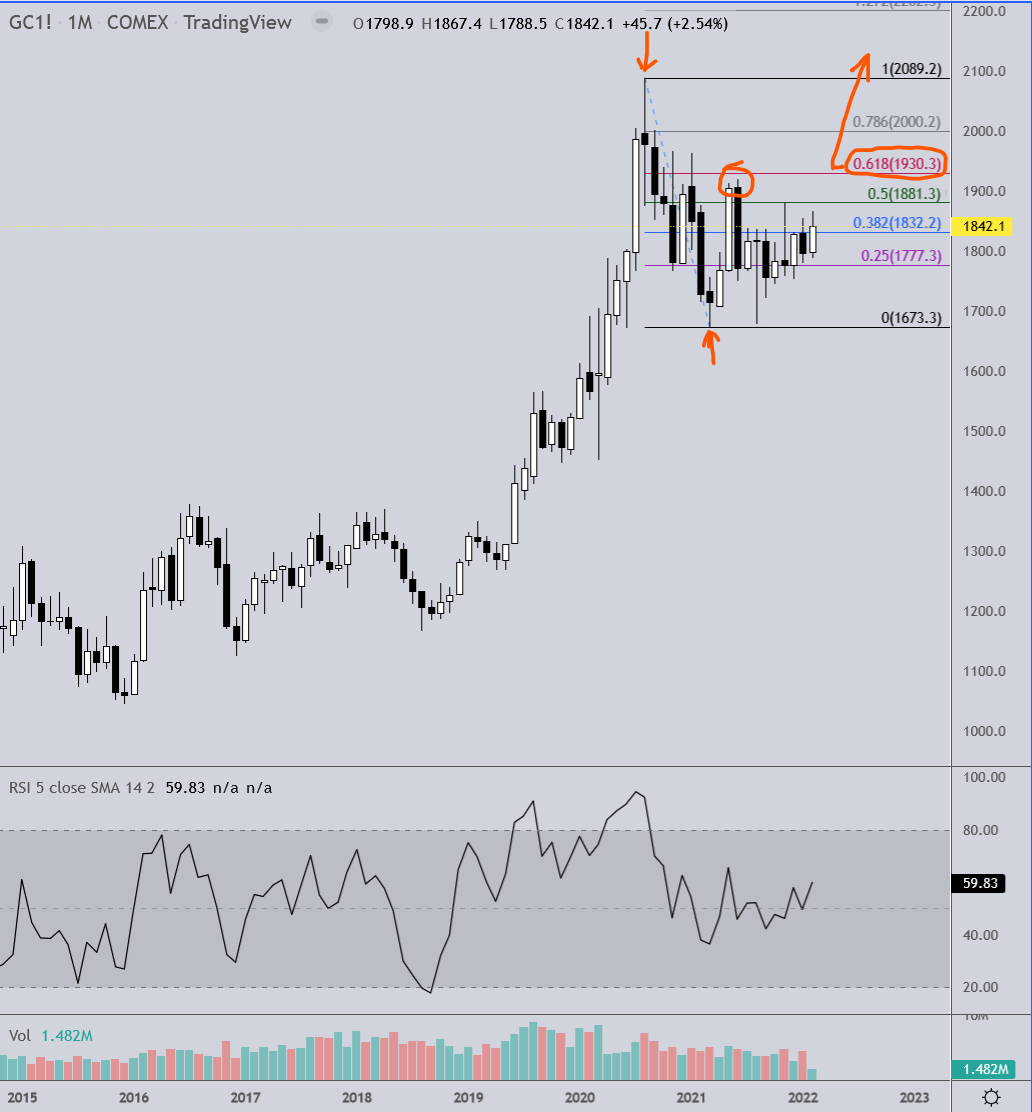
Now here’s a chart of the 2020 high of 2089.20. From there gold had a considerable drop down to 1673.30 before bouncing not quite back to the 62% level and dropped again, nearly retesting the previous low. Gold has been on an upswing since then and so far has only gotten to the 50% level. If gold is going to move up to new highs in the next two years, it needs to recover that 62% retracement level at 1930 and then get back above 2000, which is the next significant Fibonacci retracement level at 78.6%. Often times when anything surpasses the 62% level and gets to the 78.6% level, it will at least retrace 100% of the move and then go beyond, in this case to new highs.
2 Likes
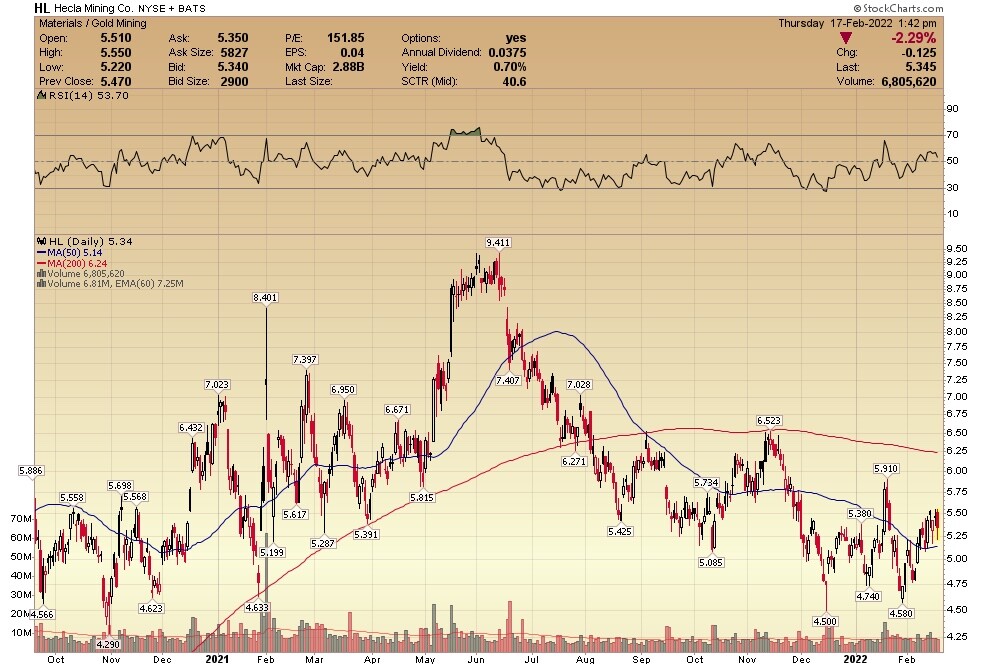
For those who may be interested, Hecla (silver producer) has a PR today:
Hecla Reports 2nd Highest Silver Reserves in Company History
Company Release - 2/17/2022
Gold reserves increase by 14% to more than 2.7 million ounces
COEUR D’ALENE, Idaho–(BUSINESS WIRE)-- Hecla Mining Company (NYSE:HL) today reported the second highest silver reserves in its 130-year history and provided an update on its exploration programs during the fourth quarter of 2021 and plans for 2022.
RESERVES & RESOURCES HIGHLIGHTS
- Silver reserves increased to 200 million ounces with Greens Creek increasing 12%.
- Gold production was replaced, and reserves increased by 14%.
- Measured and indicated resources declined primarily due to conversion to reserves.
- Inferred resources increased 8% for silver and 2% for gold.
- Extended or maintained already long reserve mine lives.
FOURTH QUARTER EXPLORATION HIGHLIGHTS
- Greens Creek drilling upgraded and expanded resources in 4 of the 9 zones.
- Drilling from Casa Berardi’s 9 rigs converted and expanded resources and discovered new mineralized structures.
- Midas exploration defined and expanded mineralization on the Sinter Structure and intersected high-grade mineralization on two new structures that are open along the East Graben Corridor.
- Hollister drilling from the new decline confirmed multiple new veins zones at the Hatter Graben resource.
- San Sebastian’s El Bronco and El Tigre veins reported initial inferred resources.
- 2022 exploration and pre-development planned spend of $45 million.
“Hecla’s silver reserves are near our all time high with Greens Creek reaching 125 million ounces, that mine’s second highest since 2002, and Lucky Friday’s 75 million ounces giving it a reserve mine life in excess of 15 years,” said Phillips S. Baker, Jr., President and CEO. “Since 2008, Hecla has, through exploration, added 239 million silver ounces in reserves, replacing production while also growing resources. We see further growth in reserves, resources, and production from our exciting exploration program. With the increasing need for silver to contribute to the transition to cleaner energy, Hecla has both the largest silver reserve and production in the United States which positions us to meet demand long into the future.”
(https://ir.hecla-mining.com/news-events/current-news/news-details/2022/Hecla-Reports-2nd-Highest-Silver-Reserves-in-Company-History/default.aspx)
A short but interesting read from @Goldfinger yesterday:
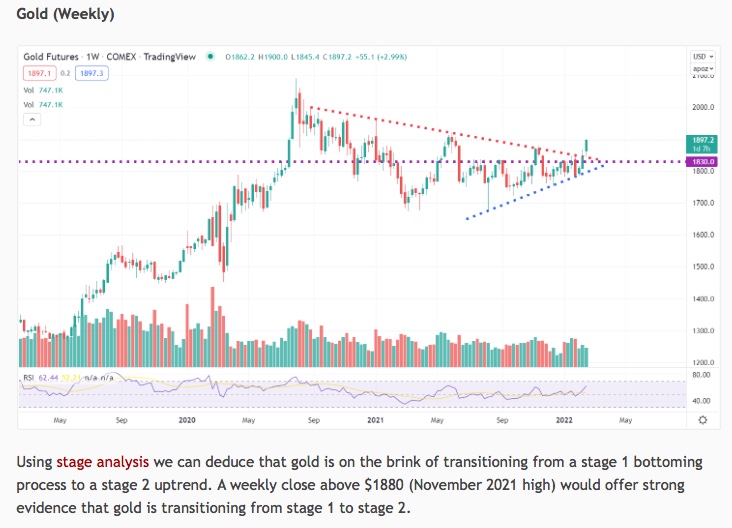
Fears of an imminent Russian invasion of Ukraine helped to drive April gold futures to a high of exactly $1900.00 this morning, bringing the weekly chart to the brink of a confirmed breakout:
As a veteran gold market observer/participant I am always skeptical of gold advances that appear to be driven by geopolitical concerns. While there may be a “Russia premium” in today’s $1897 gold price, the recent uptrend in gold is largely driven by macroeconomic factors including the specter of negative real interest rates for a long time to come. Moreover, Russia and China are making strides in promoting the ‘de-dollarization’ of global trade, a push that clearly benefits gold as a timeless store of value that is held in large quantities by global central banks.
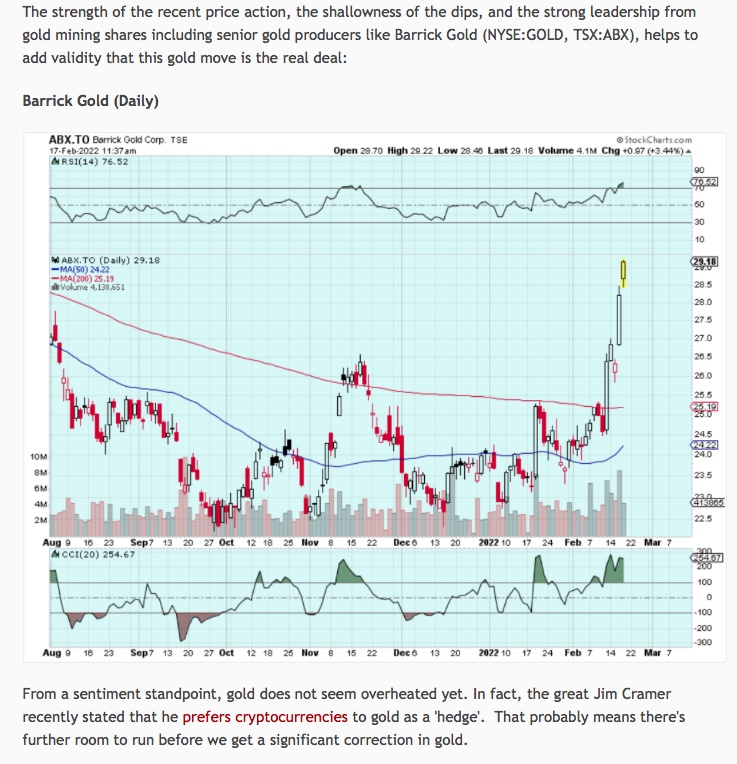
Gold Miners Surge As Gold Tags $1900
From a sentiment standpoint, gold does not seem overheated yet. In fact, the great Jim Cramer recently stated that he prefers cryptocurrencies to gold as a ‘hedge’.
That probably means there’s further room to run before we get a significant correction in gold.
Sorry I didn’t get to this sooner Easy but I’ve been a little busier than usual lately…
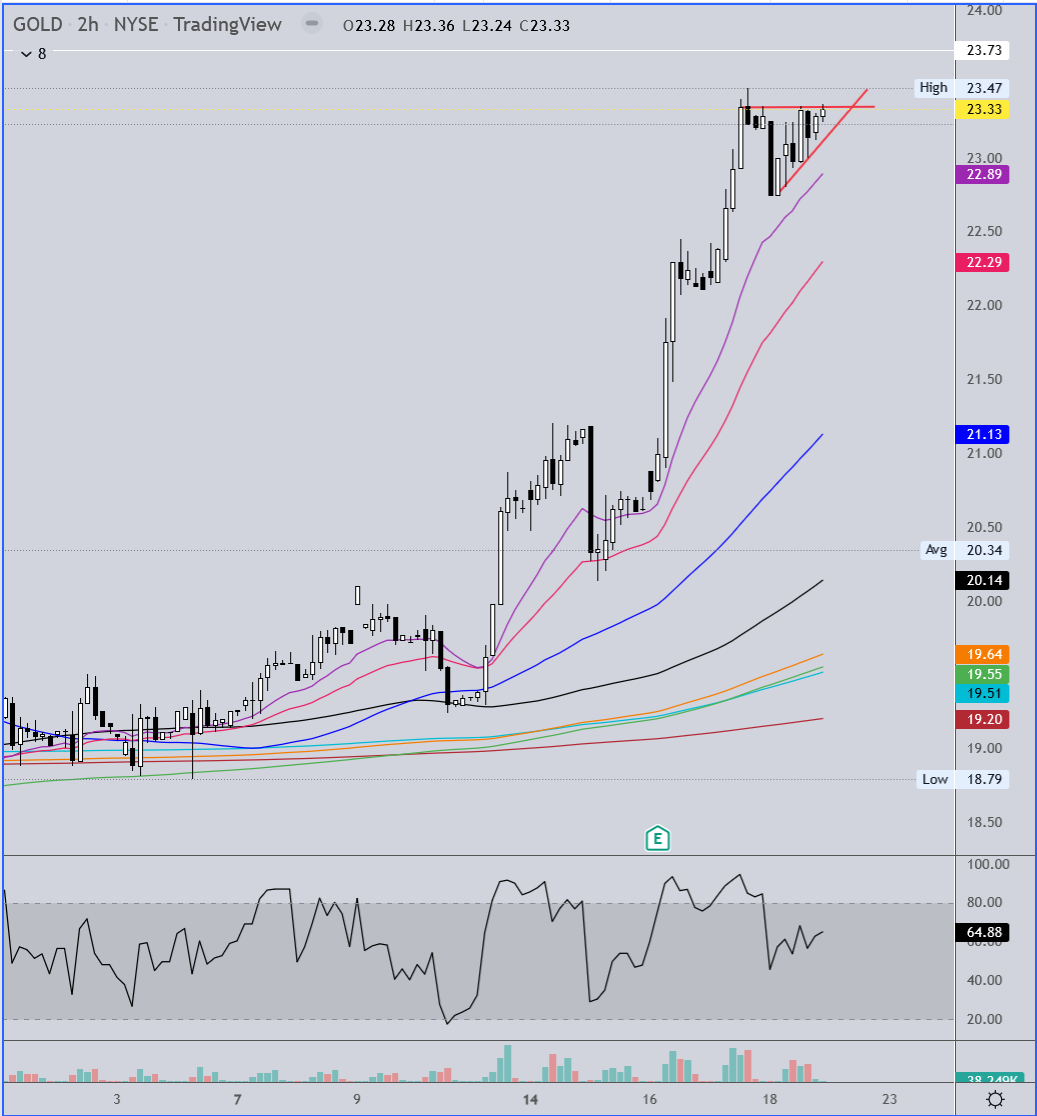
GOLD chart
This is the 2 hr interval, and interval I frequently used once upon a time then at some point gravitated away from it for the hourly, but have again found the 2 and 4 hr intervals to be more useful than the hourly. Note how the MA’s work so nicely for support during this uptrend. Nice little flag formation there at the top as well which is likely to be the consolidation prior to hitting some more interesting levels just above…
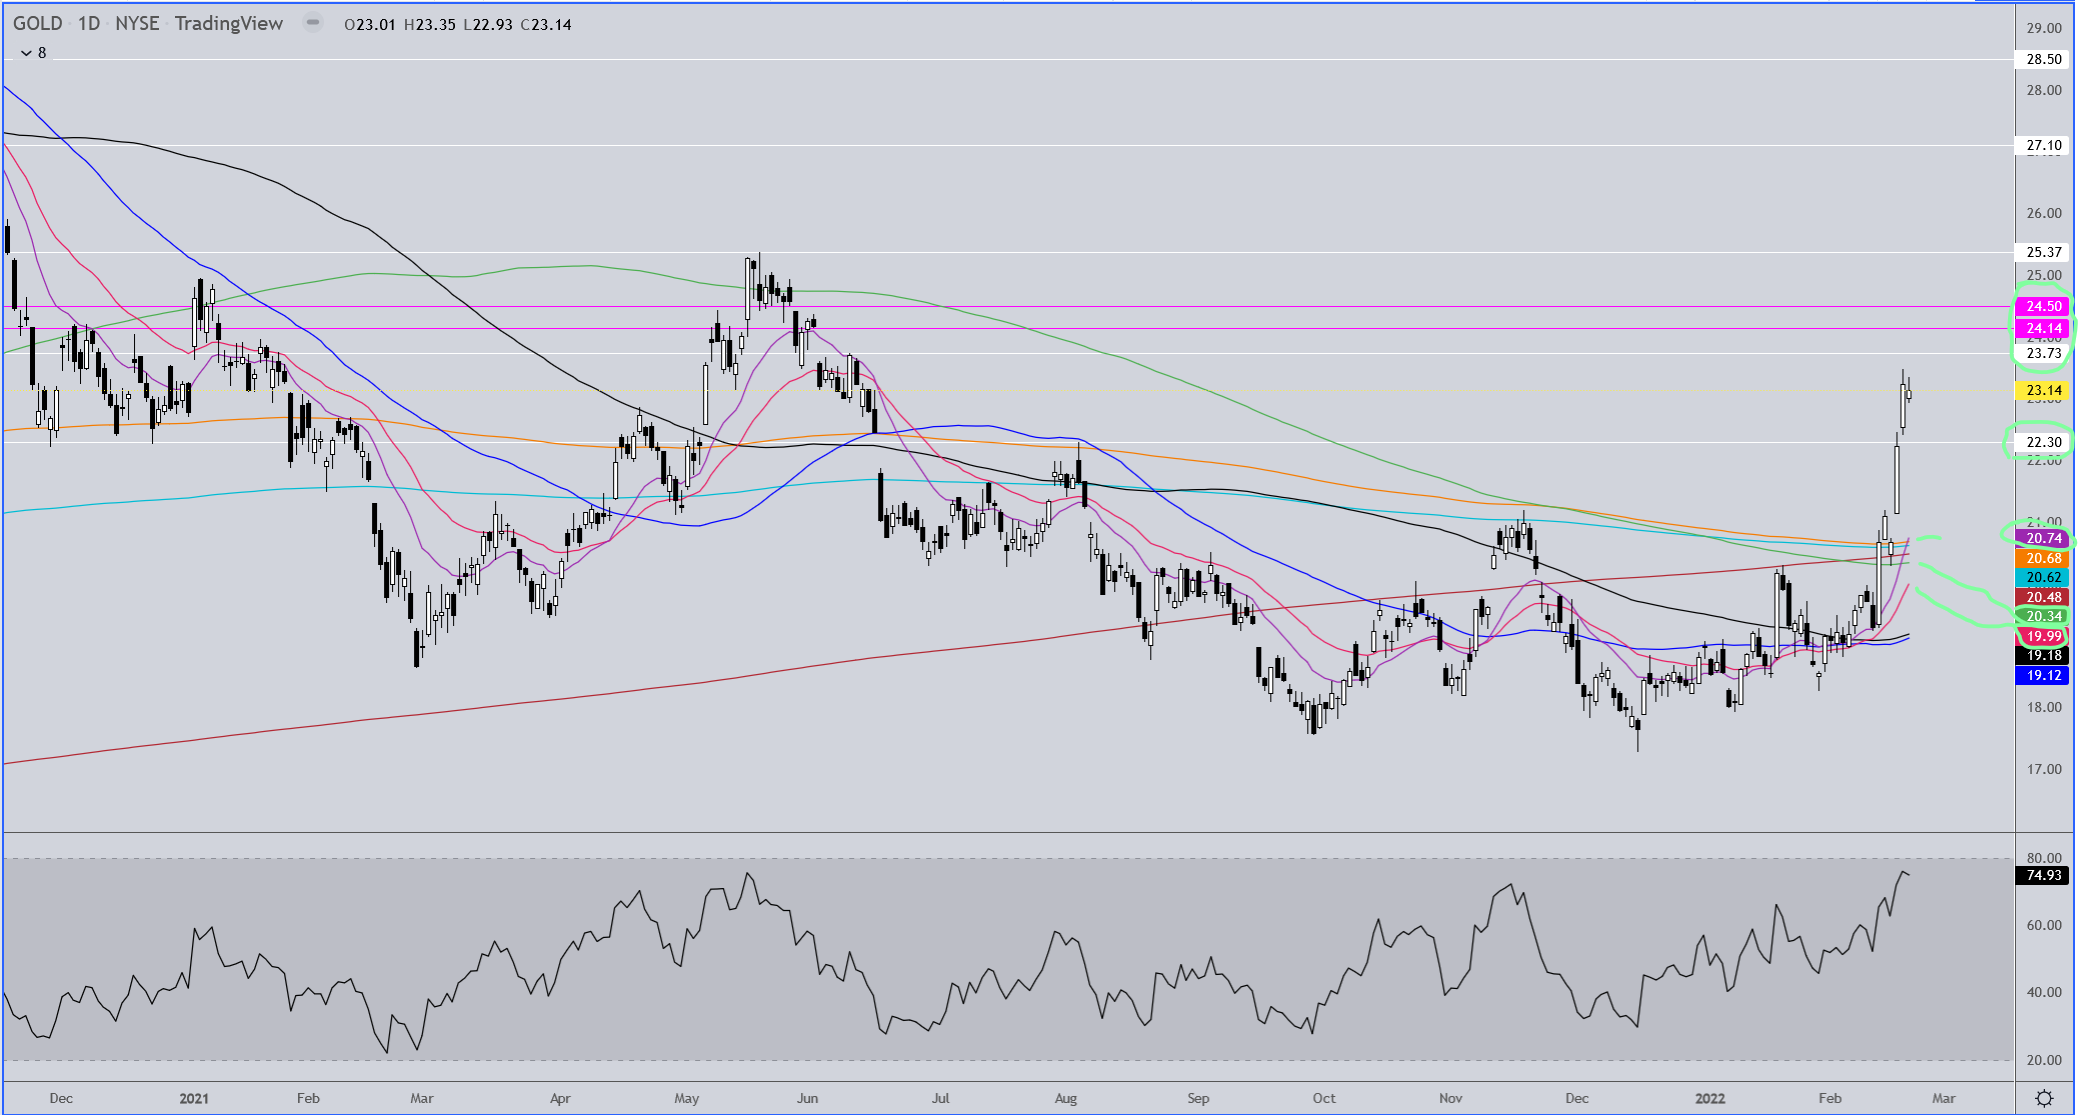
Now the daily interval. First, the flag on the previous chart is developing just below a gap that was made on June 2 of last year. The gap is from the white line at 23.73 and will be filled when price gets back to 24.14. There is another small gap just above that gets filled at 24.50. In the event that the flag breaks down and the stock has a deeper pullback, 22.30 - 21.88 is a good range to keep an eye on for support, as well as the 10 ma and 20ema and eventually the 50ma as well. The green MA on this chart is my version of the 200ma, although it is not the 200ma. That is my bullish/bearish “trend line in the sand”, so to speak.
Here’s the weekly gold chart. The drop gold had last Tuesday went again to the center channel line and held perfectly as support. It then bounced nicely up through MA resistance and we got a strong close above the previous swing high of roughly 1880. Next up is 1920. Note that Tues/Wed of next week gold is likely to find resistance at both the 1920 level and the upper channel trend line. It’ll be pretty easy to tell how bullish the gold move really is if it again moves up out of the channel and pushes to the previous high. The next breakout of that giant cup and handle should eventually see gold futures to around $3133, more or less.
1 Like
Several Miners with good Q4/Annual results reported. I’m sure there are others, but B2Gold (BTG), Lion One Metals (LIO.V) (LOMLF), and Hecla (HL) were notable. Anyone have others? Rich can you post charts on any of these that are worth looking at if you find time. HL looks ready to break above 200 daily MA, the other two are already above their respective 200 MAs. Thanks for your charts on Barrick (GOLD).
Hi Easy. I’ll post them later on tonight… probably after you’re asleep.
Before I post your charts Easy, I feel the need to put this one up of ELO/ELRRF? I don’t know if the breakout occurs this week or if there will be another pullback, but it’s a nice looking formation and you fundamental guys should find the company interesting.
1 Like
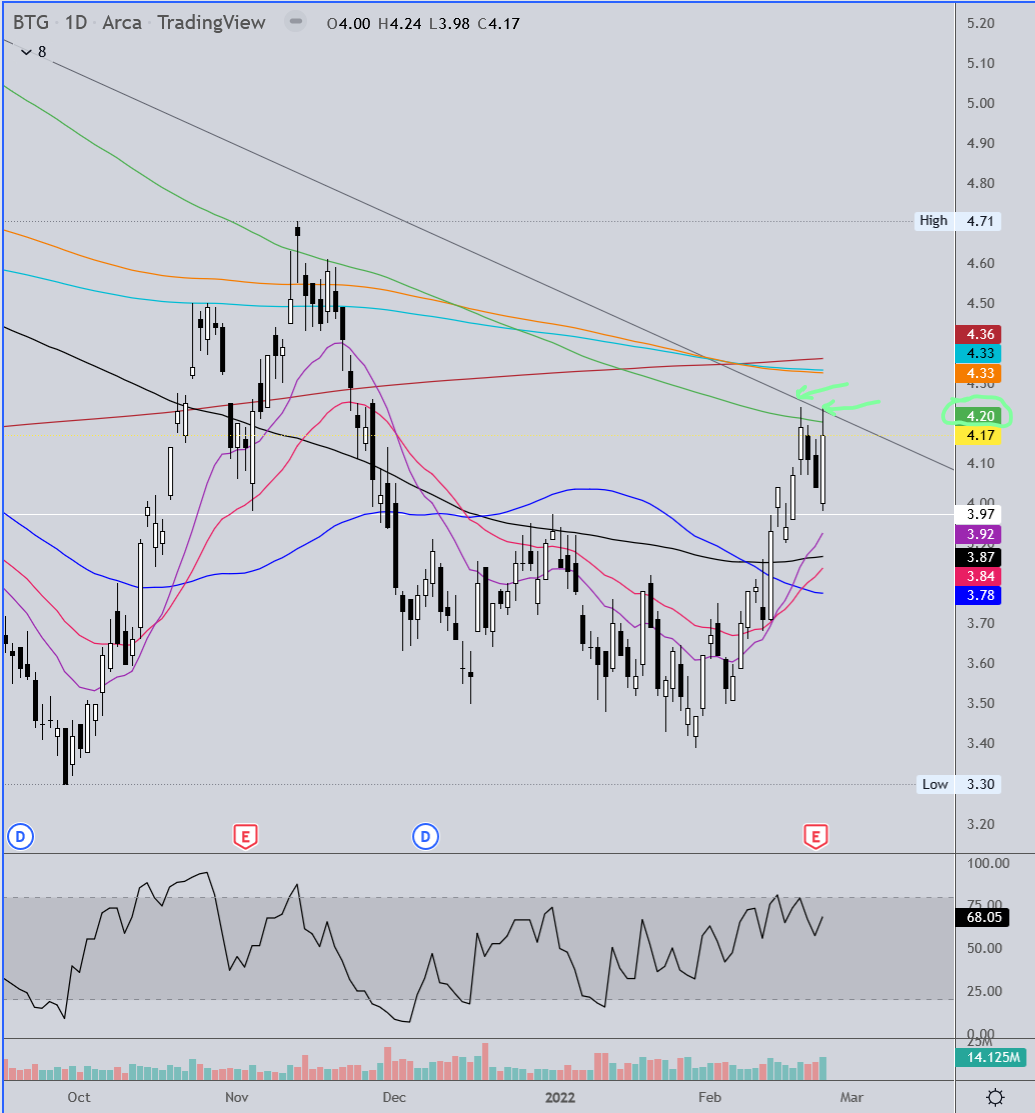
BTG
This one pulled back again today after hitting downtrend line resistance 3 days ago along with resistance at the green MA. There’s some bearish resistance possibly showing as well, but you’ll need more of a pullback to confirm that. Seeing that gold is up 20 points tonight, perhaps the stock will blow through this resistance tomorrow, in which case things should start getting fun again with miners.
This chart is merely pointing out the resistance also occurring at the 61.8% retracement level.
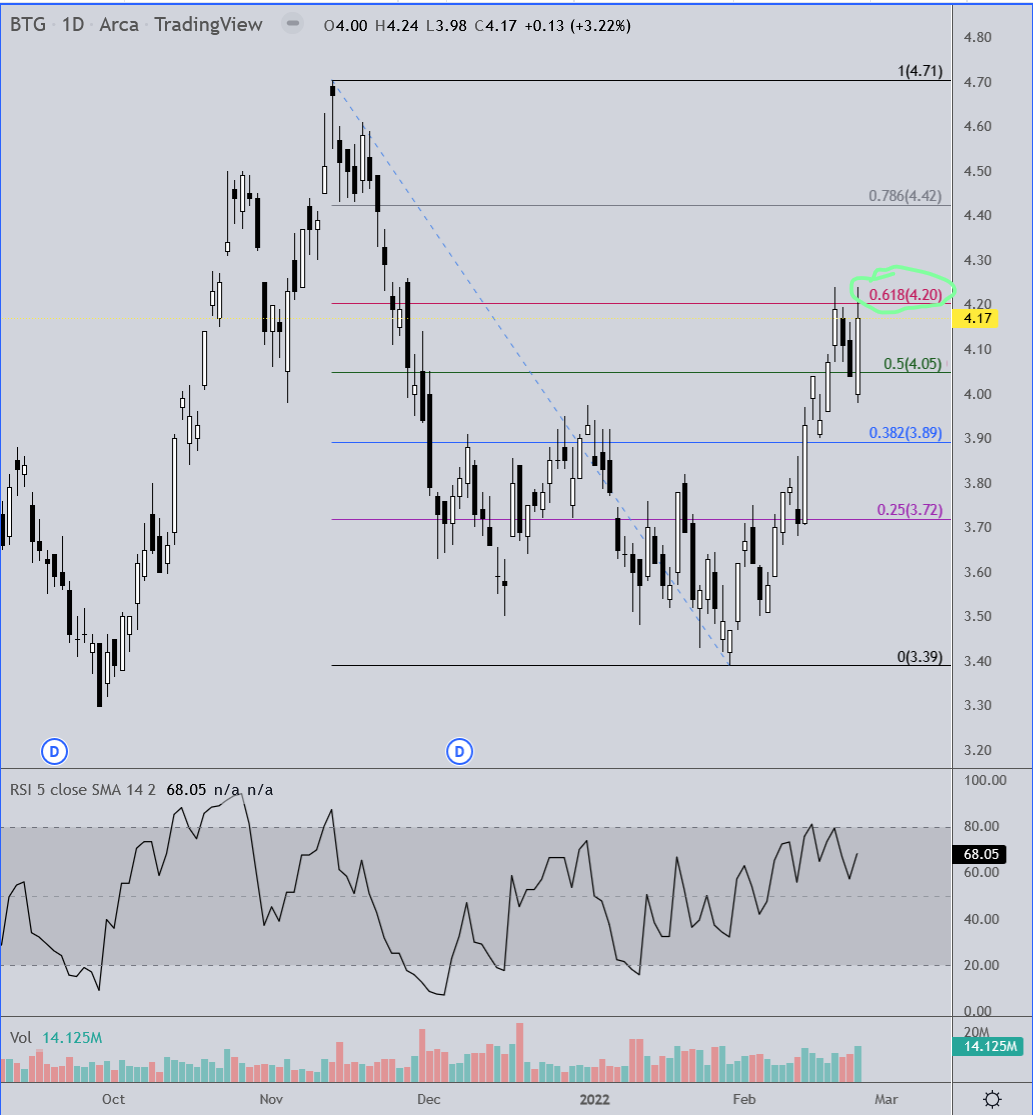
If you should get more of a pullback from here you’ve got MA support on the first chart and watch the Fibonacci retracement levels there as well. A shallow pullback to the 38.2% level would be indicative of continuation of the uptrend.
1 Like