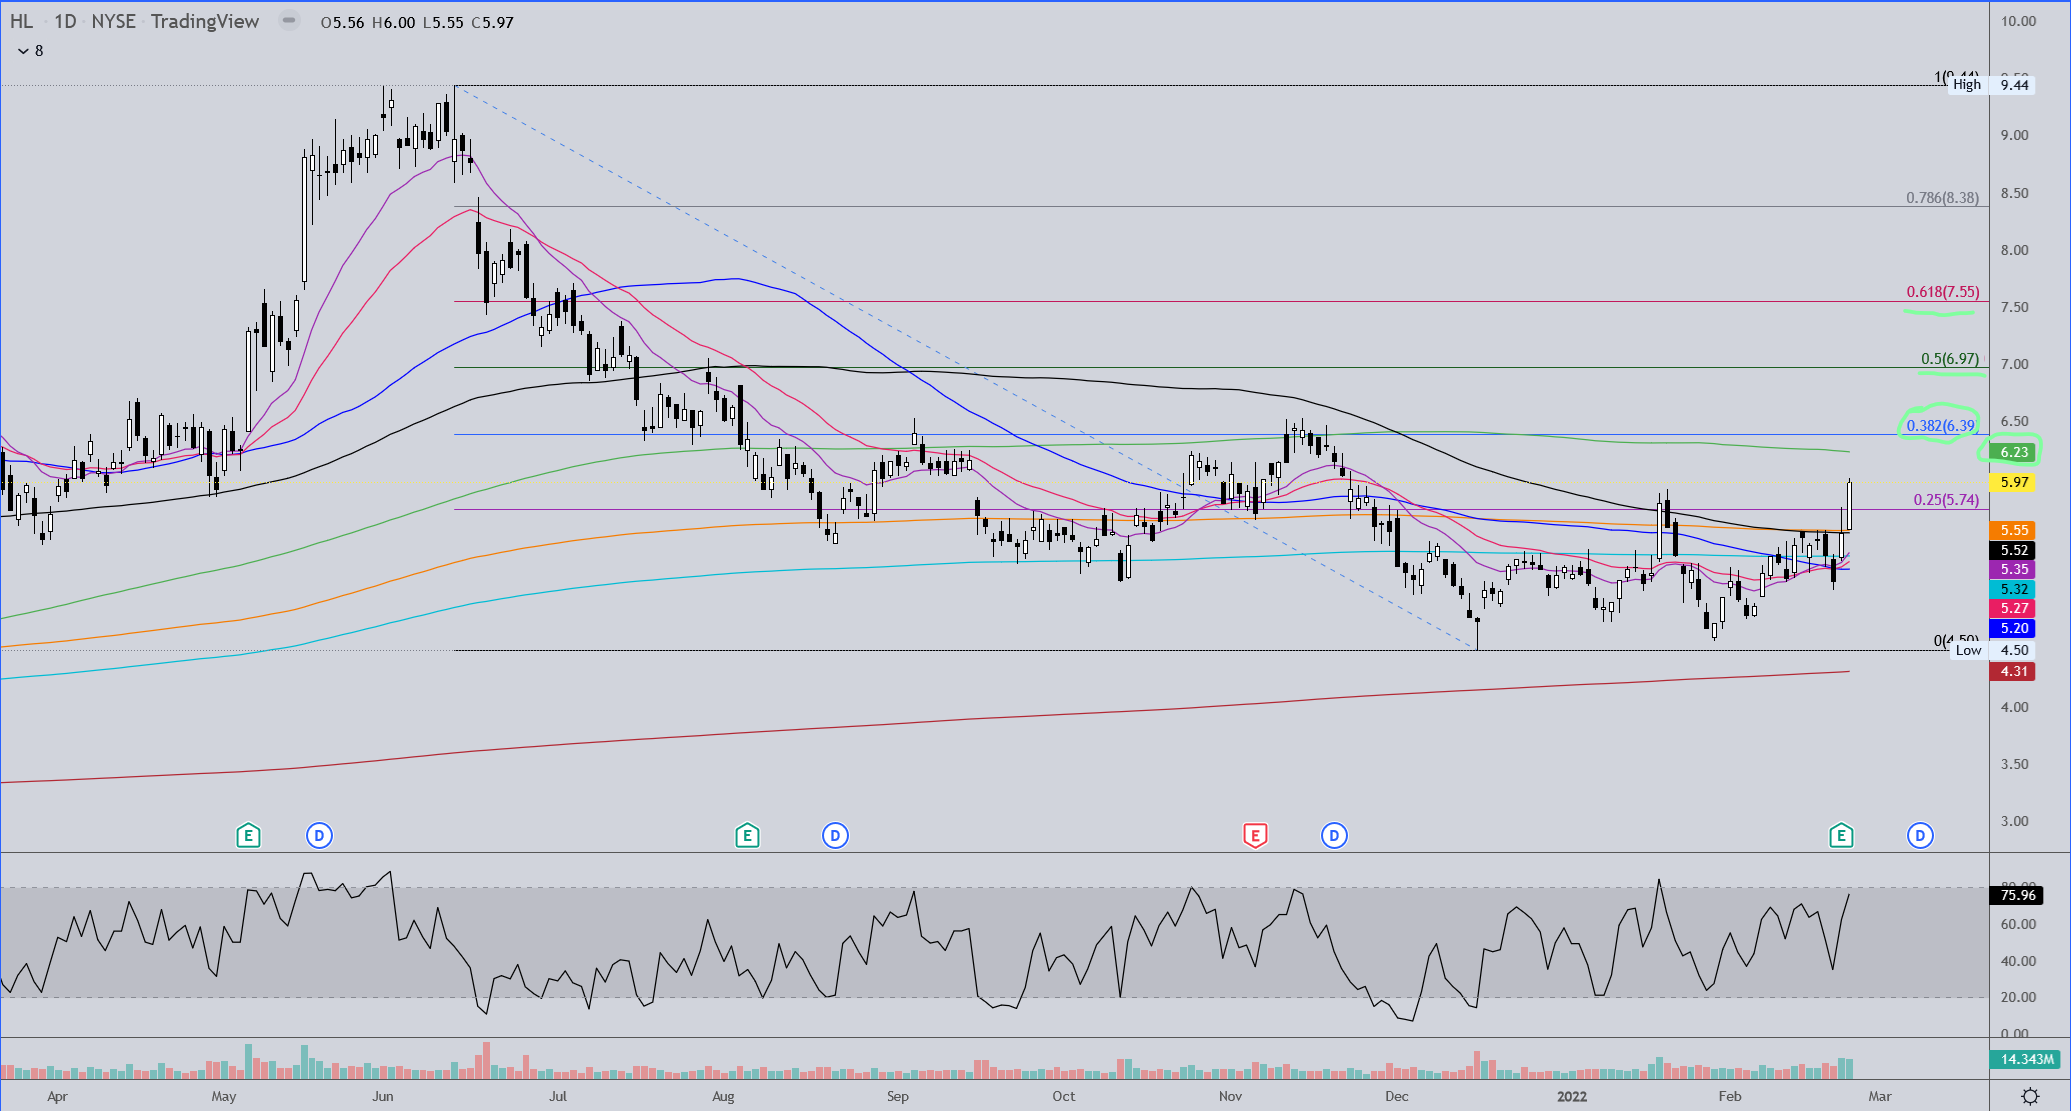
HL has pushed through some strong resistance in the past couple of days and today closed above the previous swing high. If the rise in gold this evening sticks through to the morning you’ll probably have a gap up here and that last swing high should be a decent support area on any pullback. The green MA is my equivalent to the 200MA so to get above that and get it turning upward should be a nice support area as the stock rises through the highlighted Fib retracement areas.
Easy brought my attention to SKE this weekend and I thought I’d post the charts here because they’re pretty interesting and projecting some very nice future profit potential. Don’t ask me about the fundamentals of the company though. Easy probably knows ![]()
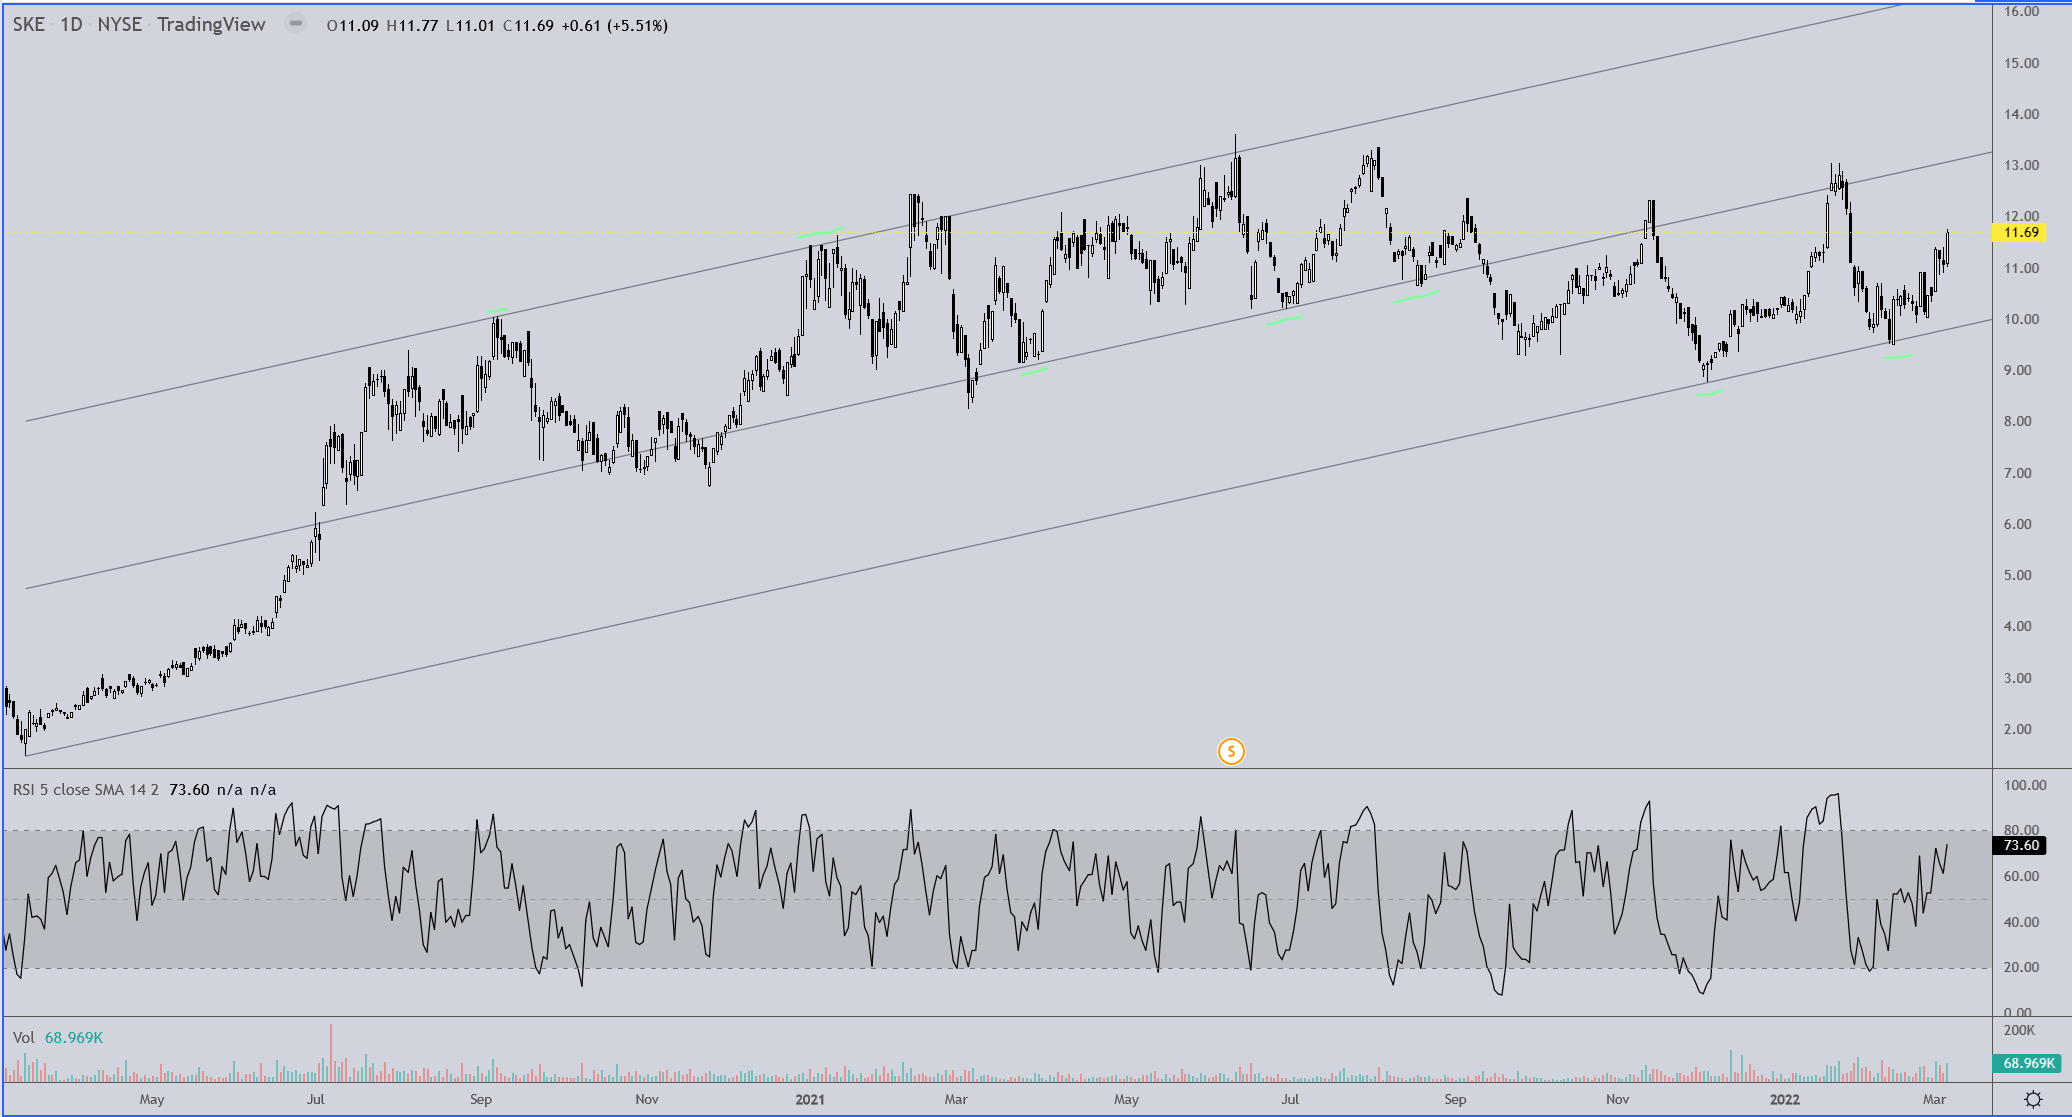
SKE has been trading very nicely in a channel for the better part of two years now, and has recently bounced off the lower channel line twice. The next chart will make this more interesting.
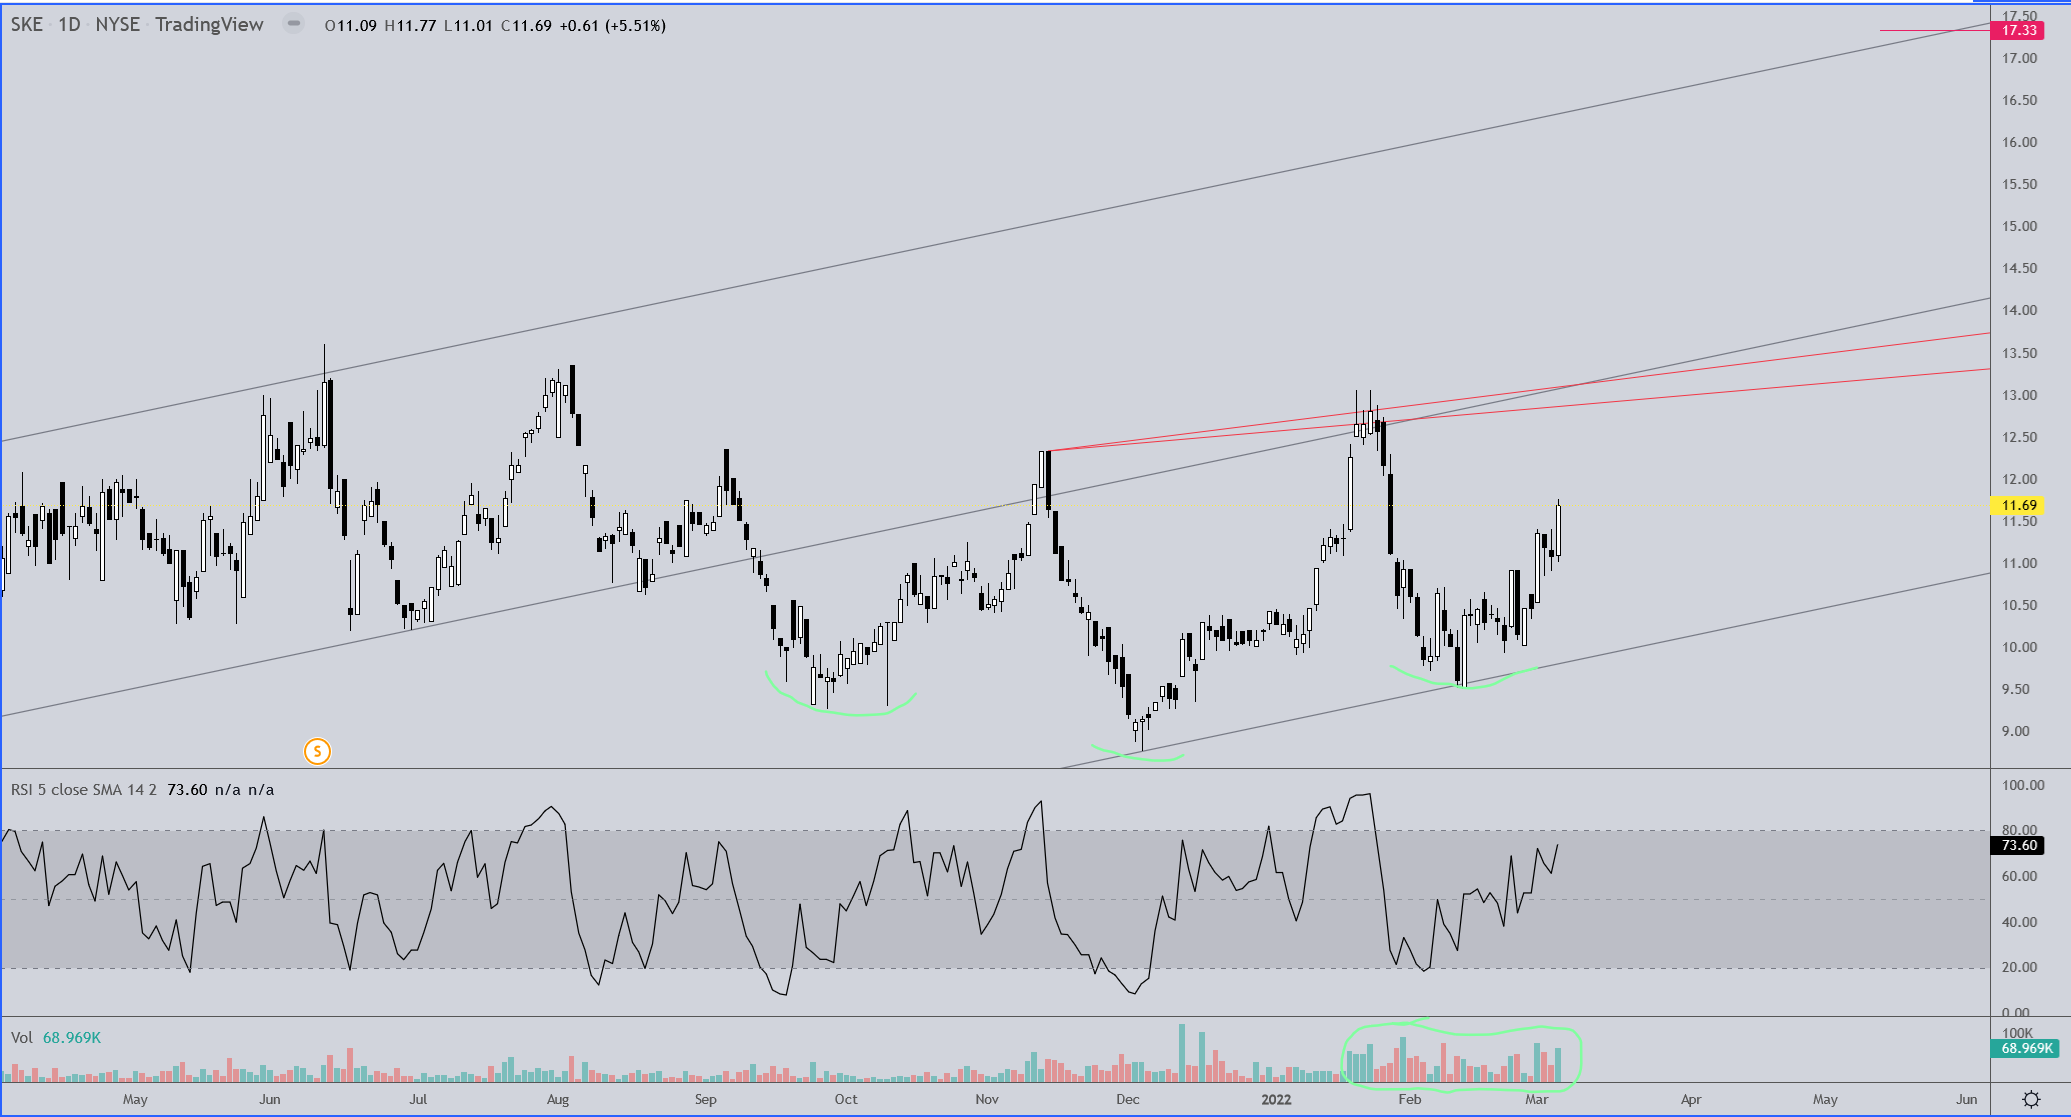
Taking a closer view, the stock appears to be wrapping up the right shoulder of an inverted head & shoulders, with a potential target price of around 17.33, depending upon where on the neckline the breakout occurs from… providing the formation plays out. Note the increase in volume on the right side of the head and the right shoulder.
TR,
I have a long position on this one. BTG did do a shallow pullback to a 3.94, just a little above your 38.2% (3.89) level as indicated on your second chart commentary. Today’s close of 4.45 was just above your 4.36 trendline as indicated on your 1st chart. Very nice predictive chart analysis for the 1 day interval! Is a new chart pattern forming?
Long here too. SKE continues upward within the nicely delineated channel closing today at 12.18.
There are only 65.5M shares on this one and $30M cash. SKE performed a share consolidation (1 for 4) the middle of last year and moved onto the NYSE. Onward and upward …
Thanks,
EZ
Lion One Metals (LIO.V) holding the 1.22 support, but seems to be pulling back after advancing and closed today at 1.23.
HL is approaching your .5 resistance level (6.97) as it closed today at 6.95.
Gold is looking rather stellar and blown past your weekly chart from 17 days ago closing closing today around 1995.90. Is next weekly resistance around 2080-2100?
Chart on SAND please if you find time.
EZ
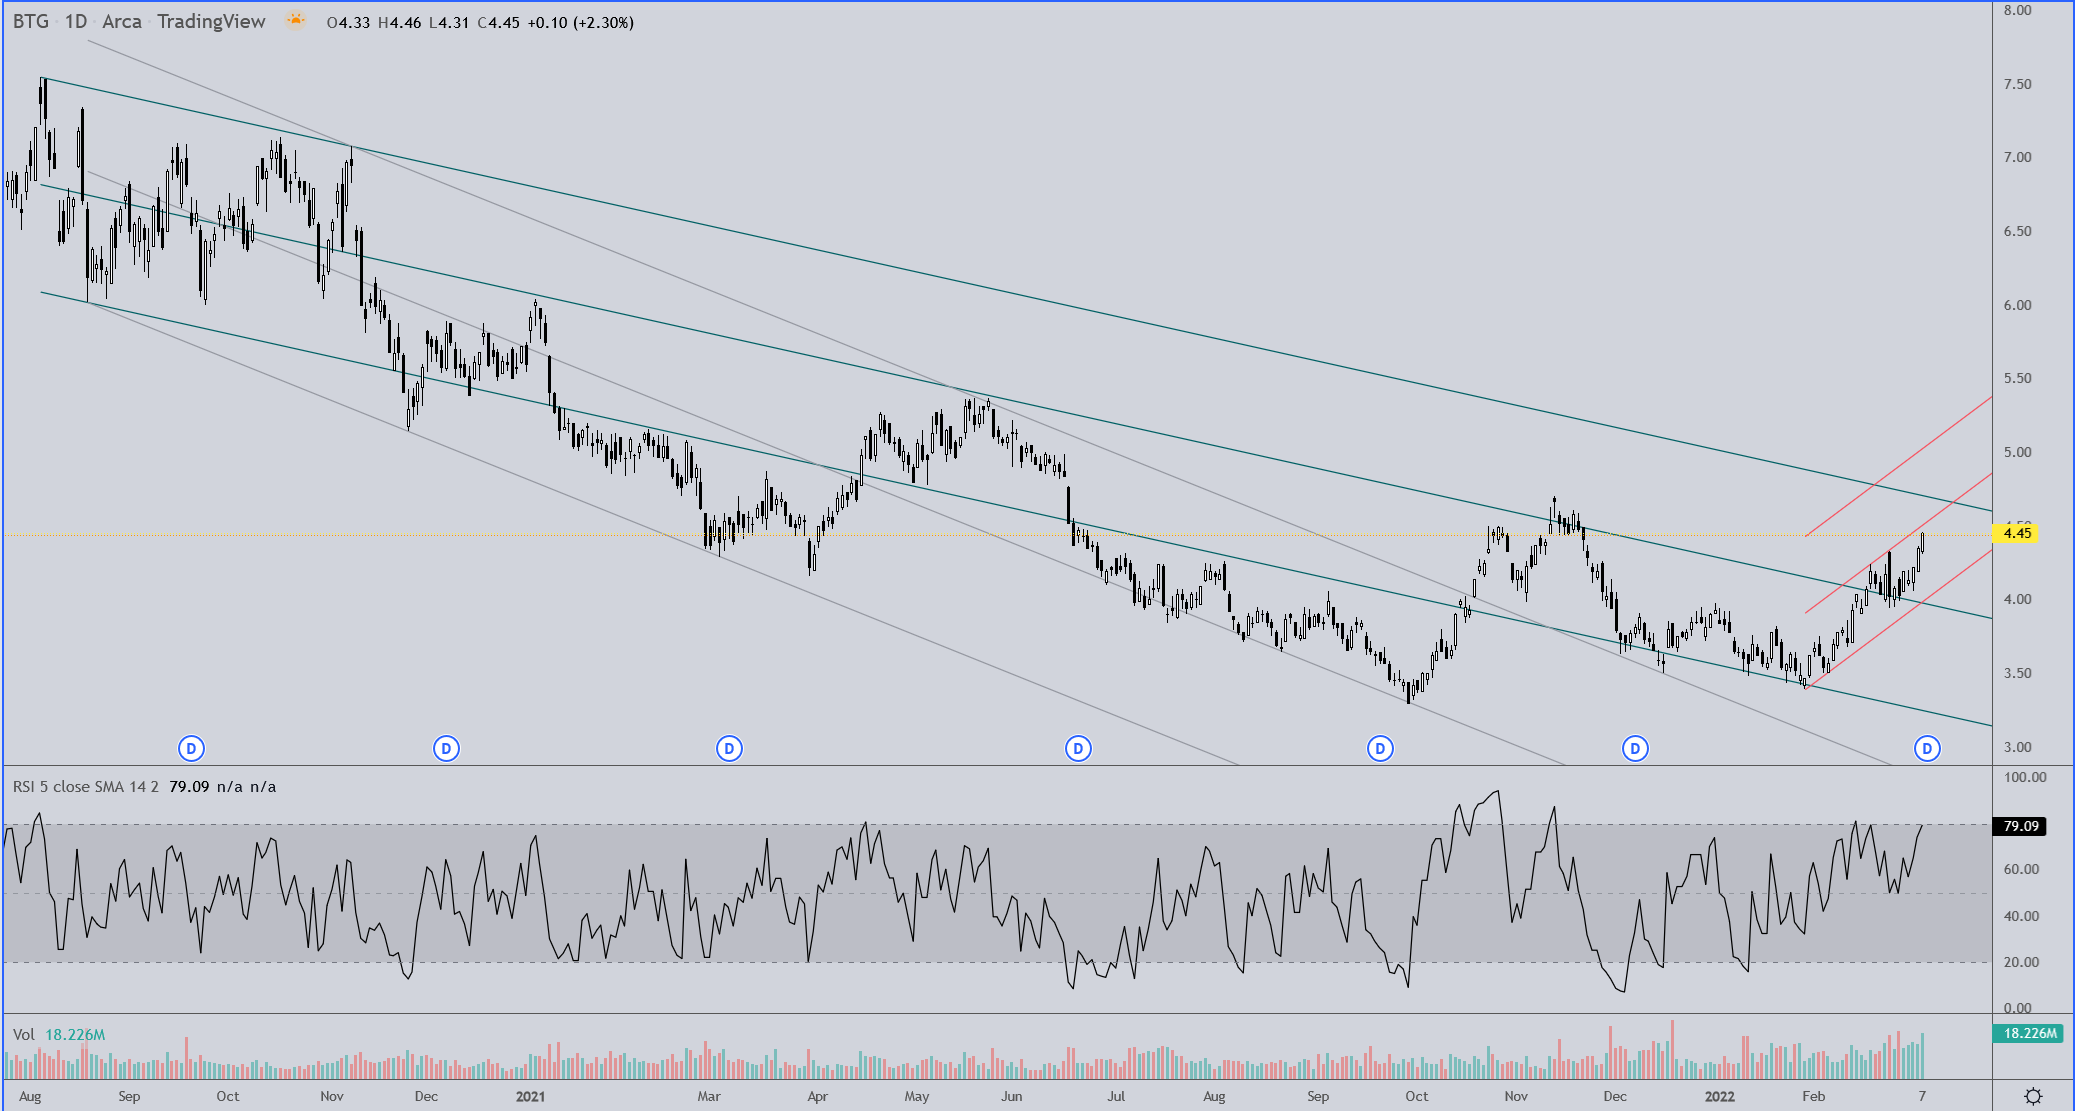
BTG Started out following the green channel then shifted to a more dramatic decline outlined by the grey channel. Both channels provided accurate S/R levels for some time, but now the stock appears to have abandoned the grey channel and moved back into the green. The red channel is speculative and has not yet proven itself.
The weekly chart shows a double bottom with increasing volume throughout the formation. Moving up into some potential resistance areas indicated on the chart. The pink horizontal line as always indicates where a gap will be filled when price hits that level. The gap is on the daily chart and not visible on this weekly interval.
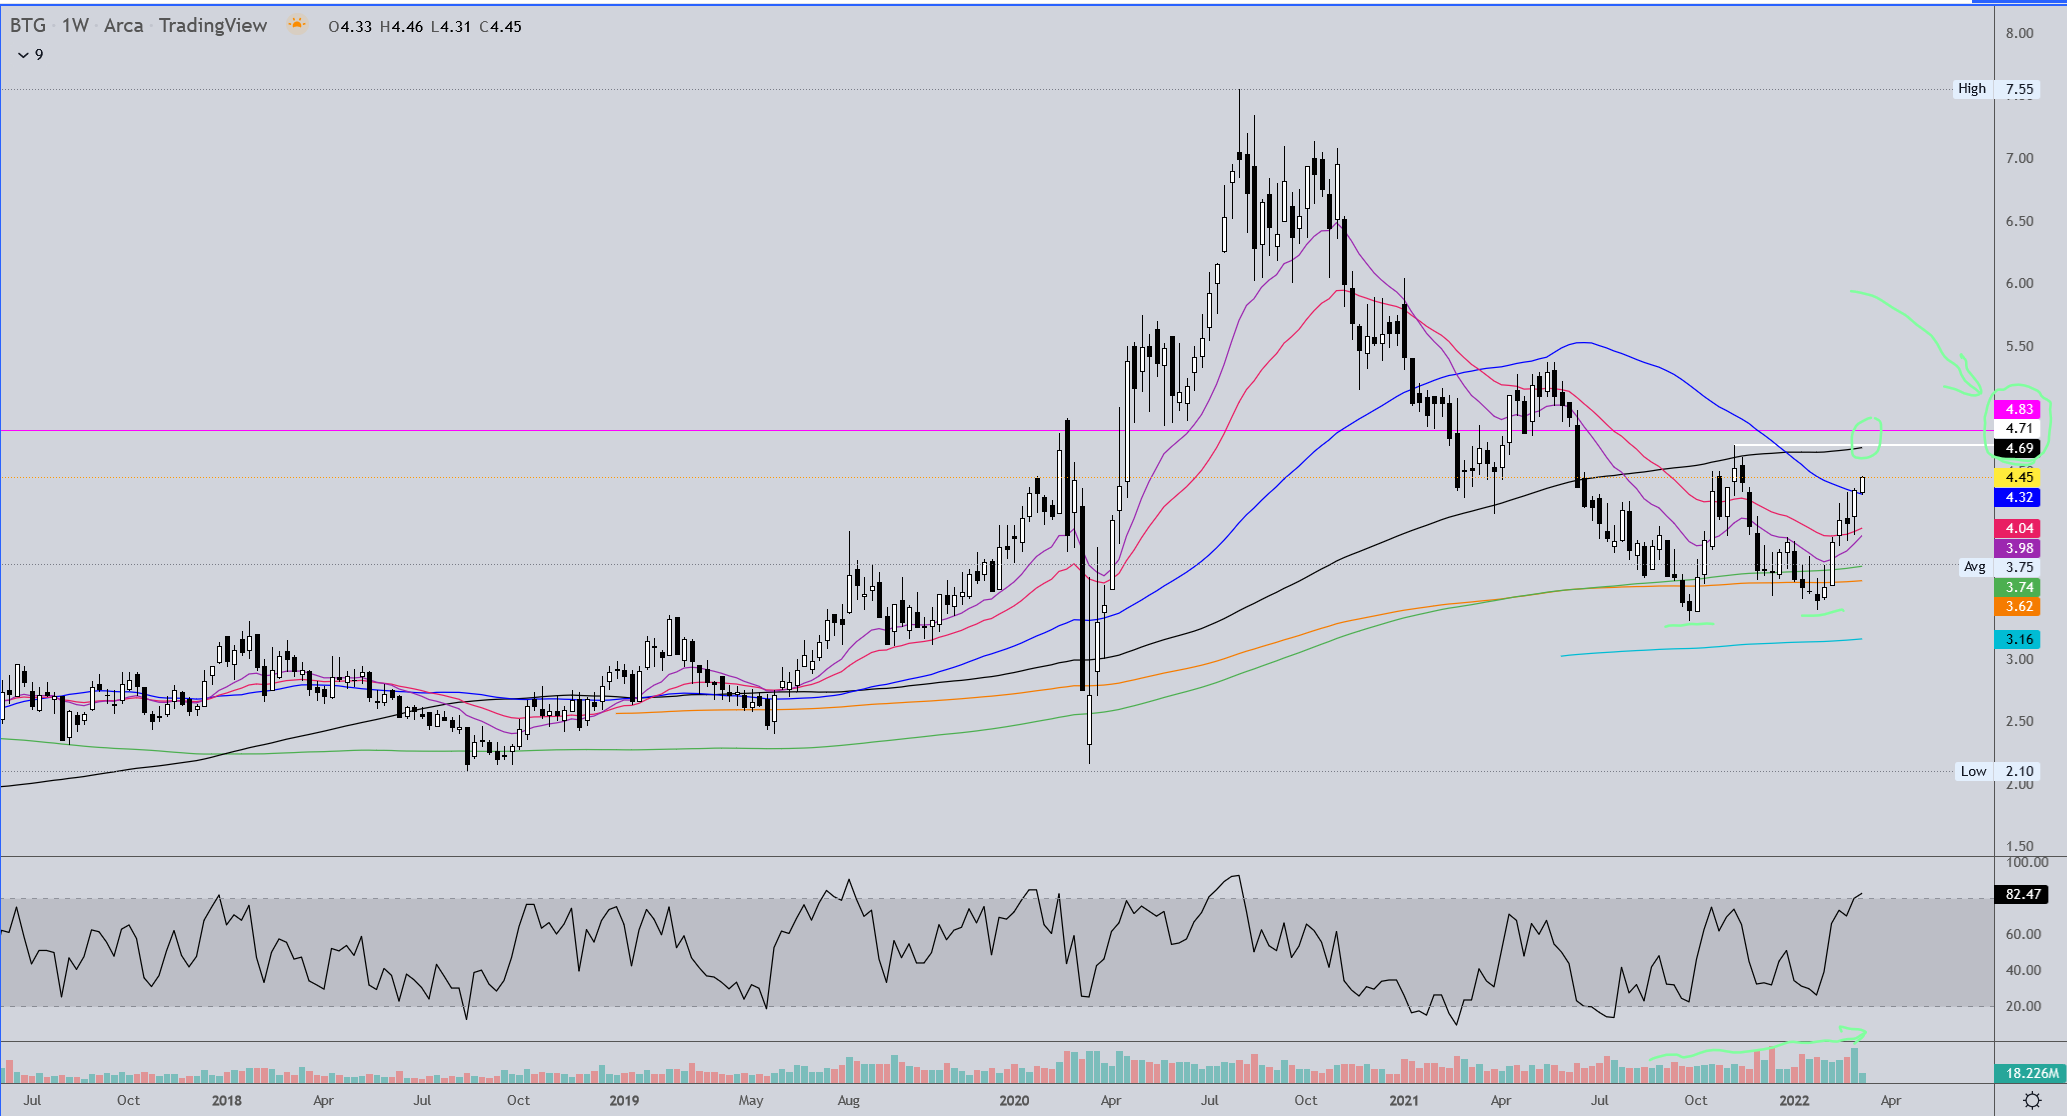
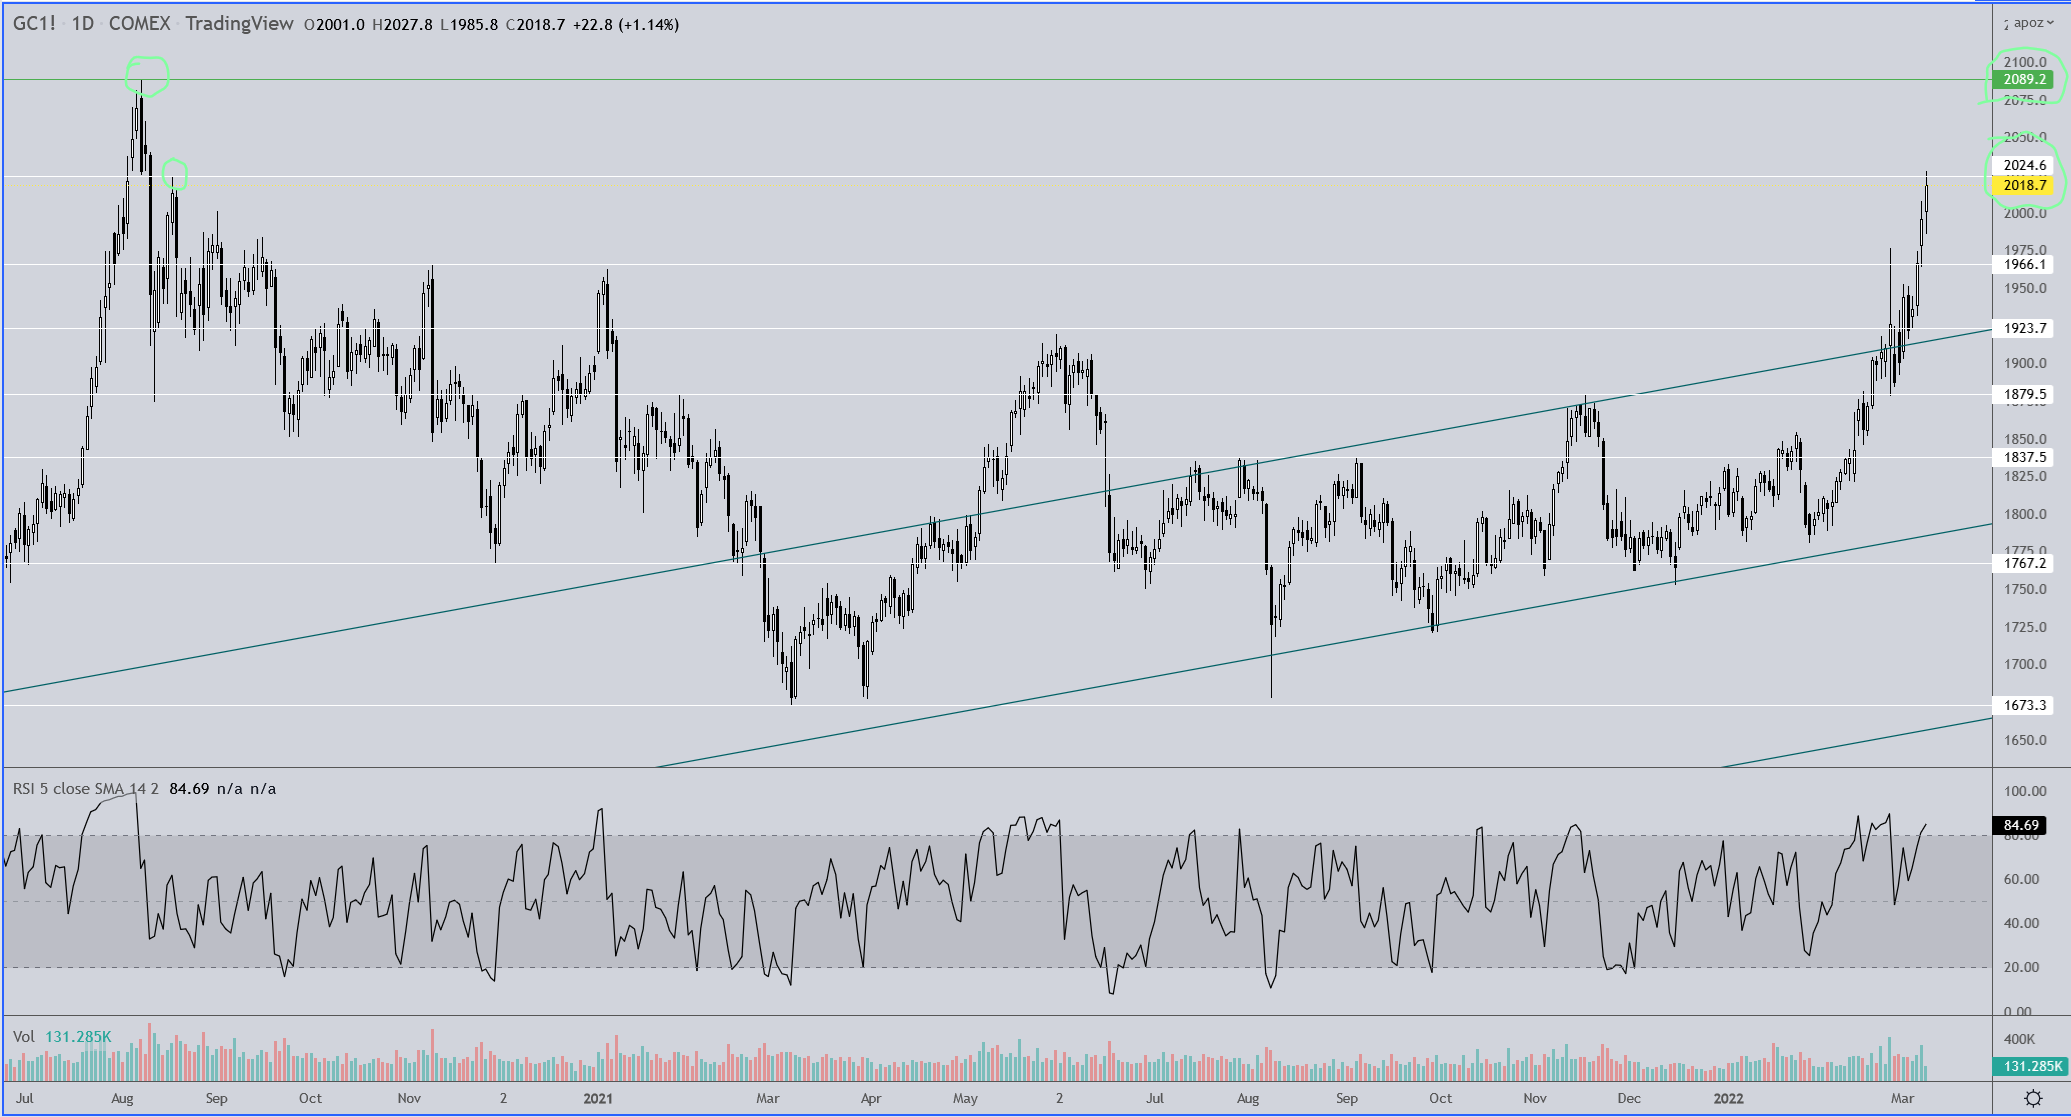
Gold hit and briefly exceeded its last (weak) resistance level at 2024.60. Next up is the all time high at 2089.20.
2 Likes
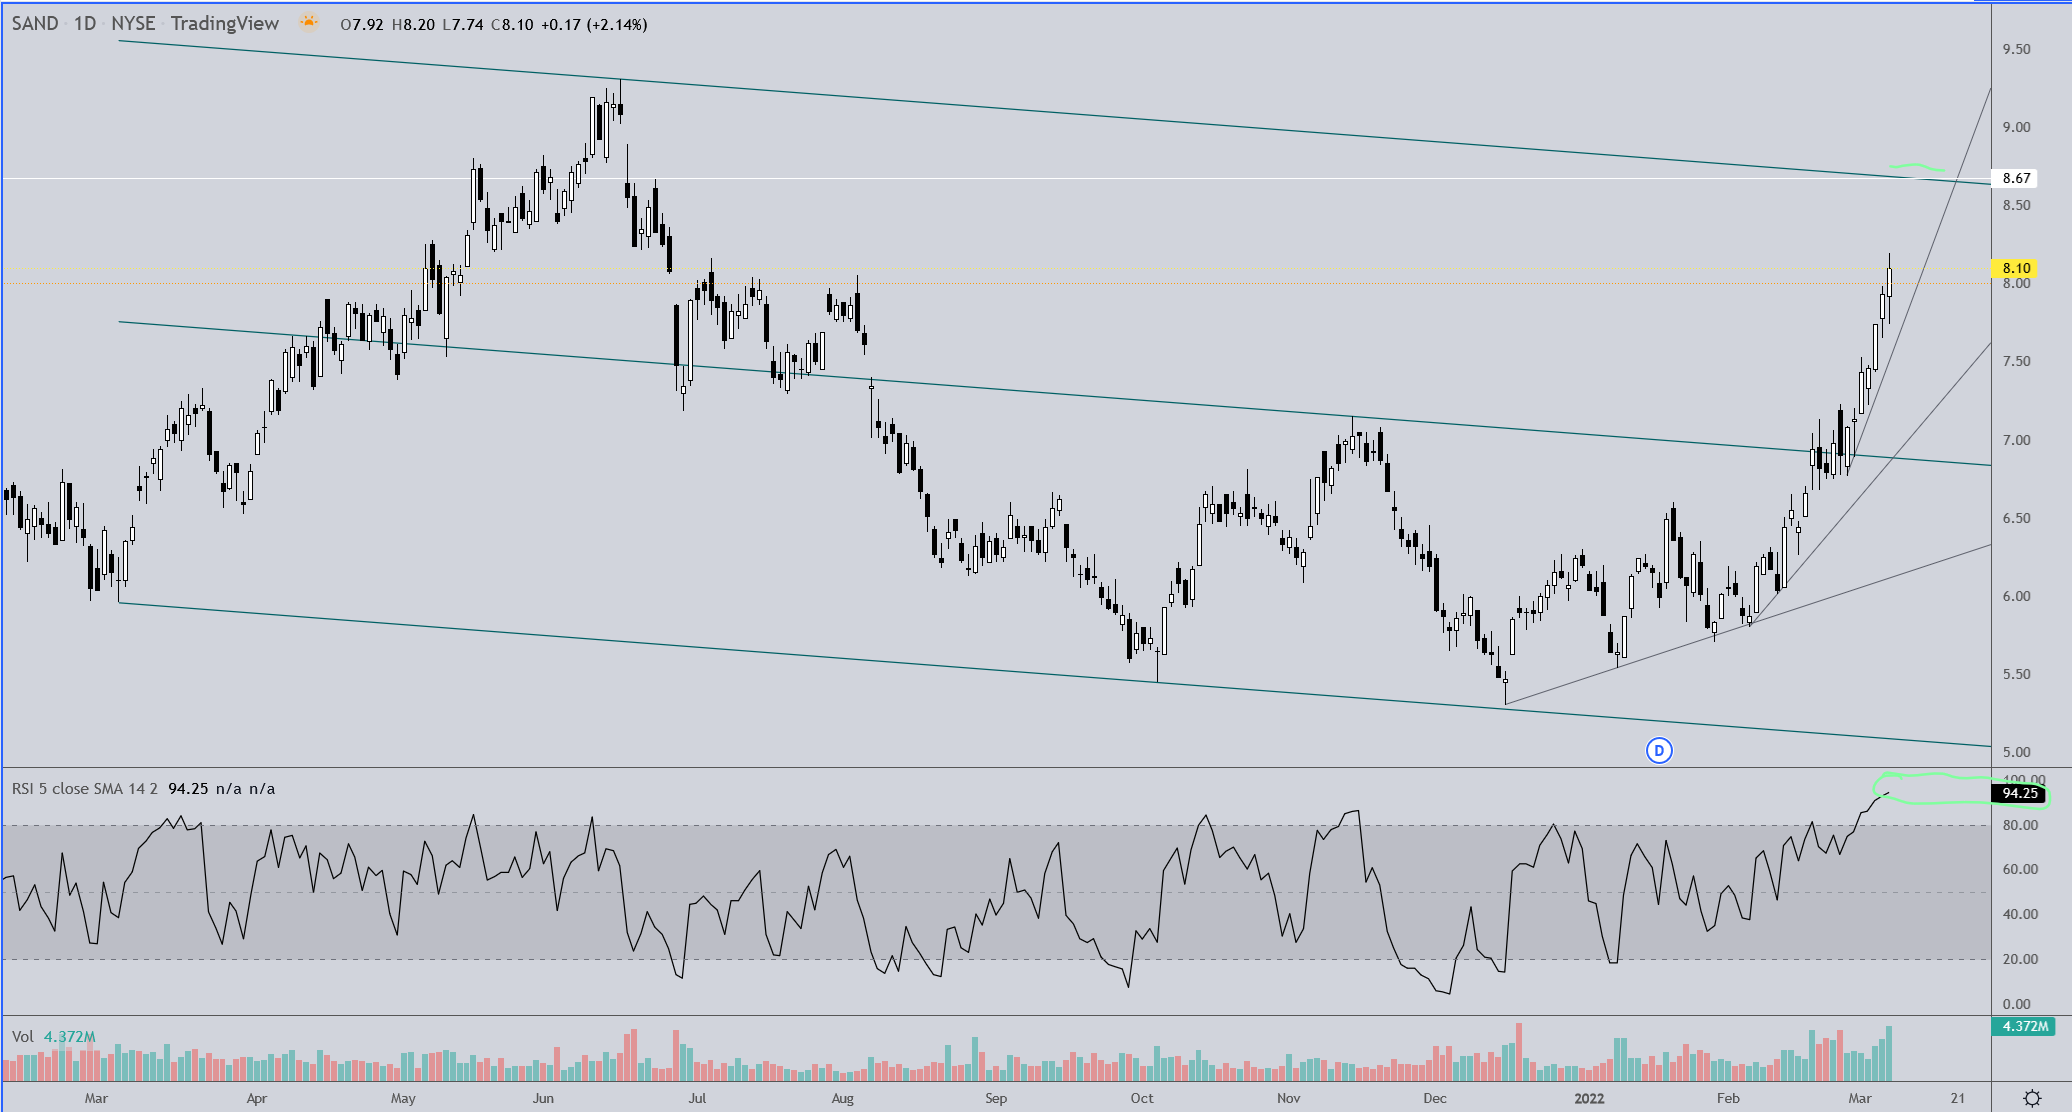
SAND
This parabolic move might hit a wall at the top of the channel on this chart. A number of trend line support areas await below.
Overhead resistance also in the 8.60’s and a gap fill at 9.02.
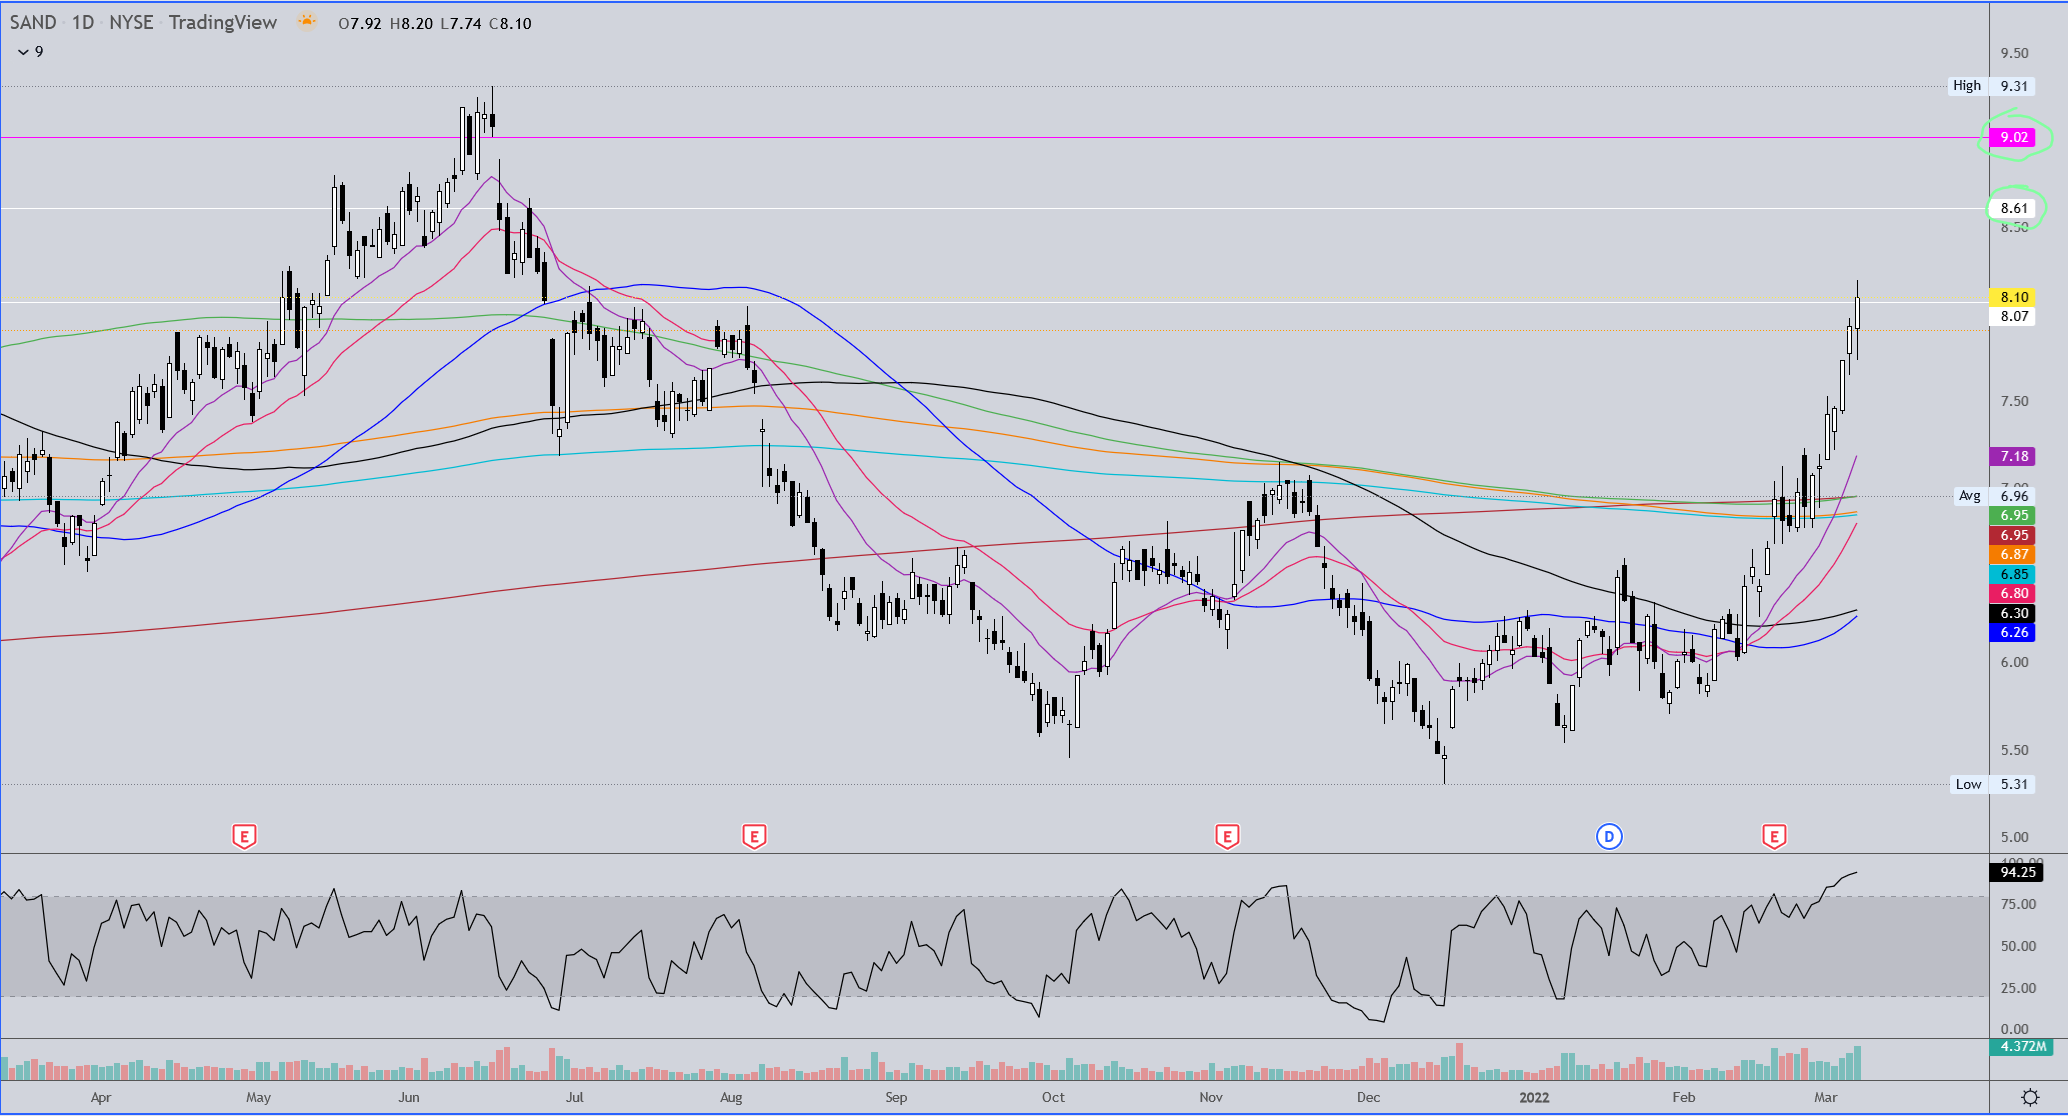
Watch the shorter MA’s for support as well.
Reminder for Karora
Monday, March 14, 2022
10:00am - 11:00am EDT
Stay tuned!
![]()
(Events | Karora Resources)
BRC/BKRRF
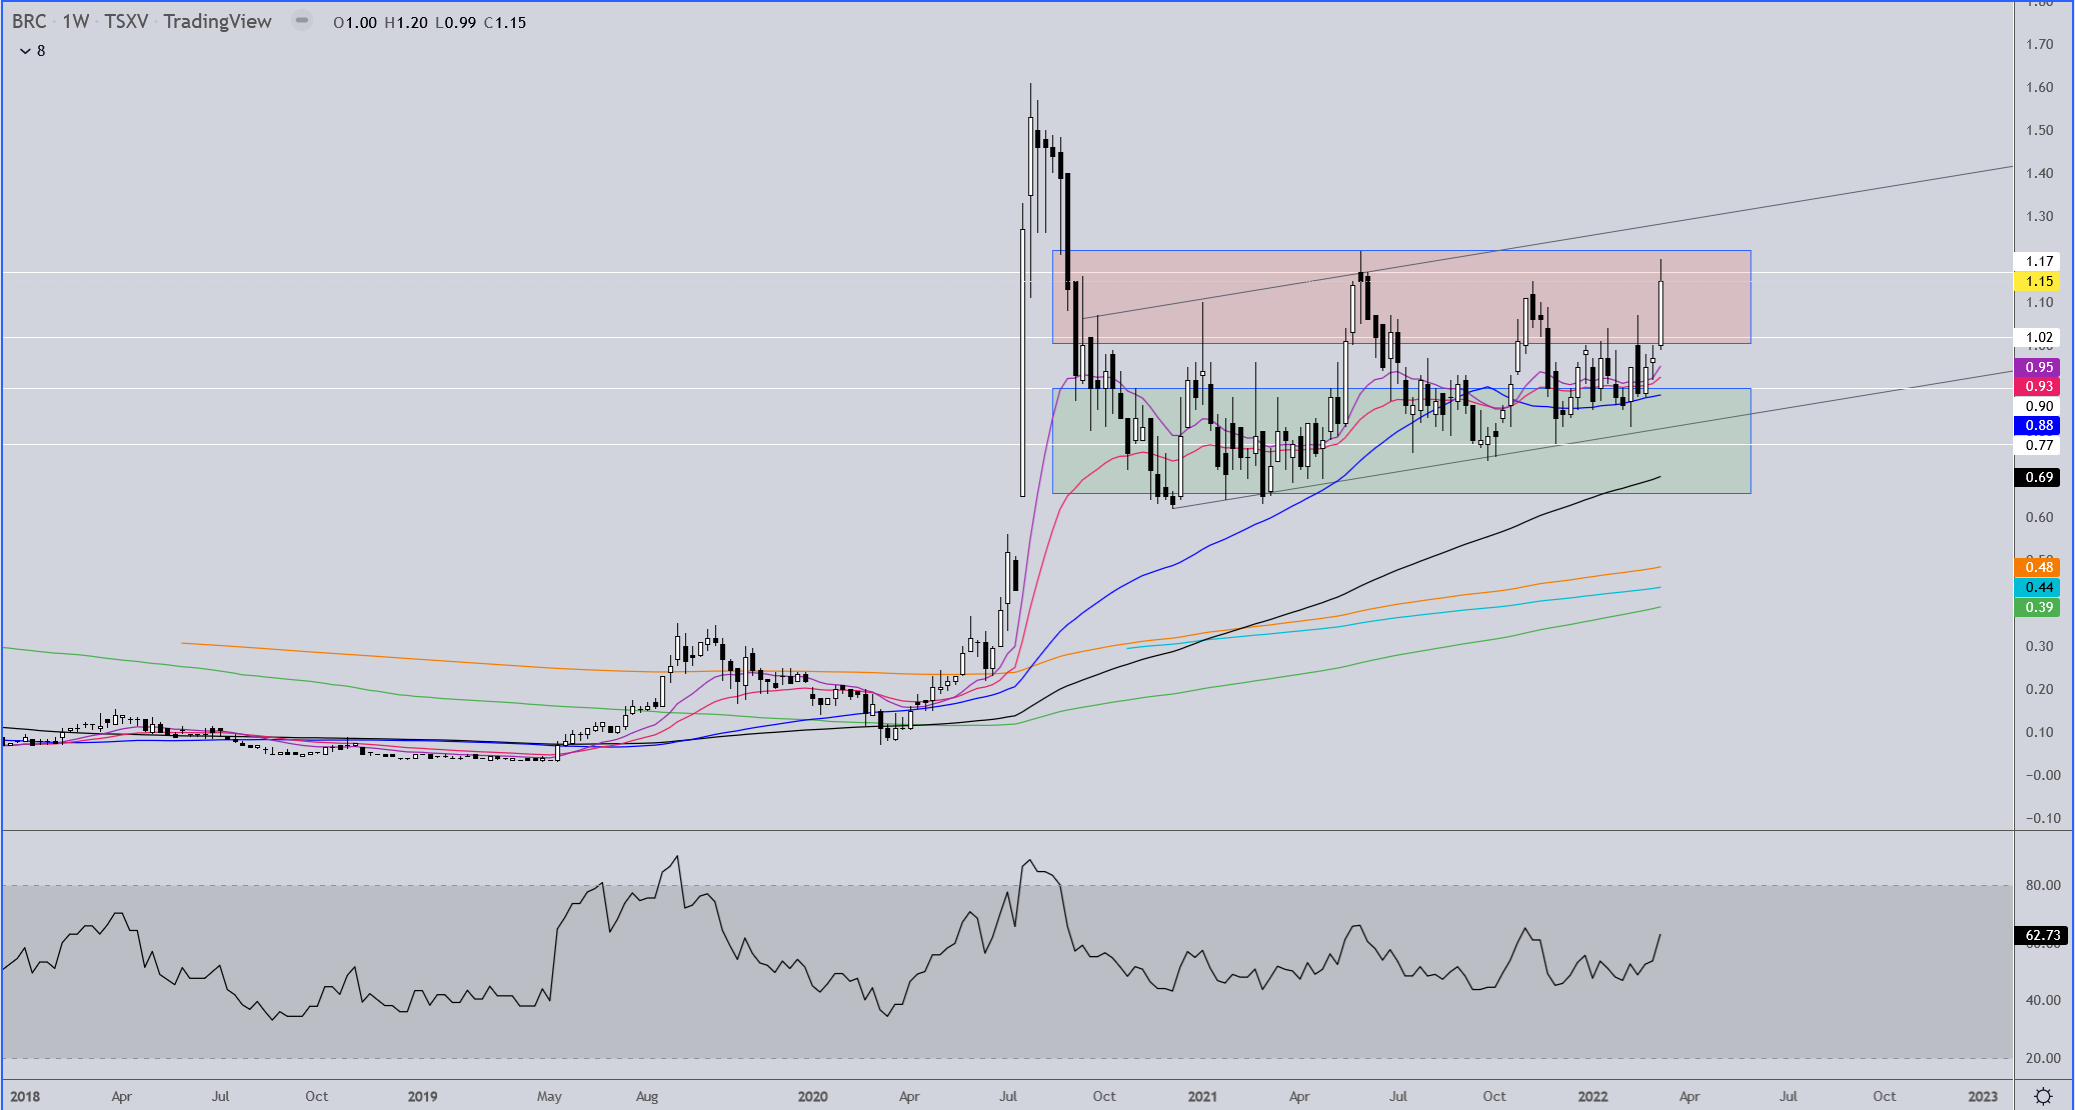
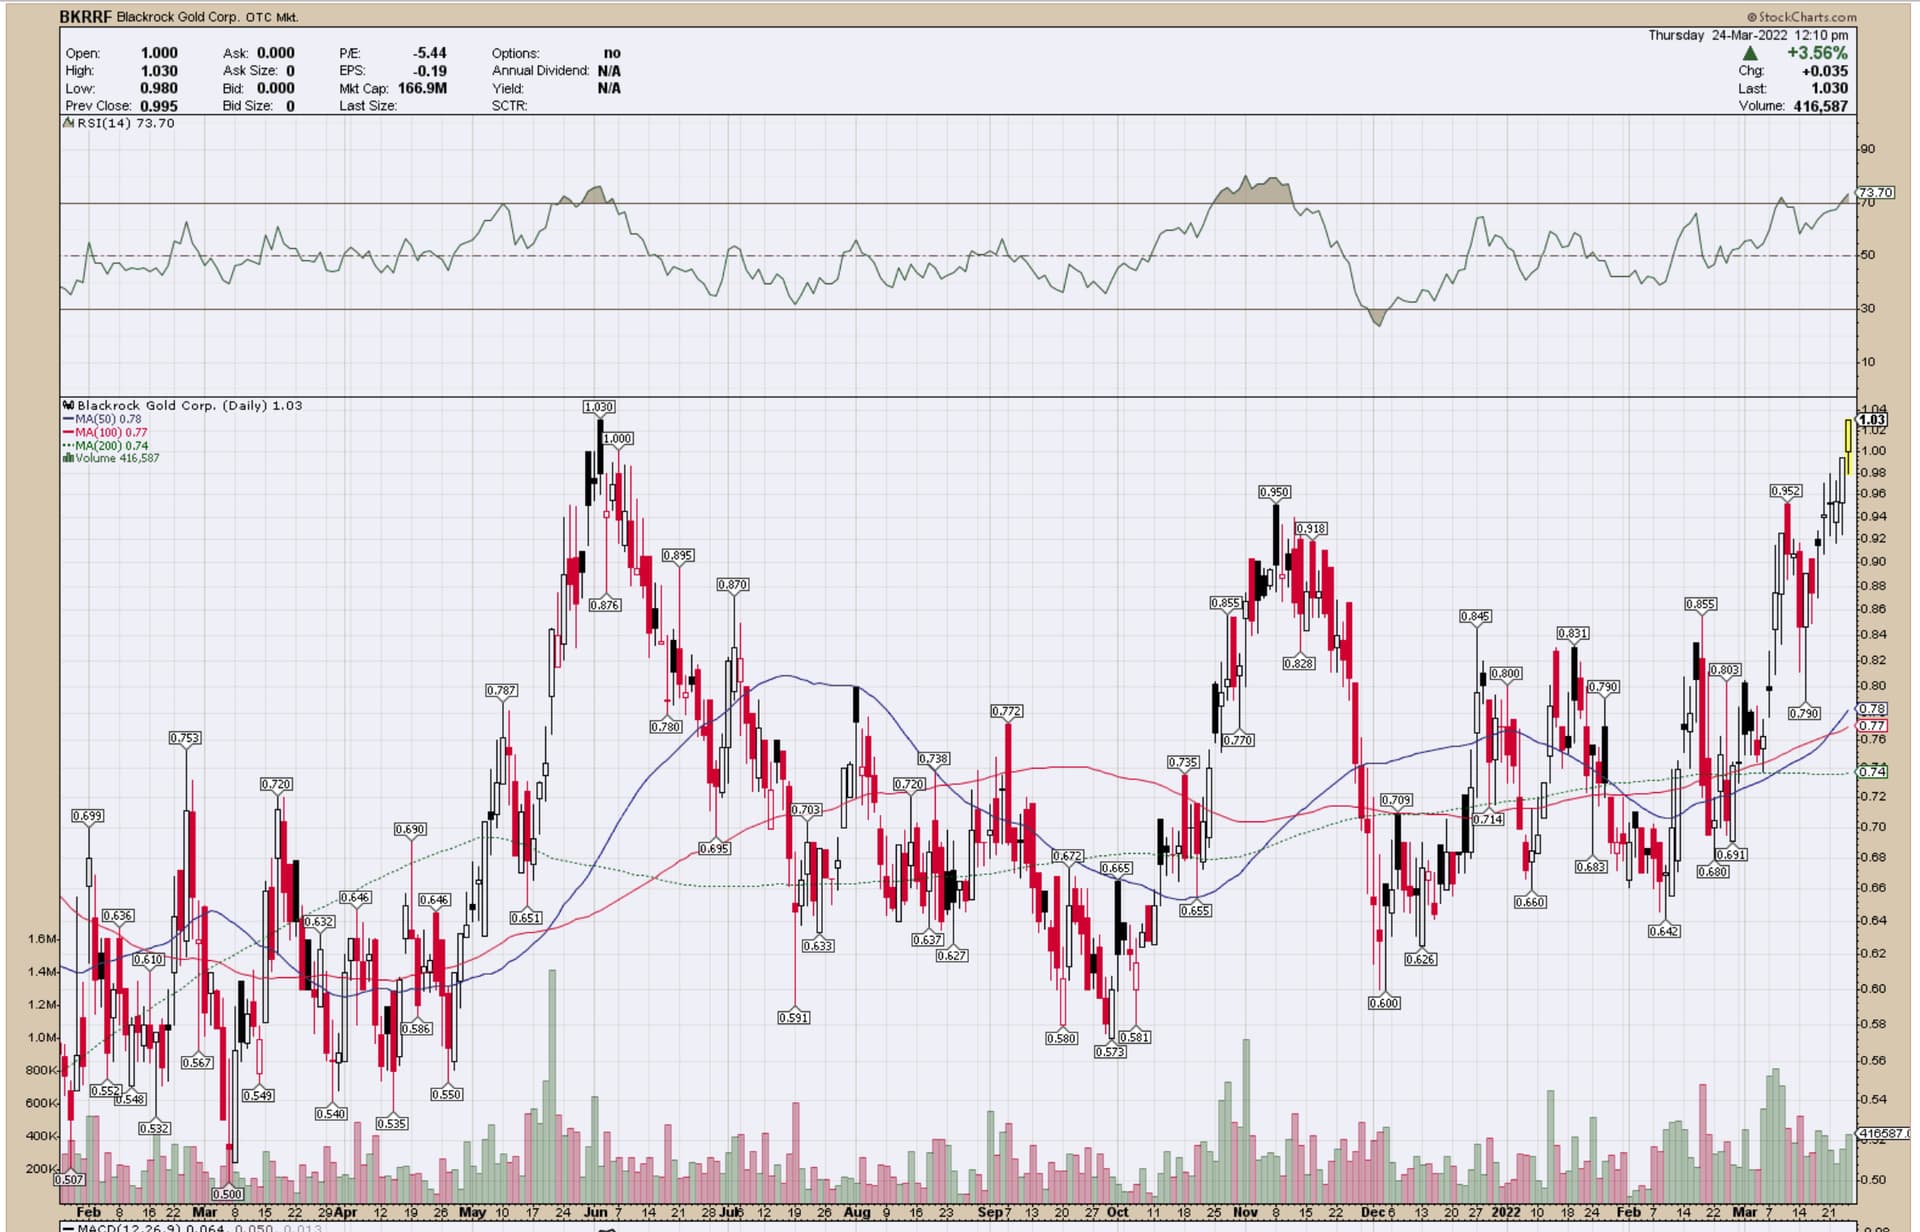
I have successfully traded this one on three different occasions. The weekly chart shows it has been consolidating between the mid .60’s to around 1.20 for about a year. Due to the slight uptrend the low price to buy now is in the mid/upper .70’s. The upper trend line is at 1.30 and could be resistance if tomorrow should see this move higher.
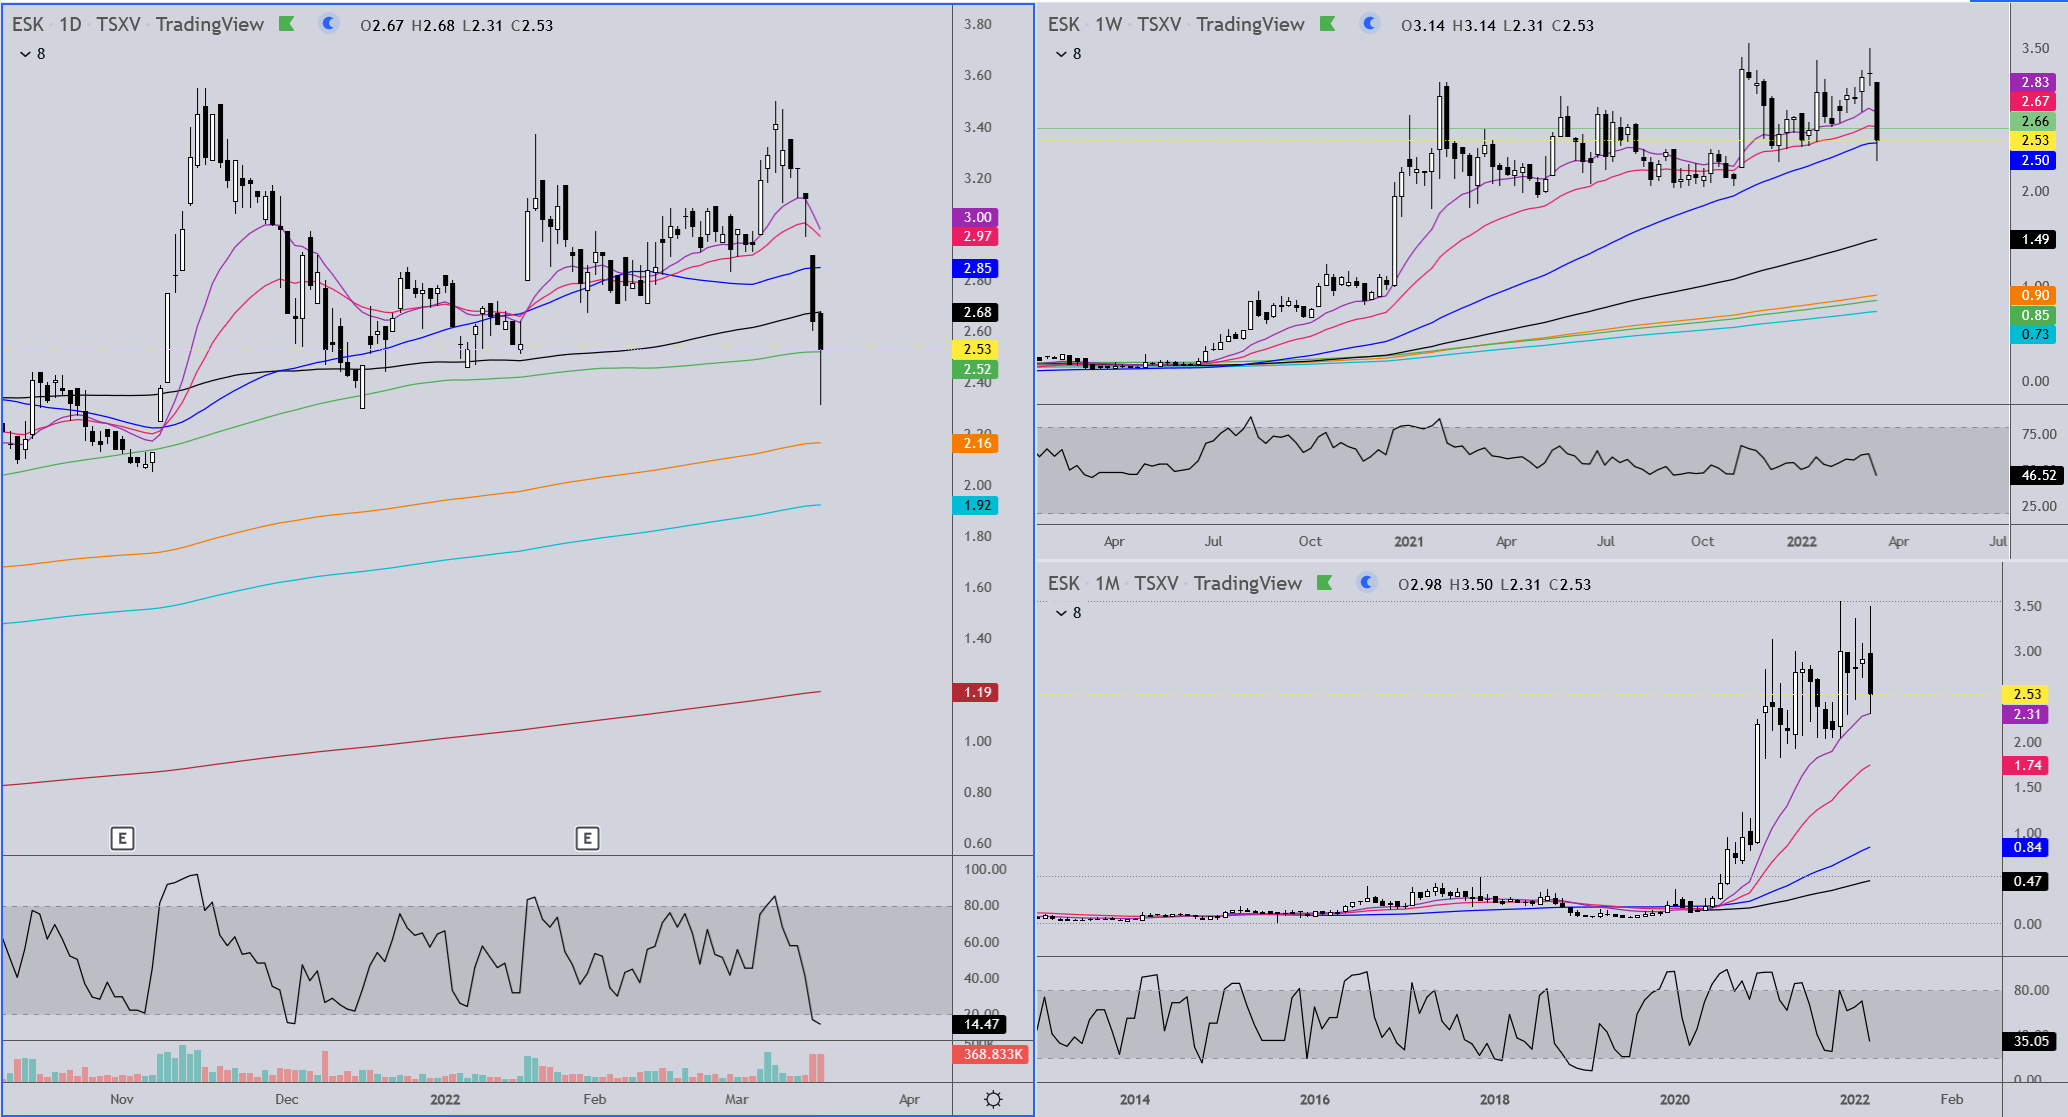
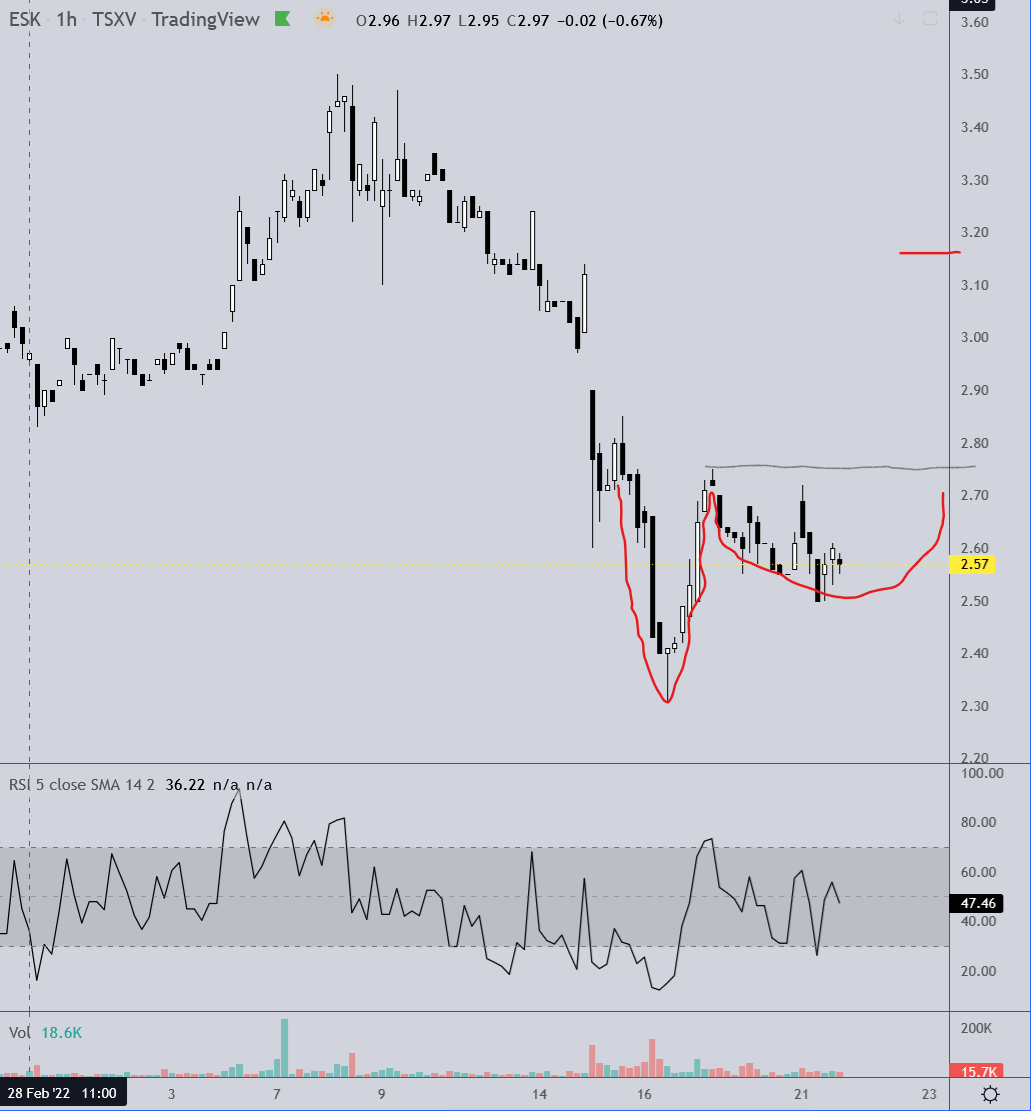
Hope some of you were around to BTD on ESK today. I did rather well buying the MA supports. Love seeing price back above each of them by the close. ![]()
1 Like
A little off topic, but just wondering where the dollar will be in the IMF basket of currencies on August 1 this year if this rebalance is made as scheduled. This is different from the BCBS’s delay of implementing the revised Basel III standards by one year, to 1 January 2023. Bisel III & IBS bank requirements are expected to reduce the paper trading markets in gold and silver, making physical gold a tier one asset for Banks. As currencies start to collapse from inflation, it is expected this will drive the price of gold and silver much higher, and thus the mining sector of these metals. Both these policy changes are likely to have a very noticeable effect increasing commodity prices, including the PMs and the valuation and speculation in mining. It is a primary consideration of my overweight positions in a number of the miners. I’m more interested in acquiring positions and building positions than short term trading, and so find longer interval charts of greater interest than the day to day fluctuations. I’m in for the longer haul, but not adverse to taking profits when charts indicate it is wise to do so. Comments on charts and trading strategies greatly appreciated as we learn from each other by improving our wealth based on taking advantage from each other’s trading strategies in specific stocks.
IMF Executive Board Approves Extension of Current SDR Valuation Basket Until July 31, 2022
March 15, 2021
Washington, DC: The Executive Board of the International Monetary Fund (IMF) approved [[1] ] Special Drawing Right (SDR) valuation basket by ten months from September 30, 2021 to July 31, 2022.
The proposal for the extension was put forward by IMF staff to the Executive Board in a paper published on March 15, 2021 (see Review of the Method of Valuation of the SDR – Proposed Extension of the Valuation of the SDR Basket and Modification of the Date of Effect of a New Basket ).
The IMF normally reviews the composition and valuation of the SDR basket every five years. [[2] ]The extension of the current basket effectively resets the five-yearly cycle of SDR valuation reviews, with the next review expected to be completed by mid-2022, and the new SDR valuation basket becoming effective on August 1, 2022. Thereafter, five-yearly revisions of the SDR basket would be taking effect on August 1.
The ten-month extension contributes to the Fund’s ongoing efforts to prioritize work during the COVID-19 crisis and allows for a more suitable effectiveness date of a new basket, which does not coincide with some major markets being closed. The approved extension of the current basket, as well as effectiveness date of a new basket, is intended to facilitate the continued smooth functioning of SDR-related operations.
(https://www.imf.org/en/News/Articles/2021/03/15/pr2168-imf-executive-board-approves-extension-of-current-sdr-valuation-basket-until-july-31-2022)
Just trying my hand at some charting.
Keeping an eye on BTG to move to 5.15:
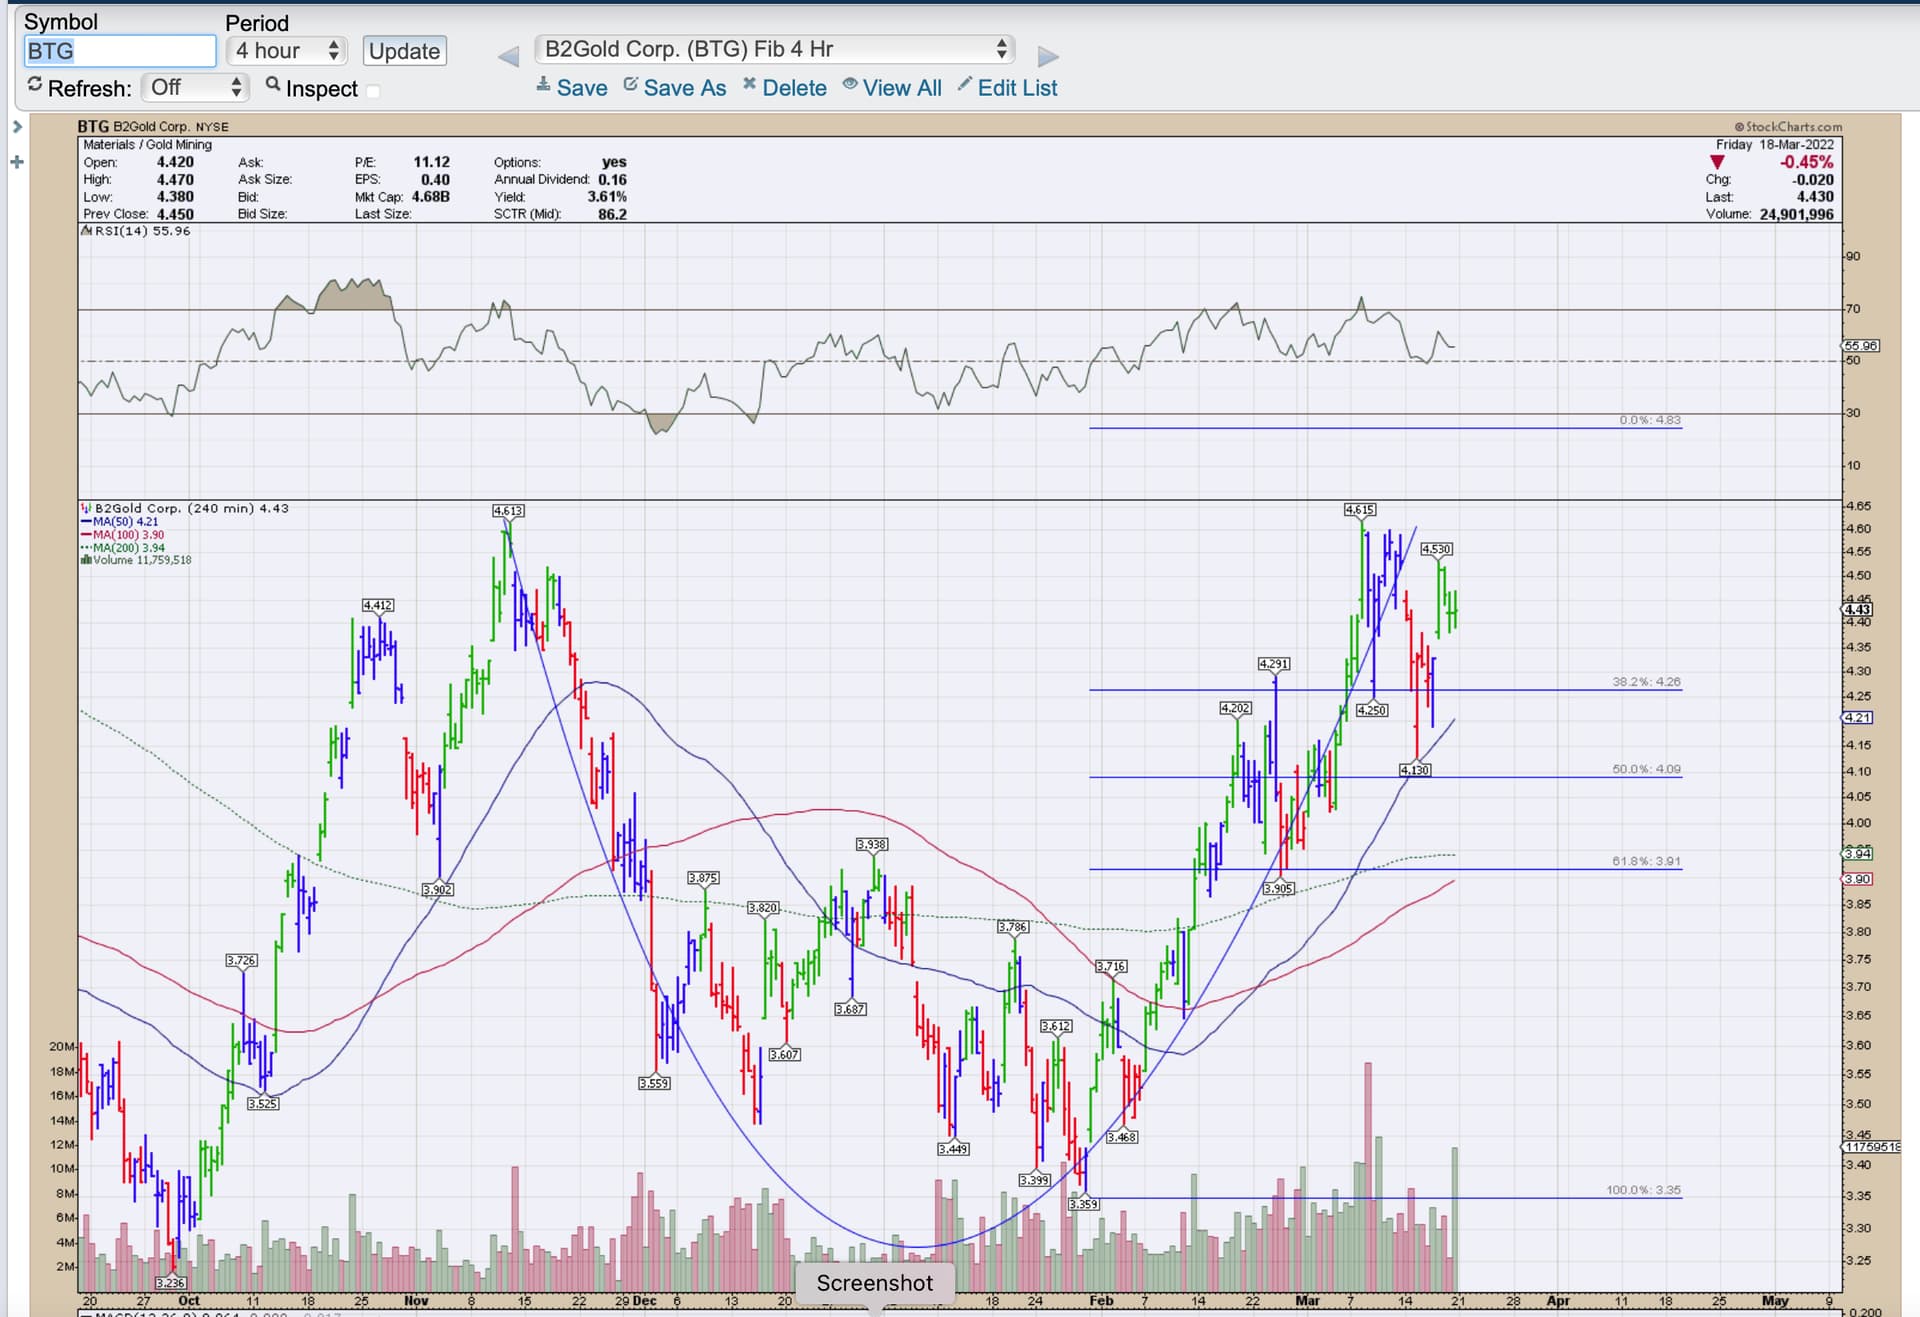
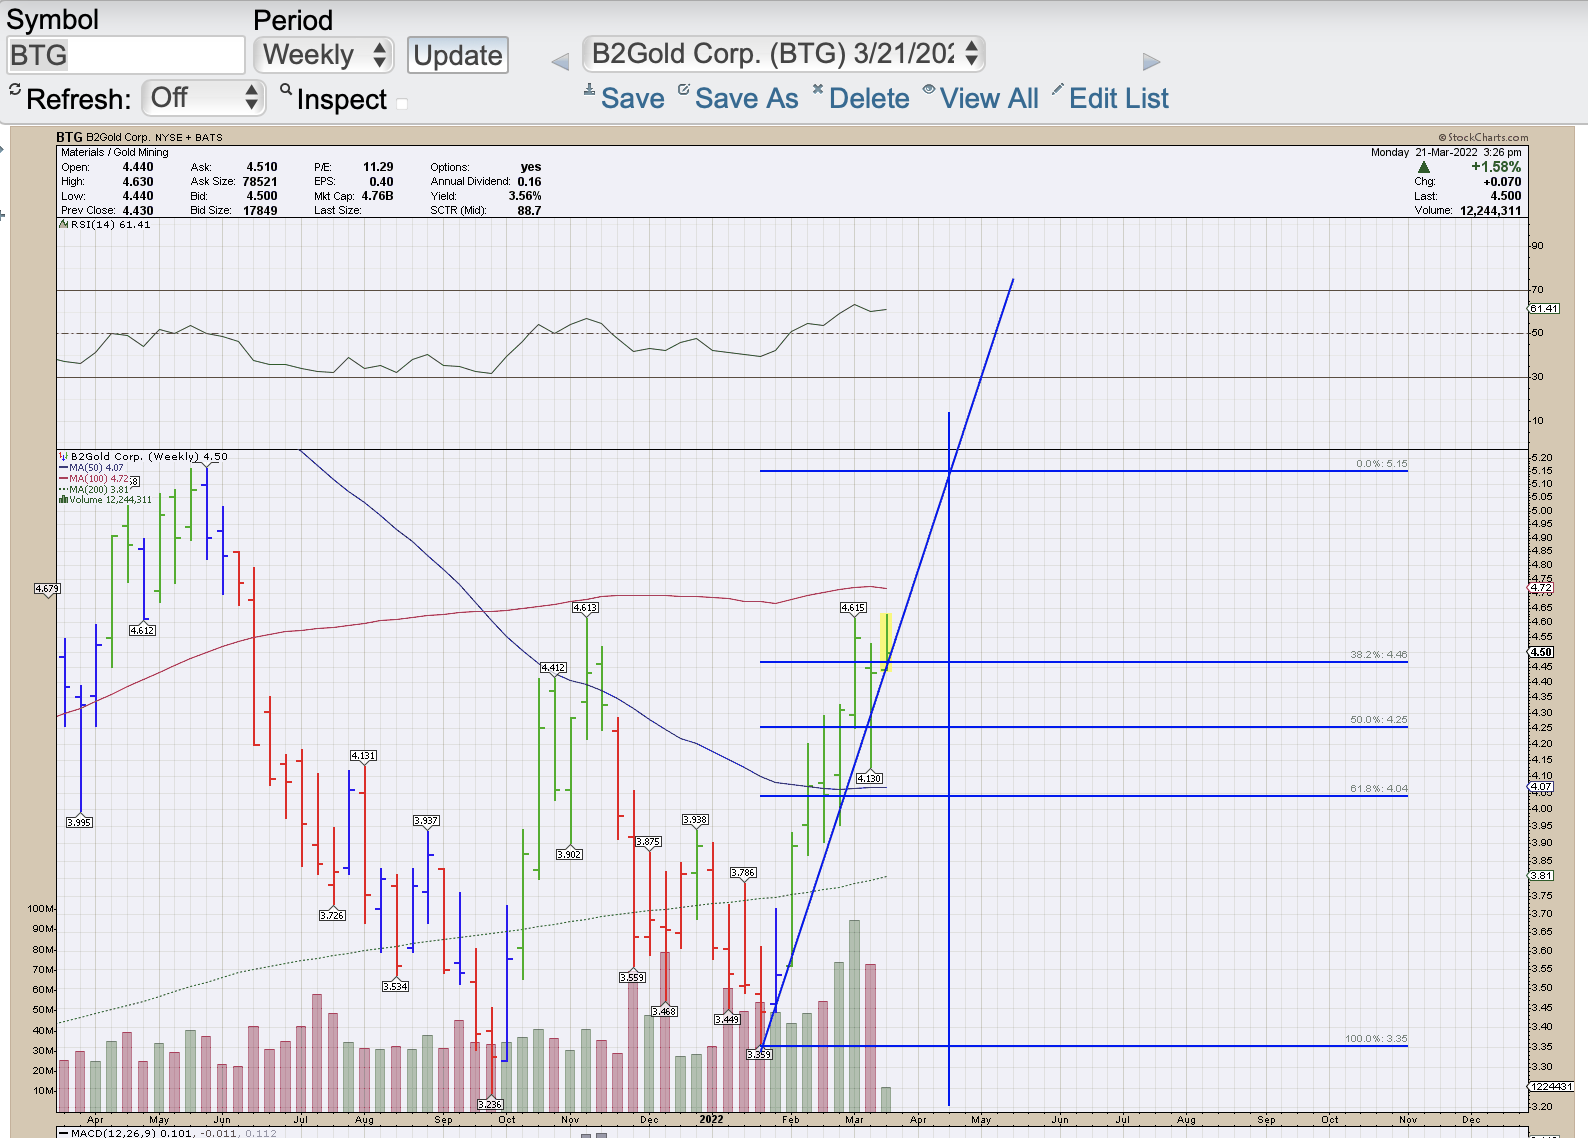
If this works out, B2Gold may go to 5.15 by mid- April, or could retrace to 38.2% or 50% level (4.46 or 4.25) before heading back up. A retrace to the 50 MA is also possible. Anyone else have a position here? BTG was on my accumulate list posted earlier in January. I have a modest starter position.
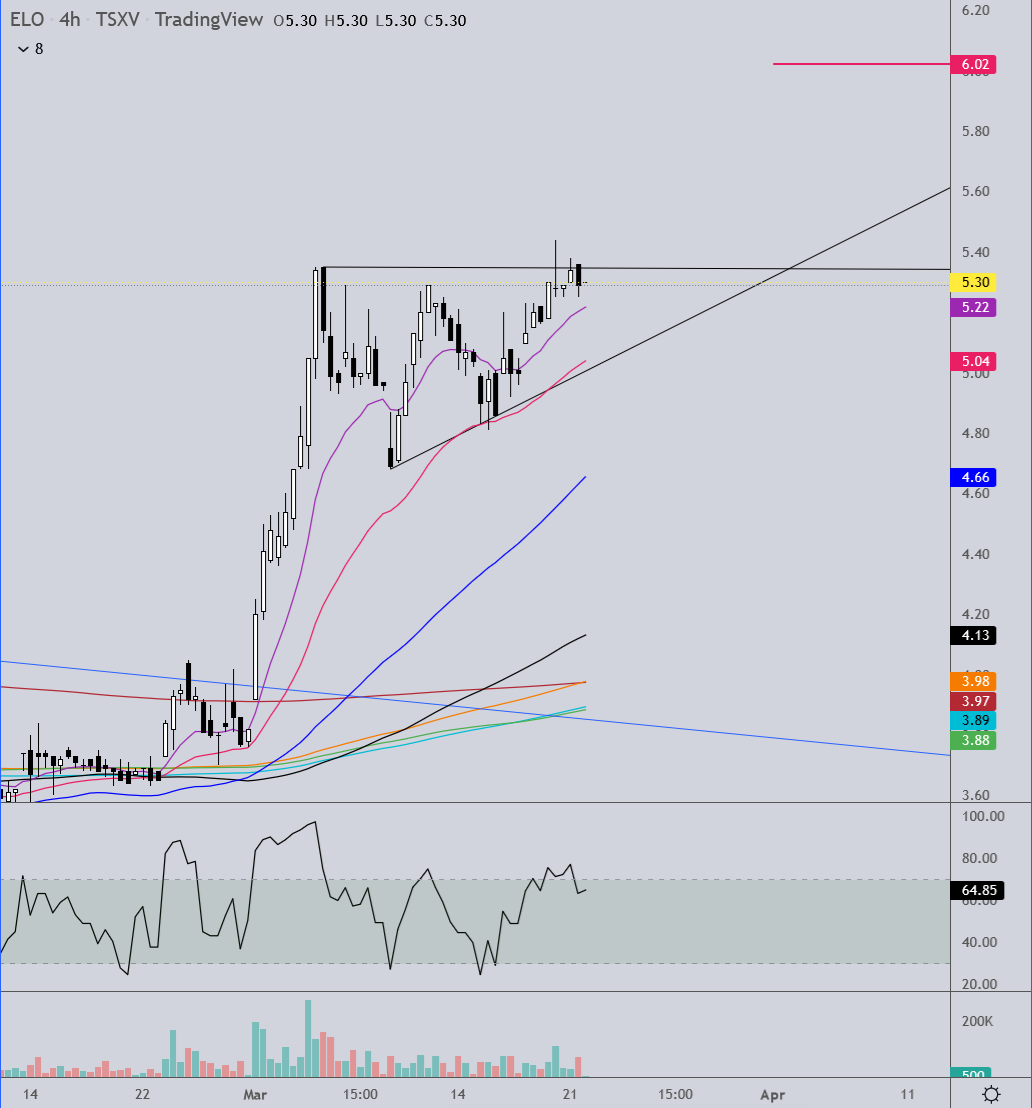
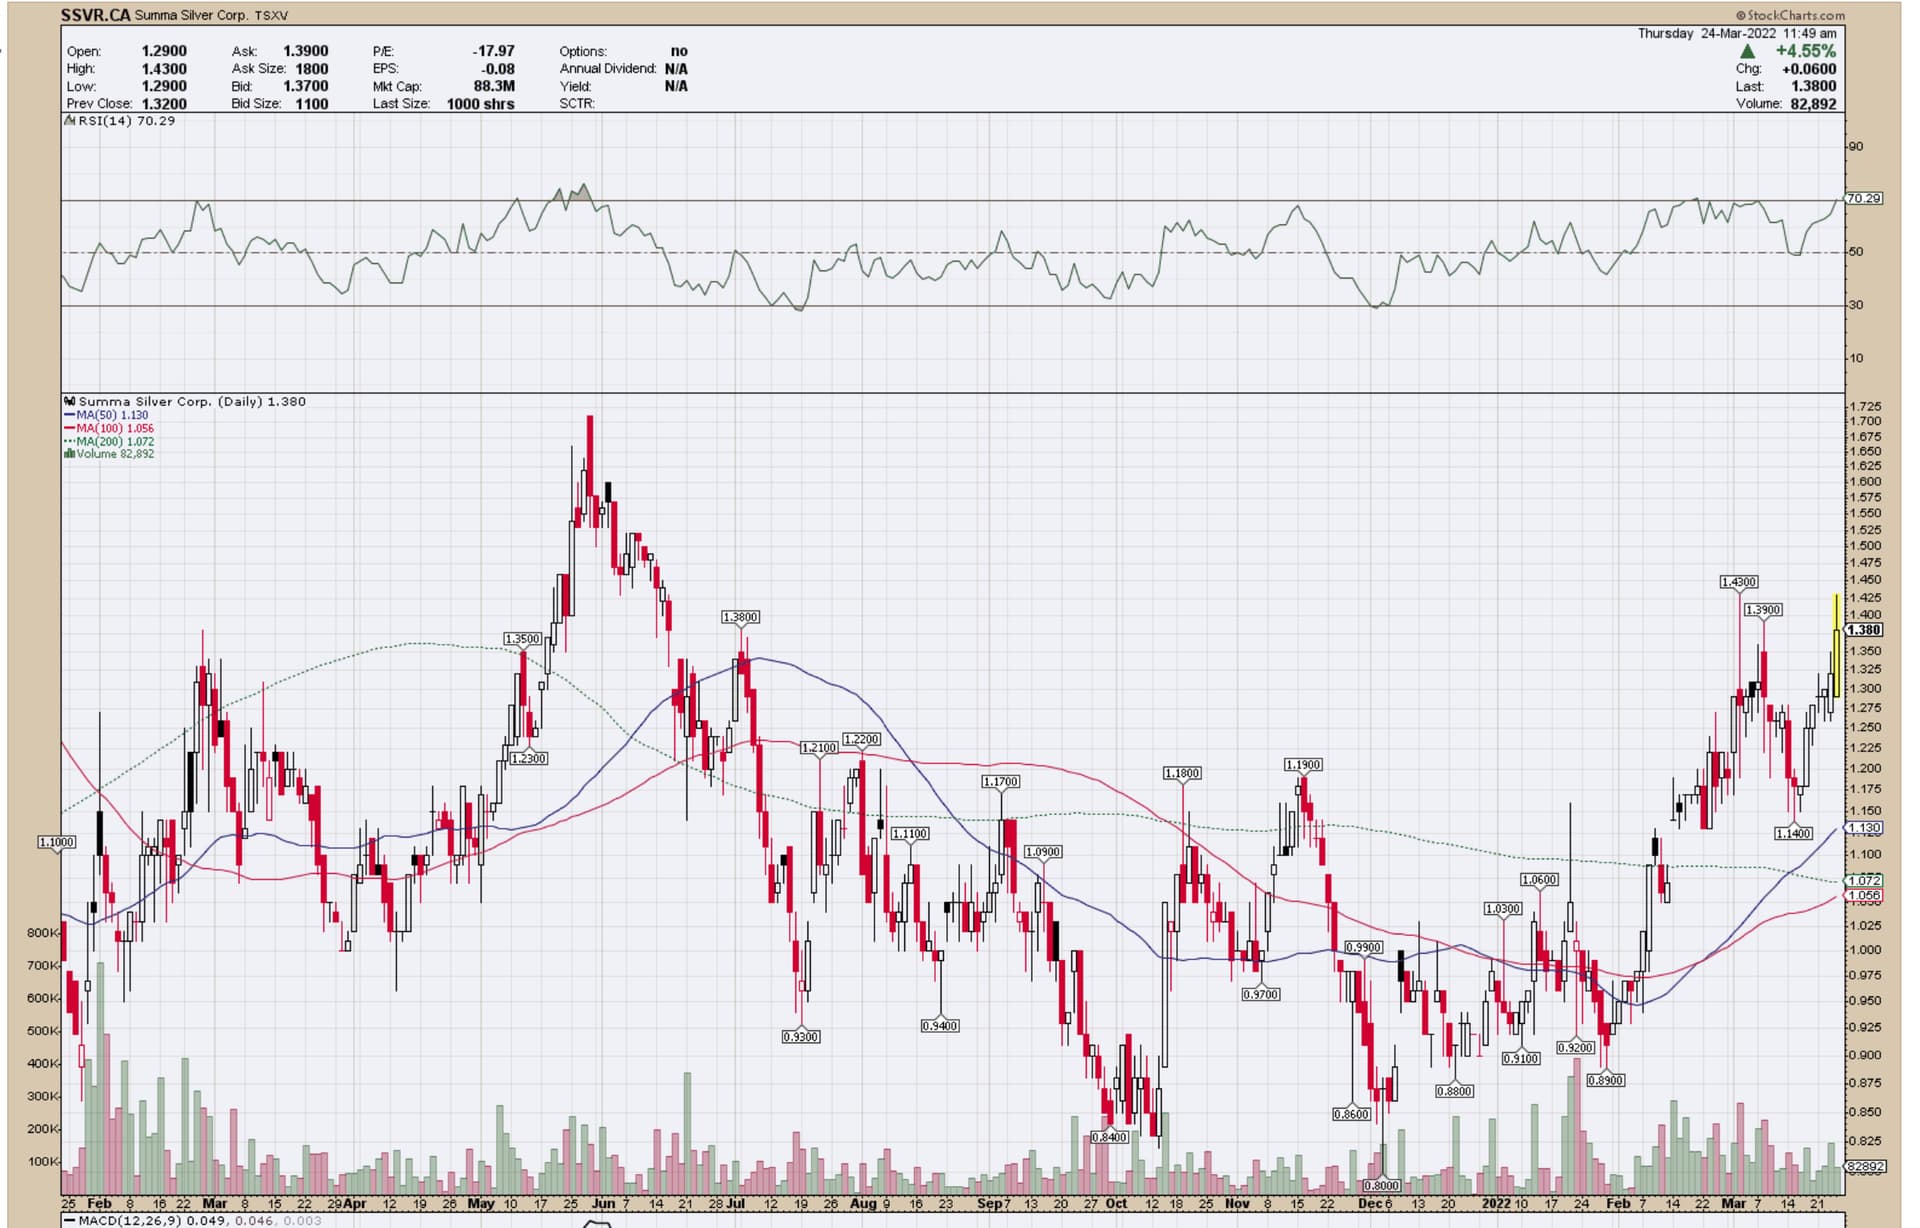
TR did a weekly chart on this one recently. Blackrock Silver is looking ready to break out. Also on my speculative list I had Summa Silver which was in the low 0.90s at the time.
They are some of my larger positions currently under accumulation. Drilling season should be very interesting. Both of these stocks are in the Tonopah Mining District of Nevada.
Watch how candle closes today.
1 Like
This is a weekly chart that I don’t have on my speculative list, primarily because it is an Australian issue (ASX:NMT) that has historically low volume until recently. I have a small position that I picked up in January of 2016. It is starting to look interesting.
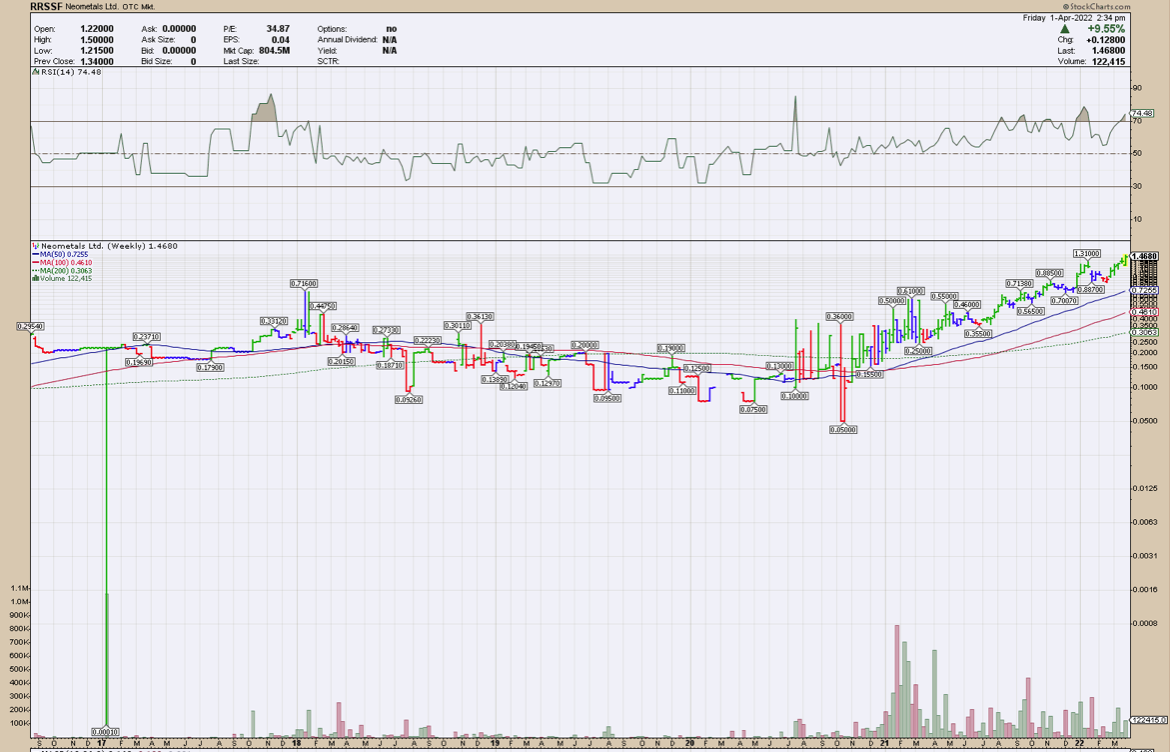
The company has a Vanadium/Titanium Project and a proprietary process joint venture for Lithium chloride solutions purifications. It is also has a proprietary process for recycling Lithium Batteries.
Here’s an informative 10 minute update on Gold/Silver/Dollar by Andy of Finding Value who I find to be very good…keeps it simple. He goes through a bunch of precious medals charts (including KRR). Lots of good ideas here and clearly a bull on precious metals.
Gold and Silver: Technical Analysis: LAUNCH COMING - YouTube
What’s your take on Novo after the update yesterday Rick?
Well, I was expecting the annual report to be underwhelming given the issues that were known in Q4. So in that regard it met my expectations I guess. The market has been punishing NVO for its low grade and other issues at Beaton’s Creek while ignoring everything else going on with the company and their assets such as NFG shareholdings, the mill at Nullagine and their vast property holdings. This has created a tremendous value at current levels (though I thought sub-$1.00 NSRPF was tremendous value). I am tempted to average down more here, though with the understanding that it might be dead money for a quarter or two.
However, there are also some catalysts to bump the price back up in the meantime. If the much anticipated (and overdue) bulk sampling ore sorting results come back with comparable (very positive) results as their Phase I, then that should mark the end of new lows and points to a very bright future going forward that erases any issues with low grade ore at Beatons Creek. There is also a ton of exploration news anticipated this quarter…too much for me to recount without going back to their news releases and videos. And of course, the price of gold will certainly help as well.
I’ll probably buy a little more next week at these levels (I have plenty). And then wait until after ore sorting results to determine my next moves with this one.
2 Likes
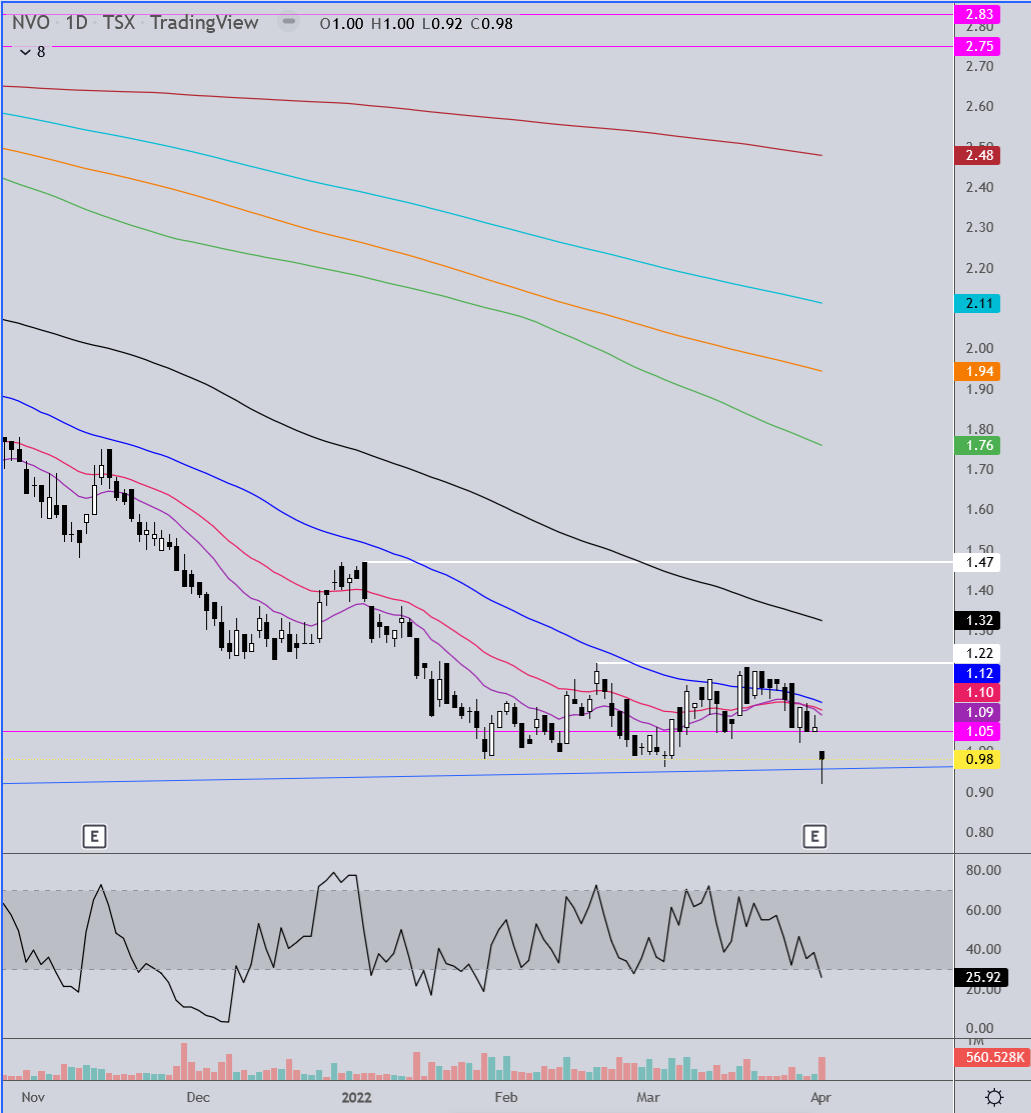
As far as the chart is concerned the news didn’t seem like that big a deal. Looks like a capitulation move so far. Breached the oldest/lowest trend line but got the close above with a nice candle on decent volume. Gap resistance now at 1.05 and then the usual MA’s above and 1.22 last swing high to eventually overcome.
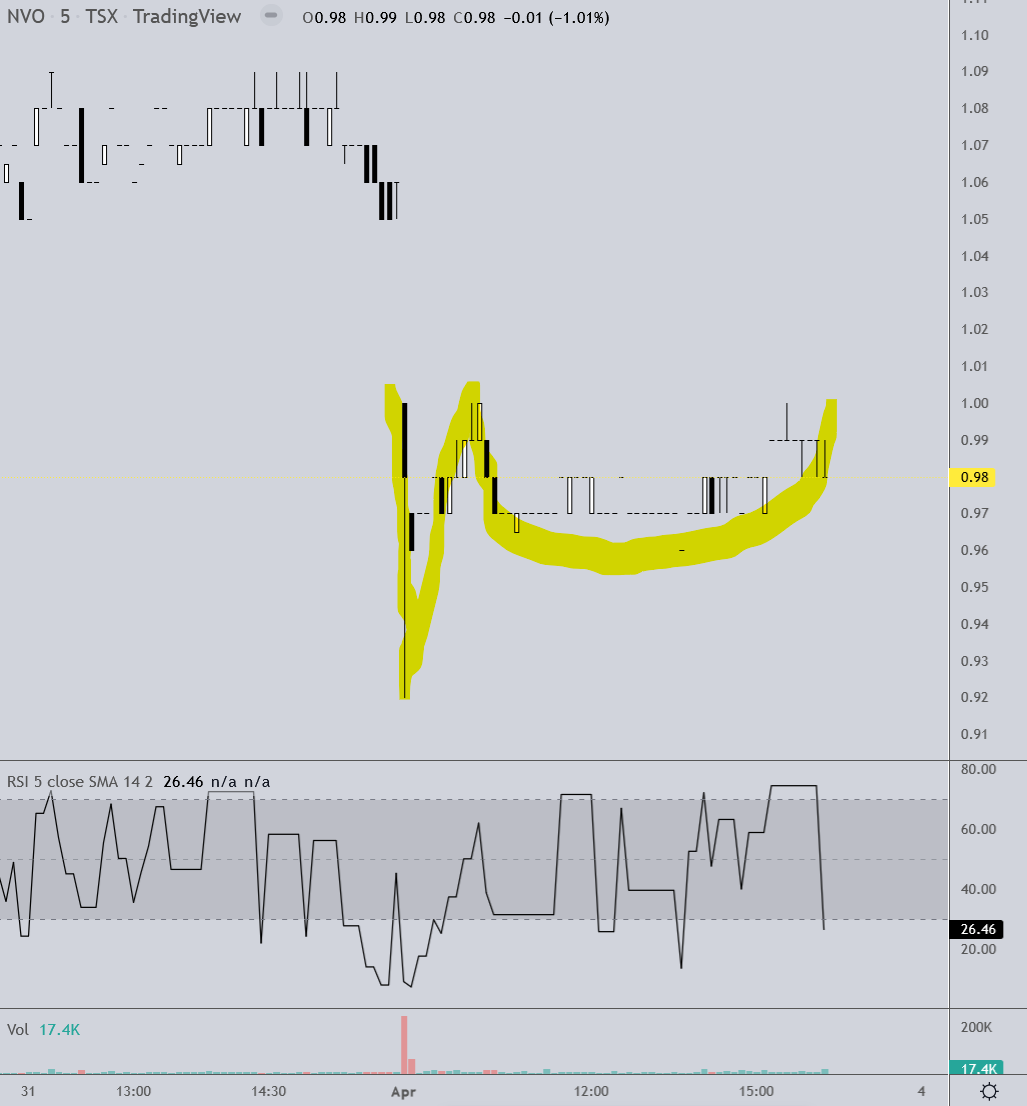
If this 5 min chart is accurate all of Friday’s trading made an Adam & Eve bottom and we could get a gap fill Monday. Perhaps that news was the exclamation point on the stock decline. Friday’s candle could be representative of one.
2 Likes
A little off topic again, but the dollars decline is unfortunately imminent. Considering the delayed IMF re-balance now scheduled to take effect July 31, and the BCBC delay of the revised Bisel III effective January 1 next year, the dollar is expected to weaken. Inflation will not resolve to desired levels for quite some time.
It is clear what this means for the Price of Gold!
“A Paradigm Shift Western Media Hasn’t Grasped Yet” - Russian Ruble Relaunched, Linked To Gold & Commodities
by Tyler Durden and Ronan Manly
By playing both sides of the equation, i.e. linking the ruble to gold and then linking energy payments to the ruble, the Bank of Russia and the Kremlin are fundamentally altering the entire working assumptions of the global trade system while accelerating change in the global monetary system. This wall of buyers in search of physical gold to pay for real commodities could certainly torpedo and blow up the paper gold markets of the LBMA and COMEX.
The fixed peg between the ruble and gold puts a floor on the RUB / USD rate but also a quasi-floor on the US dollar gold price. But beyond this, the linking of gold to energy payments is the main event. While increased demand for rubles should continue to strengthen the RUB / USD rate and show up as a higher gold price, due to the fixed ruble – gold linkage, if Russia begins to accept gold directly as a payment for oil, then this would be a new paradigm shift for the gold price as it would link the oil price directly to the gold price.
… What does this mean for the US Dollar?
Since 1971, the global reserve status of the US dollar has been underpinned by oil, and the petrodollar era has only been possible due to both the world’s continued use of US dollars to trade oil and the USA’s ability to prevent any competitor to the US dollar.
But what we are seeing right now looks like the beginning of the end of that 50-year system and the birth of a new gold and commodity backed multi-lateral monetary system. The freezing of Russia’s foreign exchange reserves has been the trigger. The giant commodity strong countries of the world such as China and the oil exporting nations may now feel that now is the time to move to a new more equitable monetary system. It’s not a surprise, they have been discussing it for years.
While it’s still too early to say how the US dollar will be affected, it will come out of this period weaker and less influential than before.
What are the Consequences of these Developments?
The Bank of Russia’s move to link the ruble to gold and link commodity payments to the ruble is a paradigm shift that the western media has not really yet been grasped. As the dominos fall, these events could reverberate in different ways. Increased demand for physical gold. Blowups in the paper gold markets. A revalued gold price. A shift away from the US dollar. Increased bilateral trade in commodities among non-Western counties in currencies other than the US dollar.
The above is an excerpt from a longer article (see link to full article)…