Since I’m making new threads…
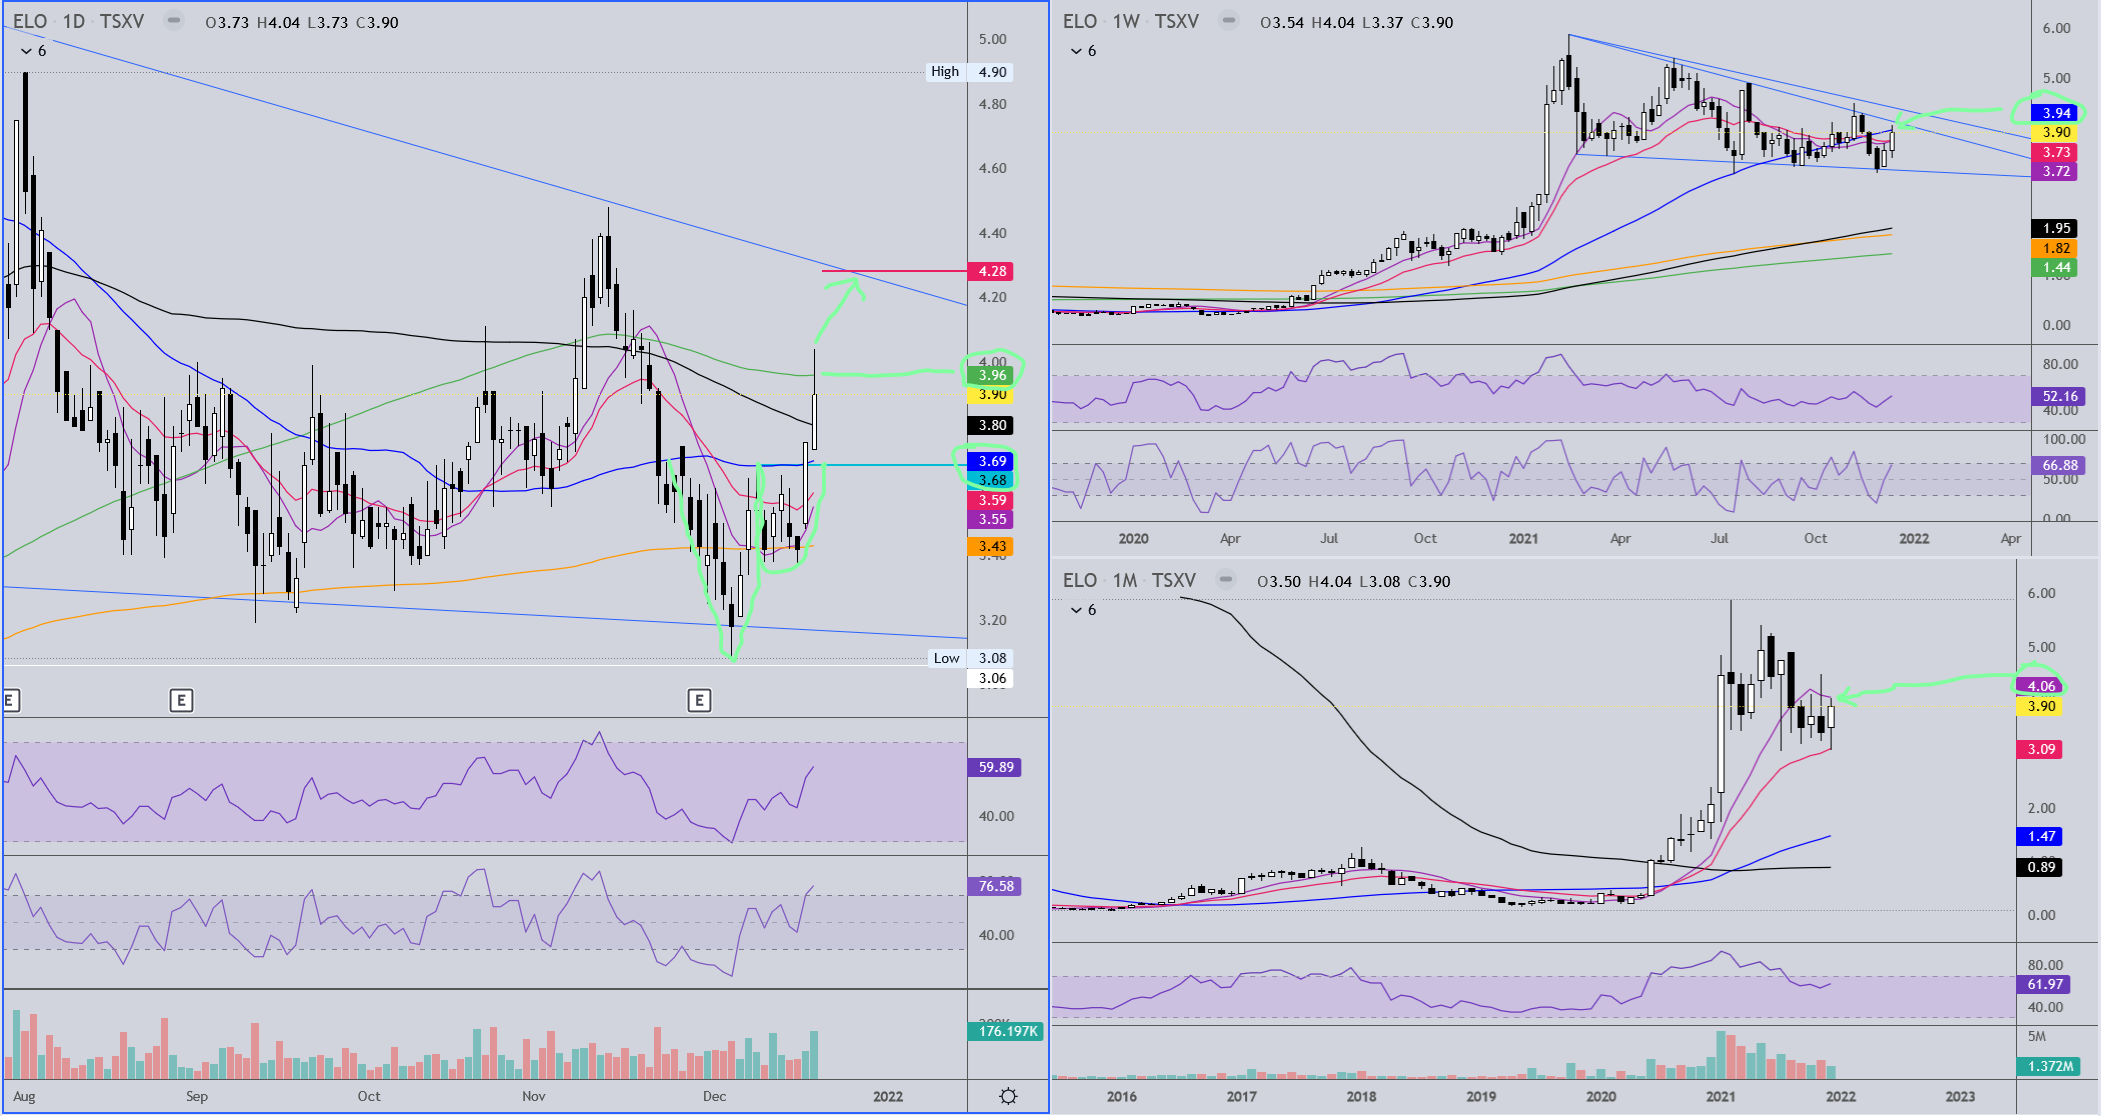
The big chart on the left is a daily interval. The formation I highlighted is called an adam & eve bottom. The breakout was at 3.68, which is also a tick below the 50ma. The measured move (target price), if hit, would take the stock to the red line at 4.28, which “coincidentally” is right where downtrend line resistance resides. The green moving average indicated on this chart is the 200ma. Would have been nice to have closed above that, but considering the stock is under accumulation and it trades so thinly, that probably works to the benefit of those accumulating if they want more shares. So our immediate resistance on this chart is at that level of 3.96 and the days high at 4.04. The chart on the upper right is the weekly interval. ELO closed very nicely this week above the 10ma and 20ema at 3.72 and 3.73 respectively. Watch those for support on any pullback. ELO pushed through the weekly 50ma at 3.94 but closed back below, so there’s another level of resistance to keep an eye on. The trend lines on this chart indicate a huge pennant formation. A bullish breakout from this formation says the stock could eventually reach into the low $8 range. The lower right chart is the monthly interval which simply shows the support at the 20ema (3.09) and resistance at the 10ma (4.06). So what I’m watching for Monday is some form of flag or consolidation under the 200ma then a break out to continue the move to the 4.28 target. If the 200 acts as resistance and we have more of a retracement then I’m watching the 3.80 - 3.72 area.
Hi TR! Please can you make a chart for Gold
Ok here’s what I have for gold.
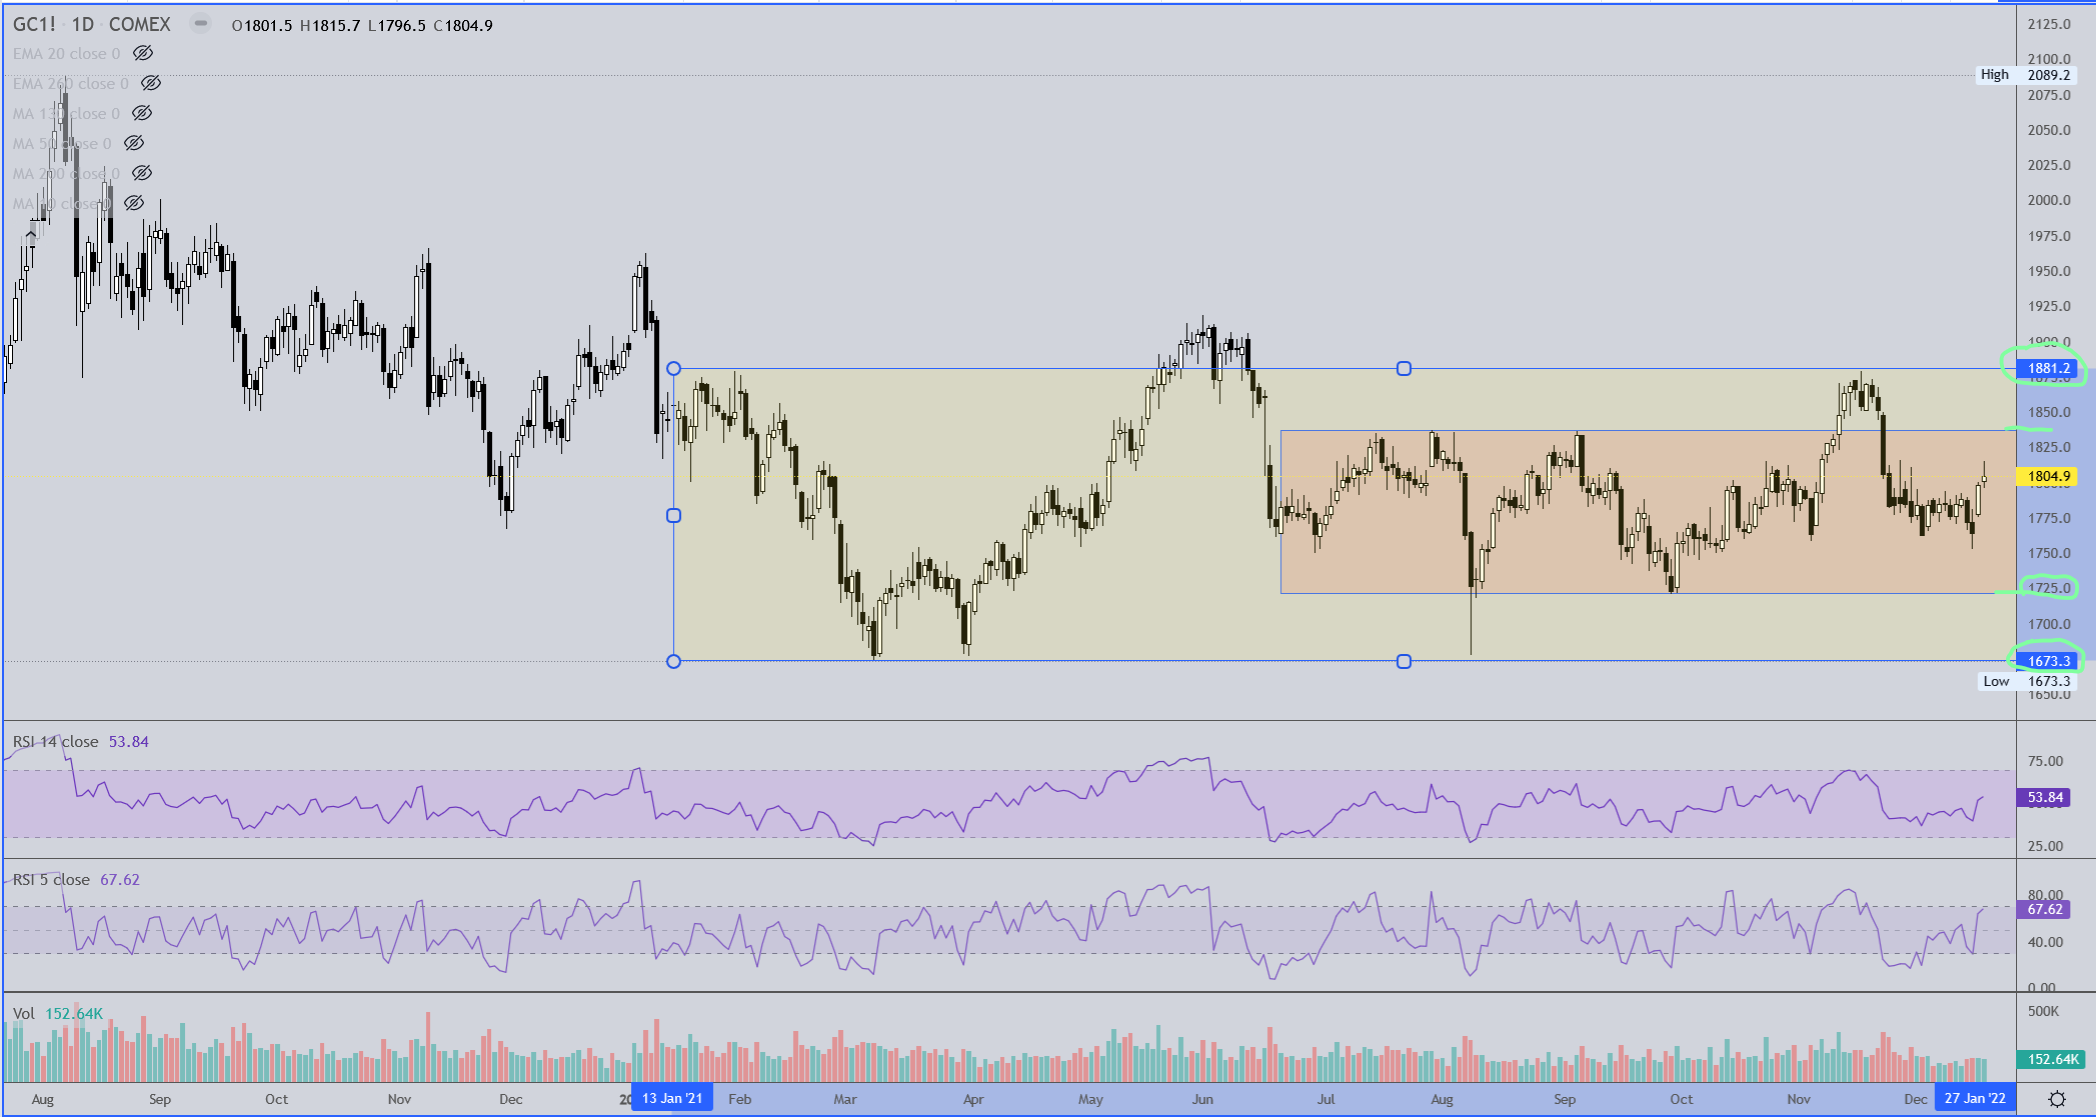
First up is a daily interval where I have highlighted two different zones of consolidation that gold has been in for this entire year. The larger zone that covers practically all of 2021 resides within 1881 and 1673. The narrower zone gold has been in for the last half of this year is a tighter range between about 1835 and 1725. I agree with a recent vid from Gary Savage (you have to crank your volume as he was having computer issues https://www.youtube.com/watch?v=-38HJW8A3bQ&t=14s) that gold has to move above and hold 1835 as support before being able to maintain a short term bullish view. If that happens, we’ll need a run up through the 1881 level and then up to and through 1920.
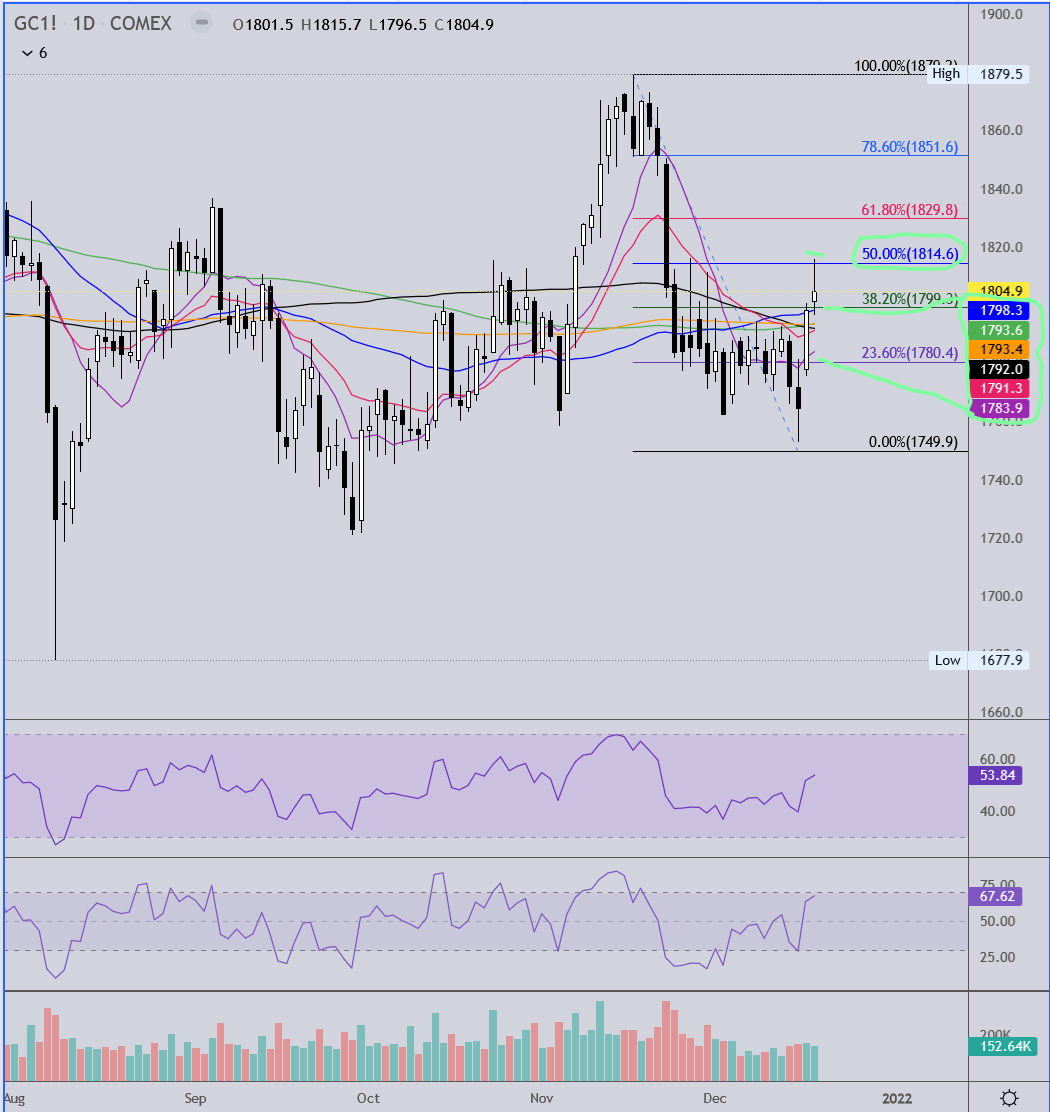
Next is a closer view of the daily chart with moving averages, which do offer support and resistance but have not been all that dependable on the daily time frame. Friday gold pushed through the 50ma resistance and closed above it. Next week we’ll see if it remains support. Also, gold retraced 50% of its prior range. If it can push further up to and past the 61.8% level and find some support up there then the bullish case will be stronger.

Next is the weekly interval chart. Here you can see that from August of 2020 to March of '21 gold was dropping at a fairly consistent rate. Then after it hit it’s low in March and rallied back up above 1900 in June of this year, that it has been basically moving sideways in the range shown on the first chart. Since it lost the support of the blue 50ma gold has tried twice to gain it back as support but has not managed to maintain it. Last week gold closed about 8 points above the 50ma so we’ll see how that goes this time around. So far the black 130ma has not been breached. If that should occur in the coming weeks and months, it is likely gold will eventually visit the 1600 level and perhaps dip into the high 1500’s.
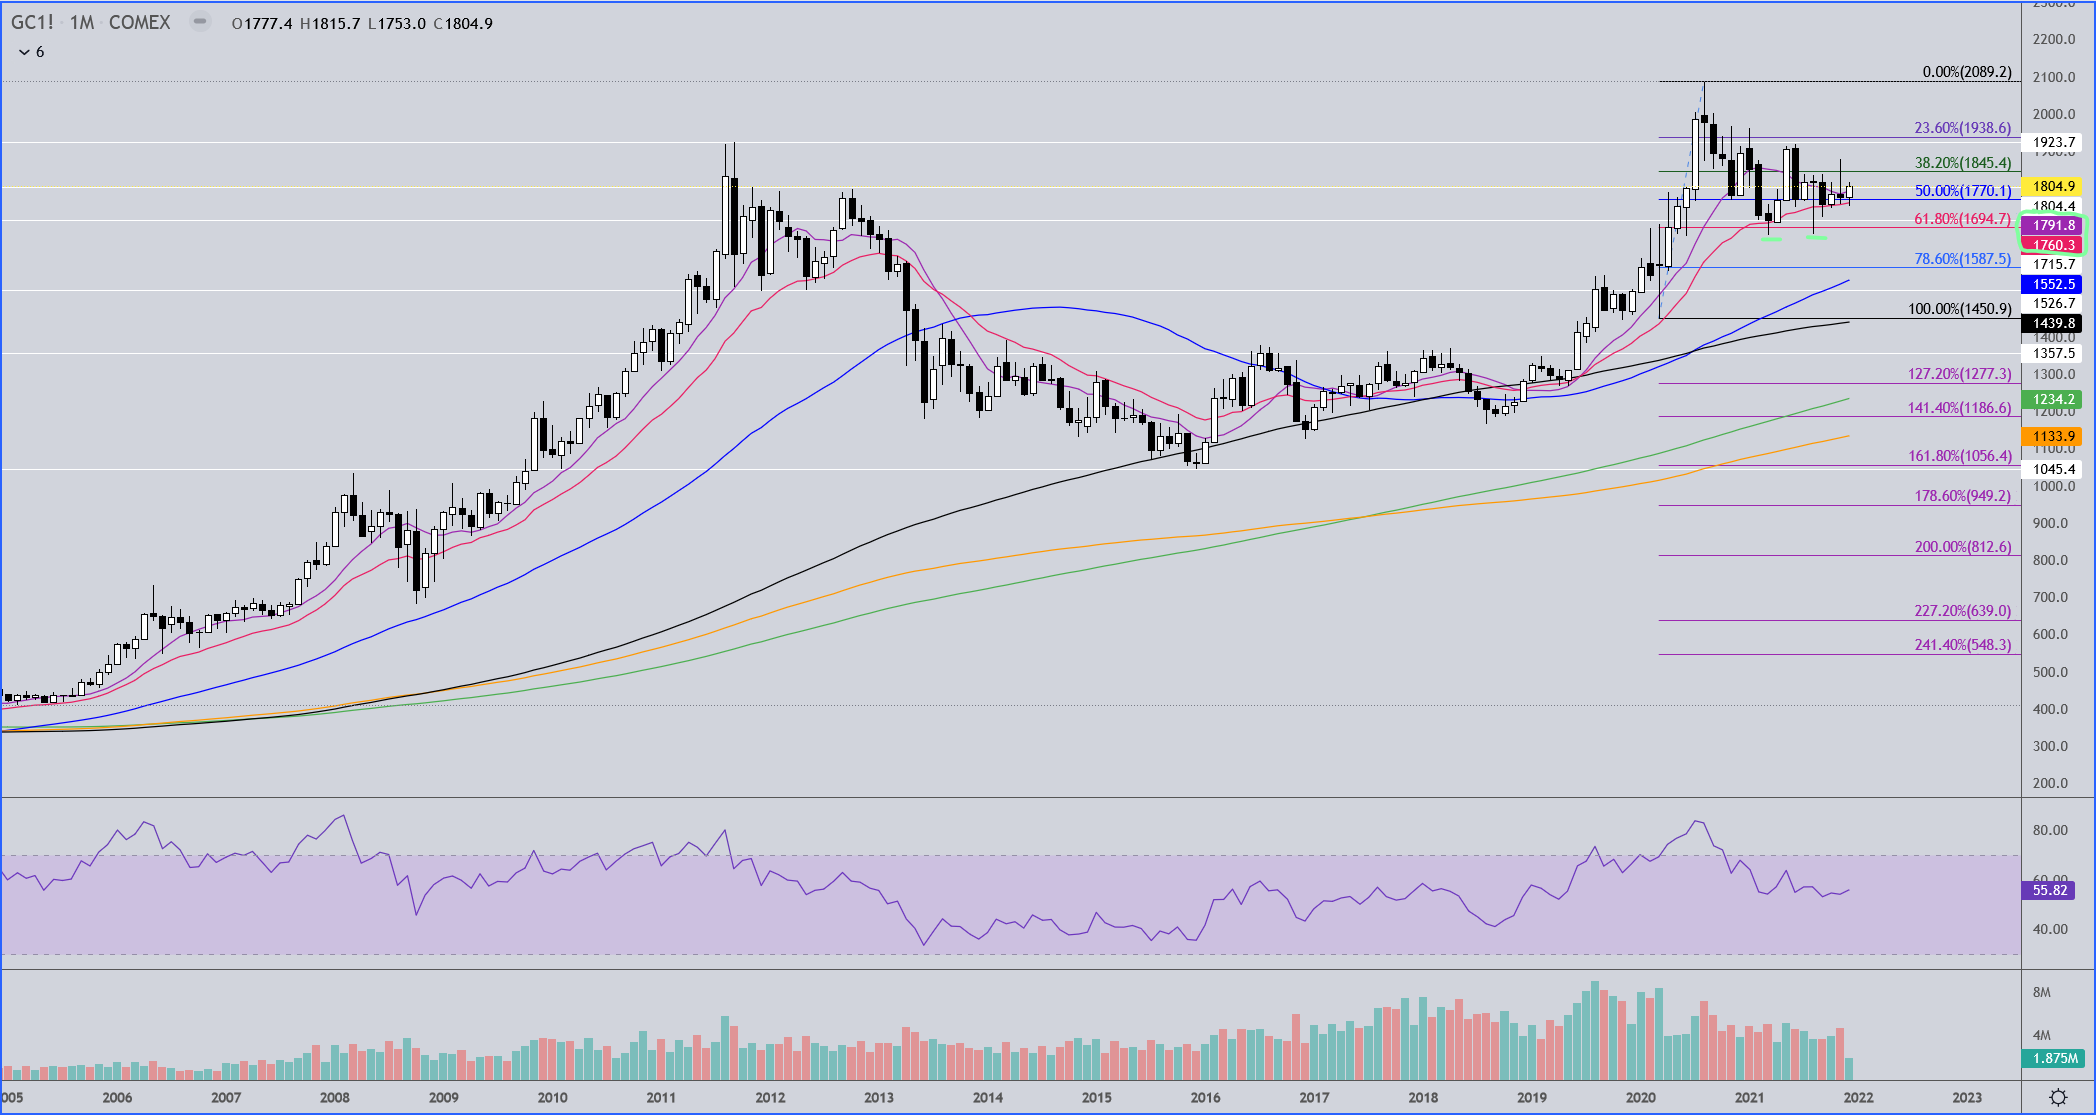
Here is the monthly interval chart. The white horizontal lines are major support/resistance lines. This chart shows that all the activity of gold since the 2089 high could be viewed as a mild pullback forming a bullish flag, a potential pause before the next push to higher prices. It has so far held the 61.8 retracement level ranging from the last major swing low to the 2089 high twice, as well as holding support at the red 20ema quite well. The current candle sitting atop the pinching 10ma and 20ema could be indicative that the move to new highs might be about ready to go, but aforementioned levels of resistance need to be ascended before we can be certain.
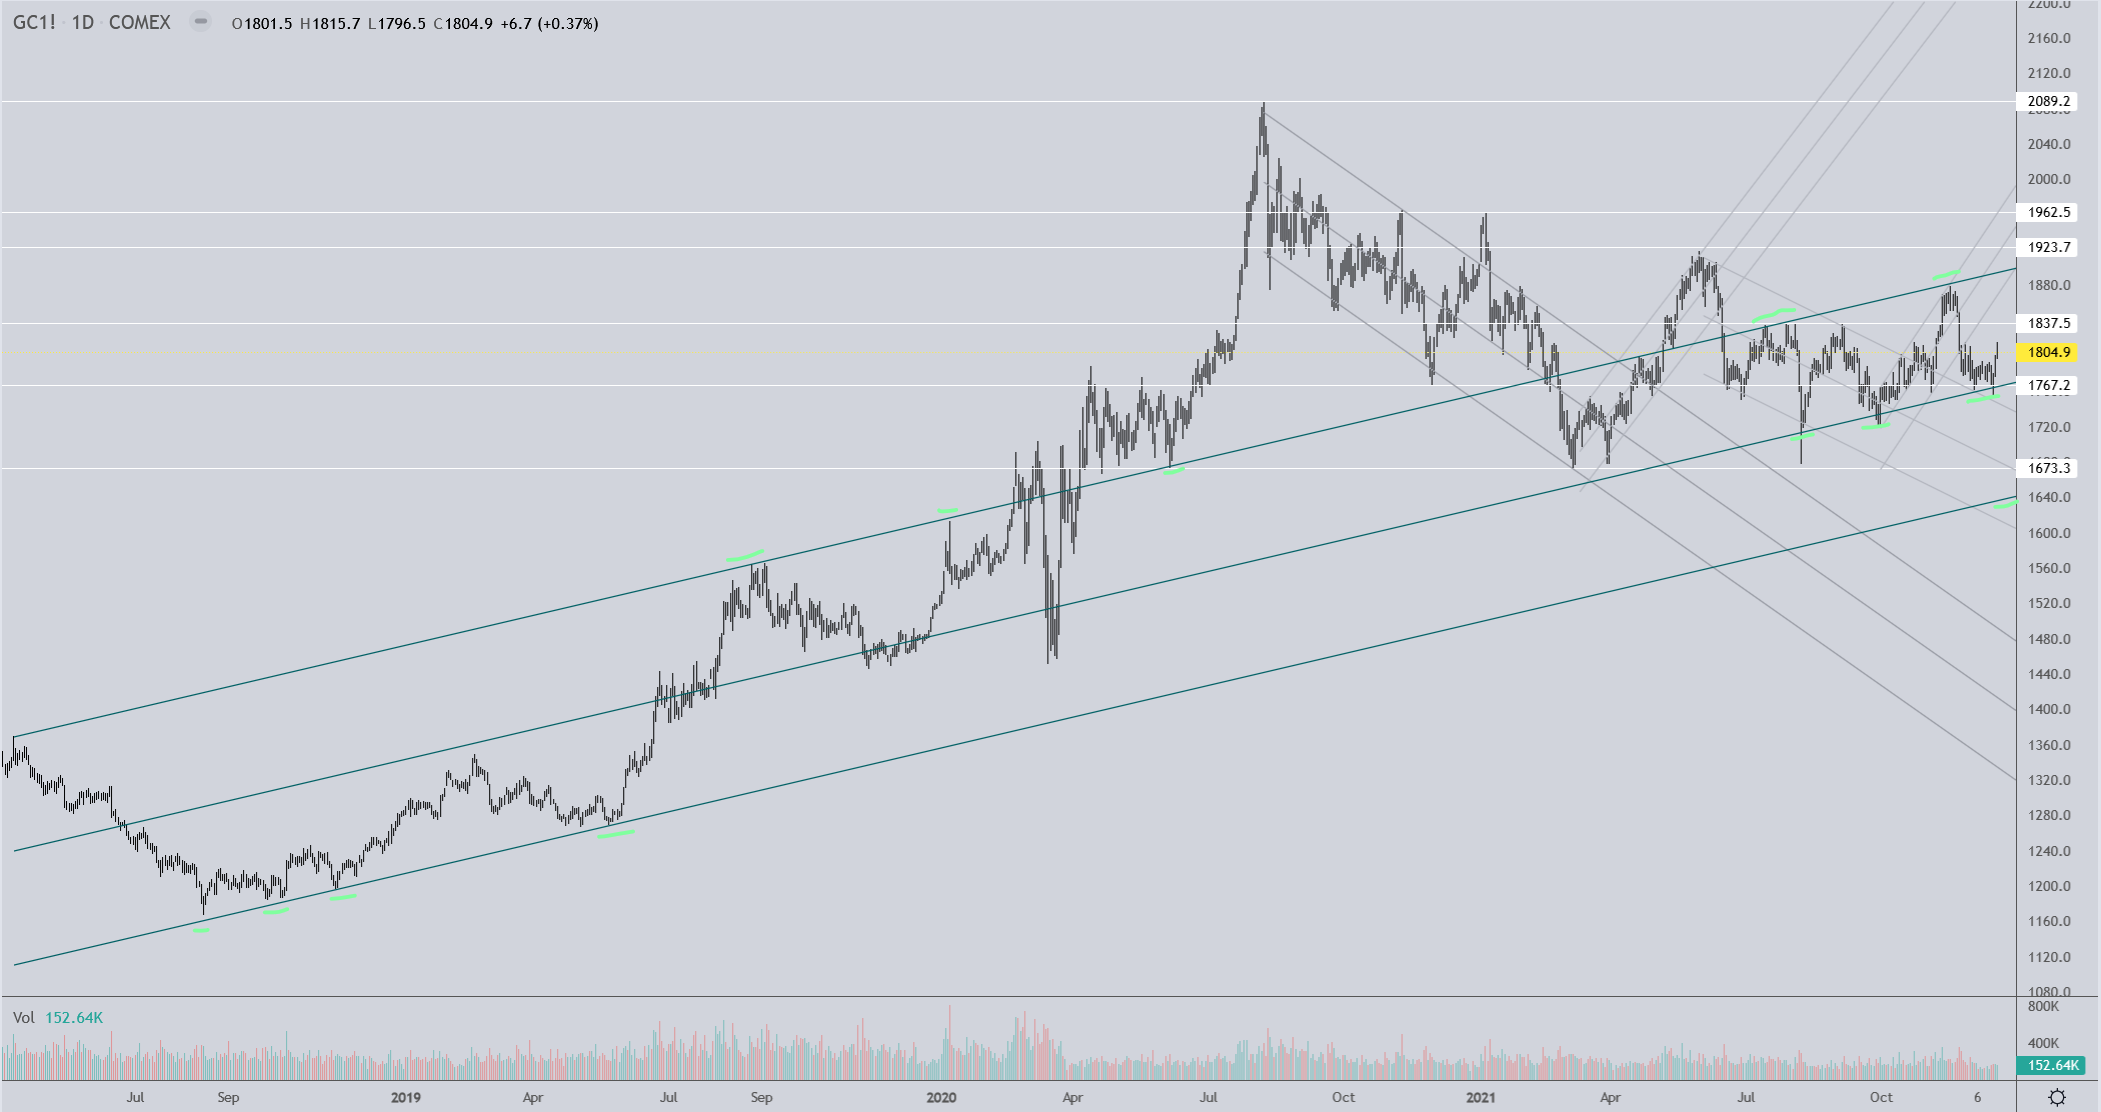
Finally, this is a chart that I use channels to track trading ranges of gold. The green channel in particular is one worth keeping an eye on over time, at least until the price of gold moves to levels higher or lower that will make it irrelevant. I wouldn’t be too surprised if gold ends up visiting the lower channel line at some point before making a run to new highs. I would be more surprised, considering the amount of manipulation that goes on in gold, to see price break above and move to new highs from here, but that is based on my personal opinions of market manipulation and not any technical observations.
3 Likes
Thanks Rich, for taking initiative to improve the forum! Love that you’re back hanging out with us more often.
1 Like
No problem cabezon, my pleasure. I seem to lack, or have not yet discovered, the ability to lock the old threads. Could you take care of that?
I have some interesting non-metals/mining charts to post which I thought some may find interesting. If anyone needs/wants commentary on any of them just ask. These are all bullish looking charts to me.


Charts and commentary for NVO…
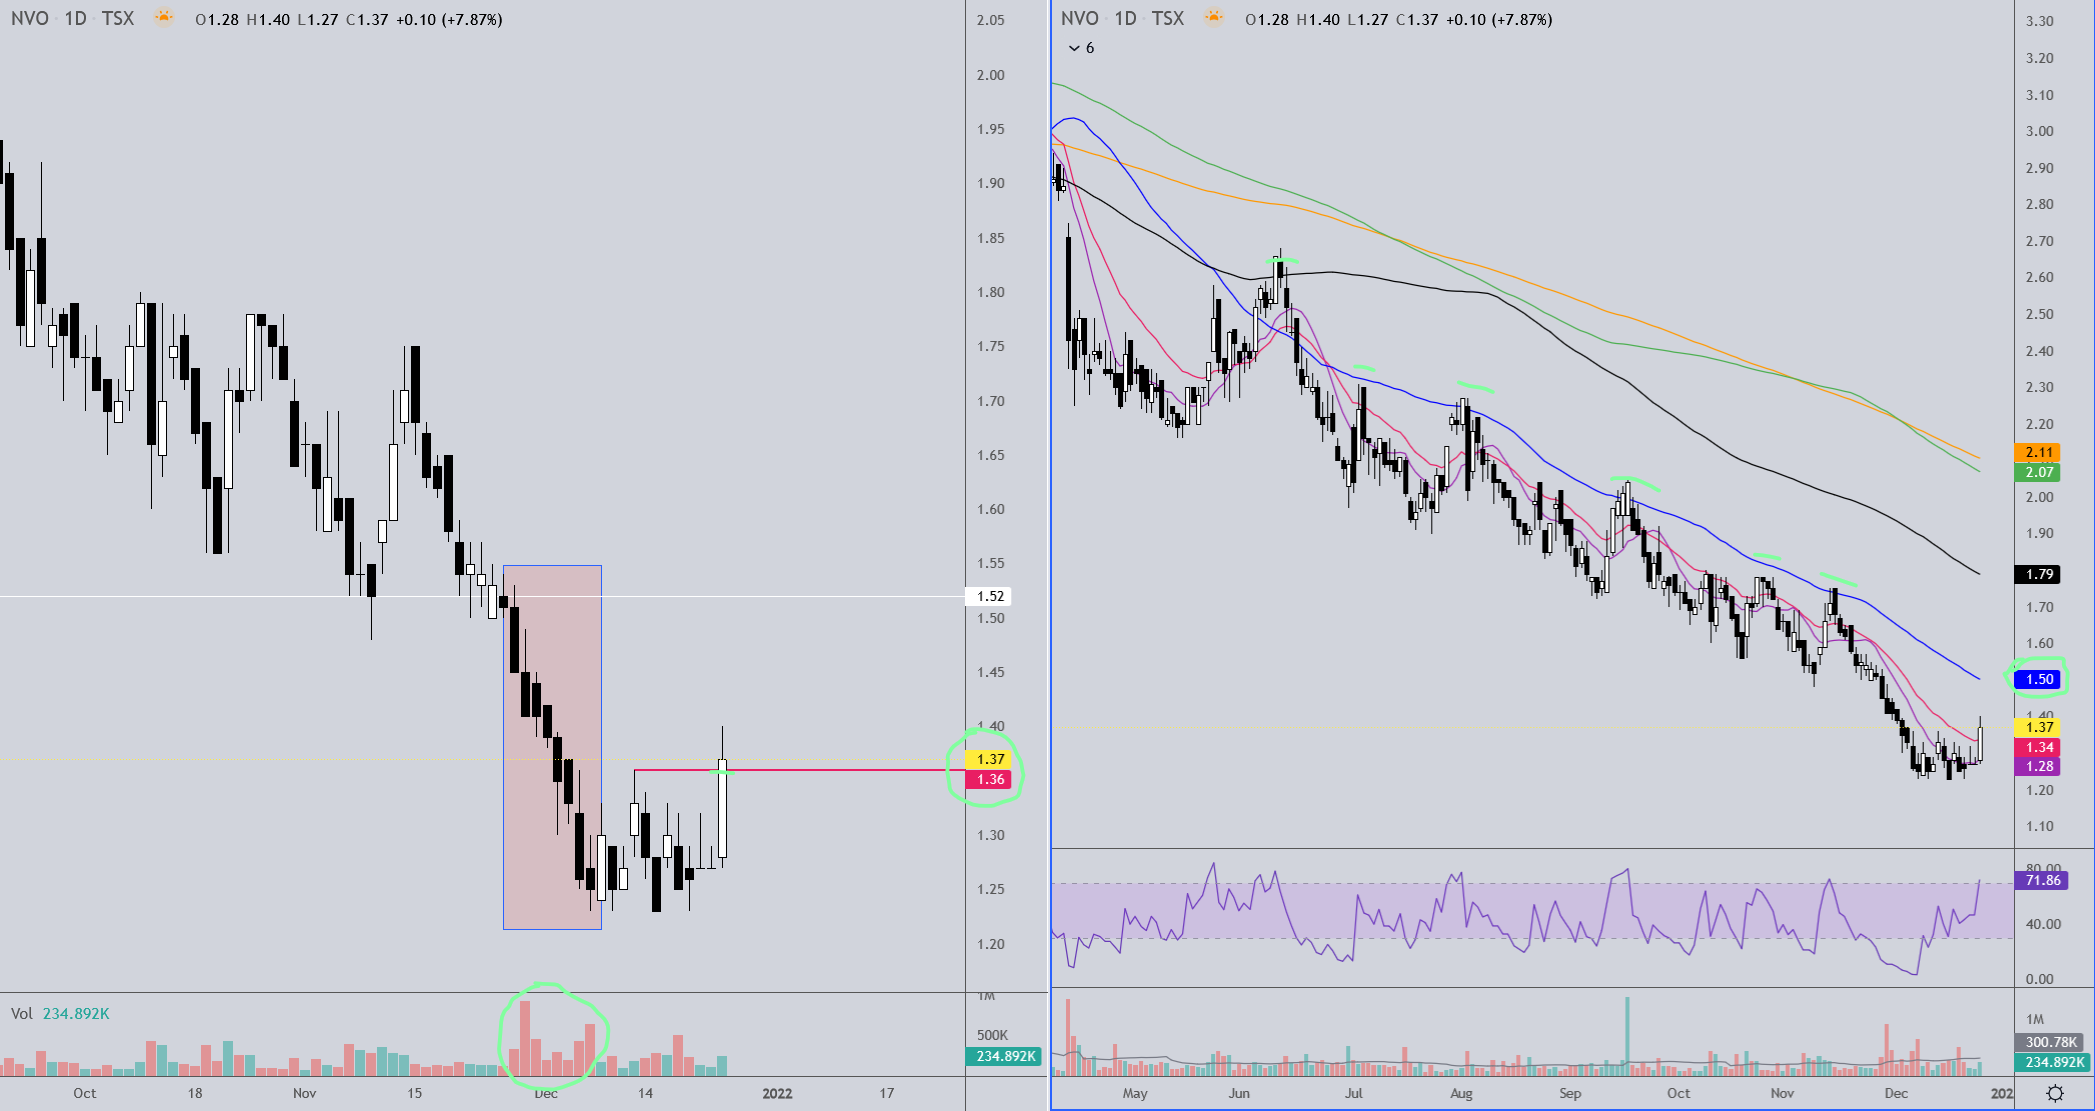
One potentially early indication of an end to a downtrend is a sharp impulsive move down on higher than avg volume. NVO had one of those during the last week of Nov - first week of Dec., followed by a retest of the low and a brief week-long consolidation which resulted in yesterday’s nice “little train that could” grinding move to and above the last swing high of 1.36. NVO even closed a tick higher than that last swing high, which officially gives us the early makings of a trend reversal. It’s a nice start, but we need the Christmas spirit to keep us chugging with some follow through next week. If we start with a pullback it would be nice if it finds support no lower than 1.33/1.32 and promptly heads higher. Providing that happens, the next level of resistance we’ll hit will be a HUGE one, the 50ma, which is the blue MA on the chart to the right. The 50ma is NVO’s nemesis. In my mind, to defeat this beast by getting a close and finding a strong support level anywhere above the 50ma is cause for celebration, as it has been staunch resistance since last June.
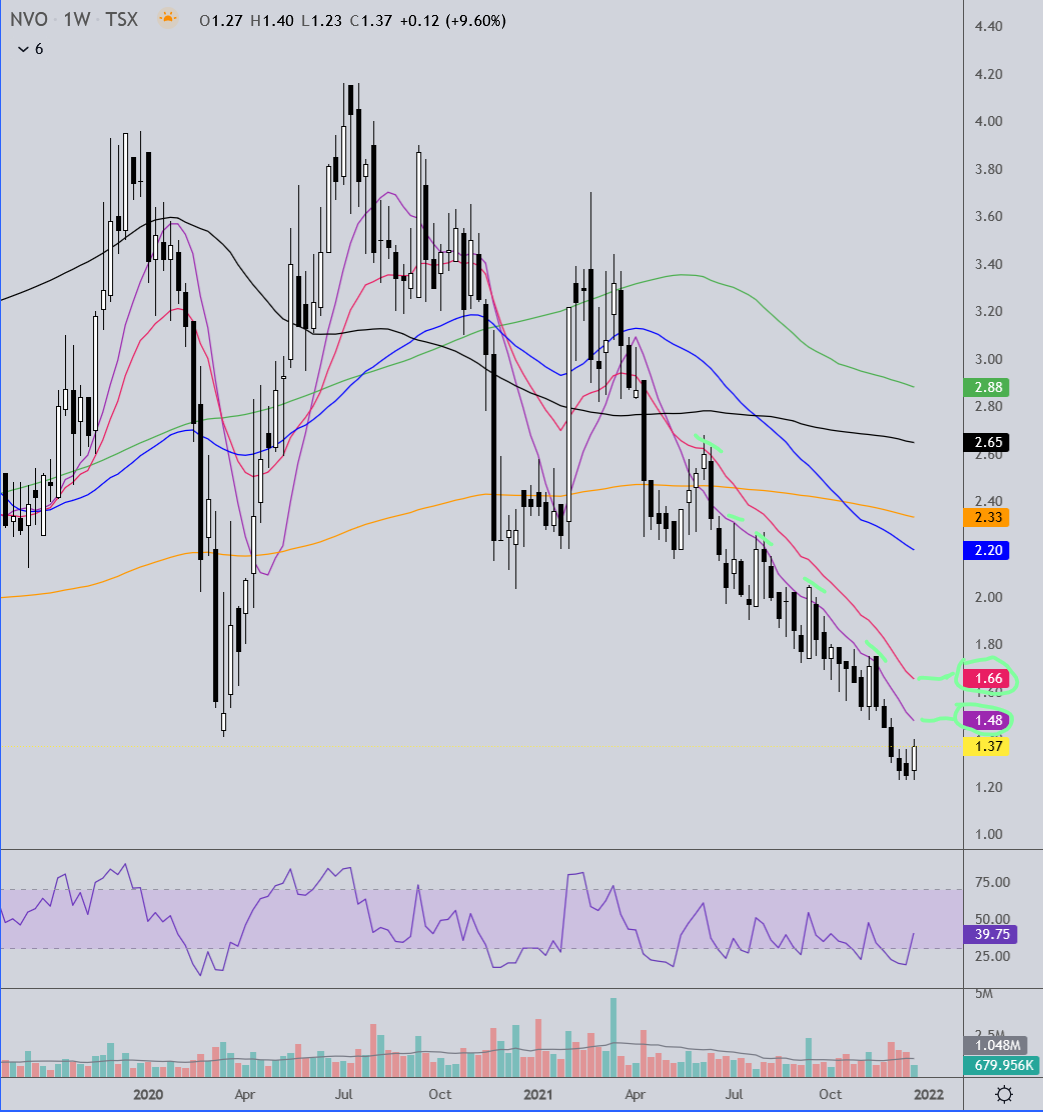
This second chart is the weekly interval. When we get above the daily 50ma we’ll also be above the 10ma on this chart, with the red 20ema right there waiting. This will be NVO’s next challenge, followed by 1.75 which is the last swing high on the weekly chart. More conservative chartists will likely not be bullish on NVO until it can get above the 1.75 - 1.80 level, so it’s just as important as defeating the daily 50ma.
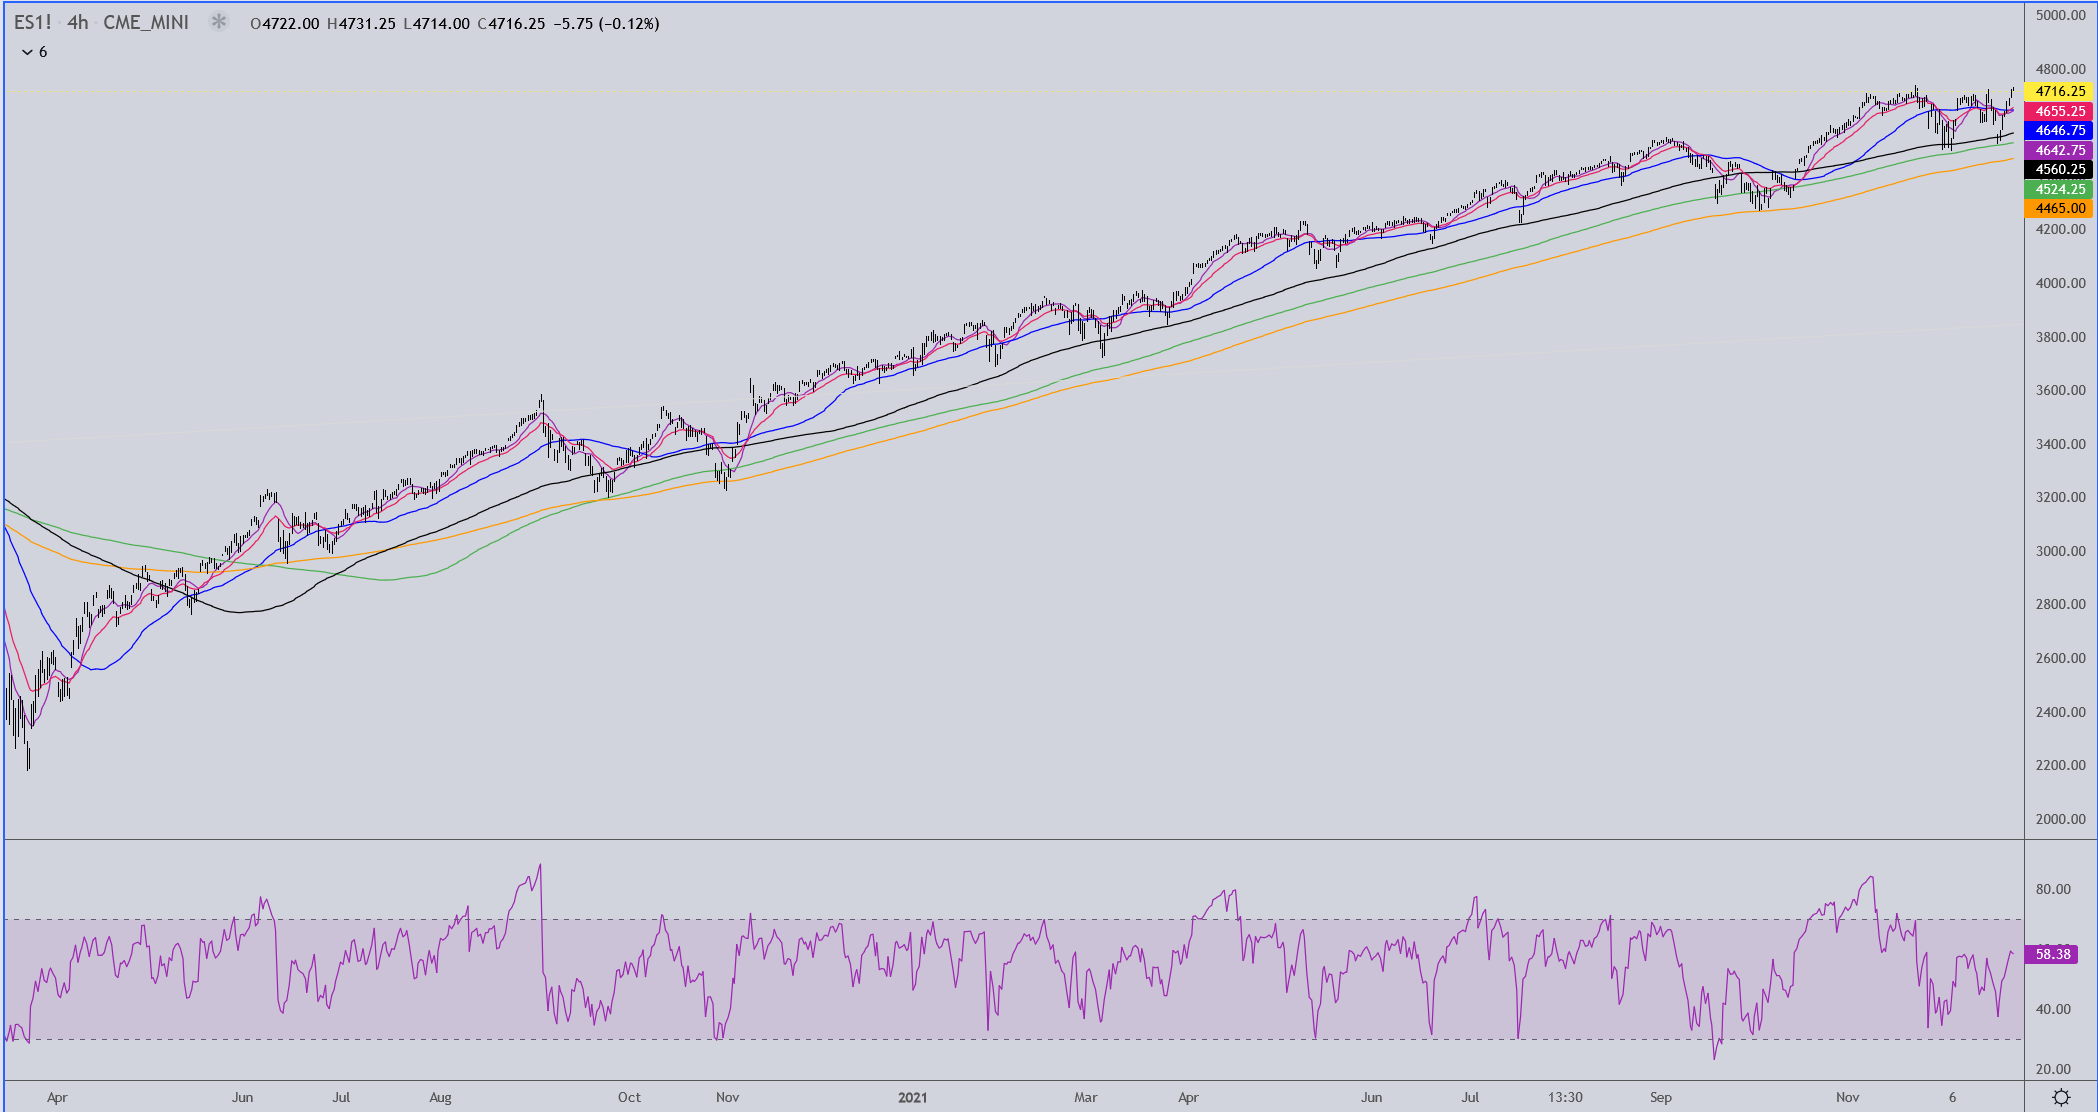
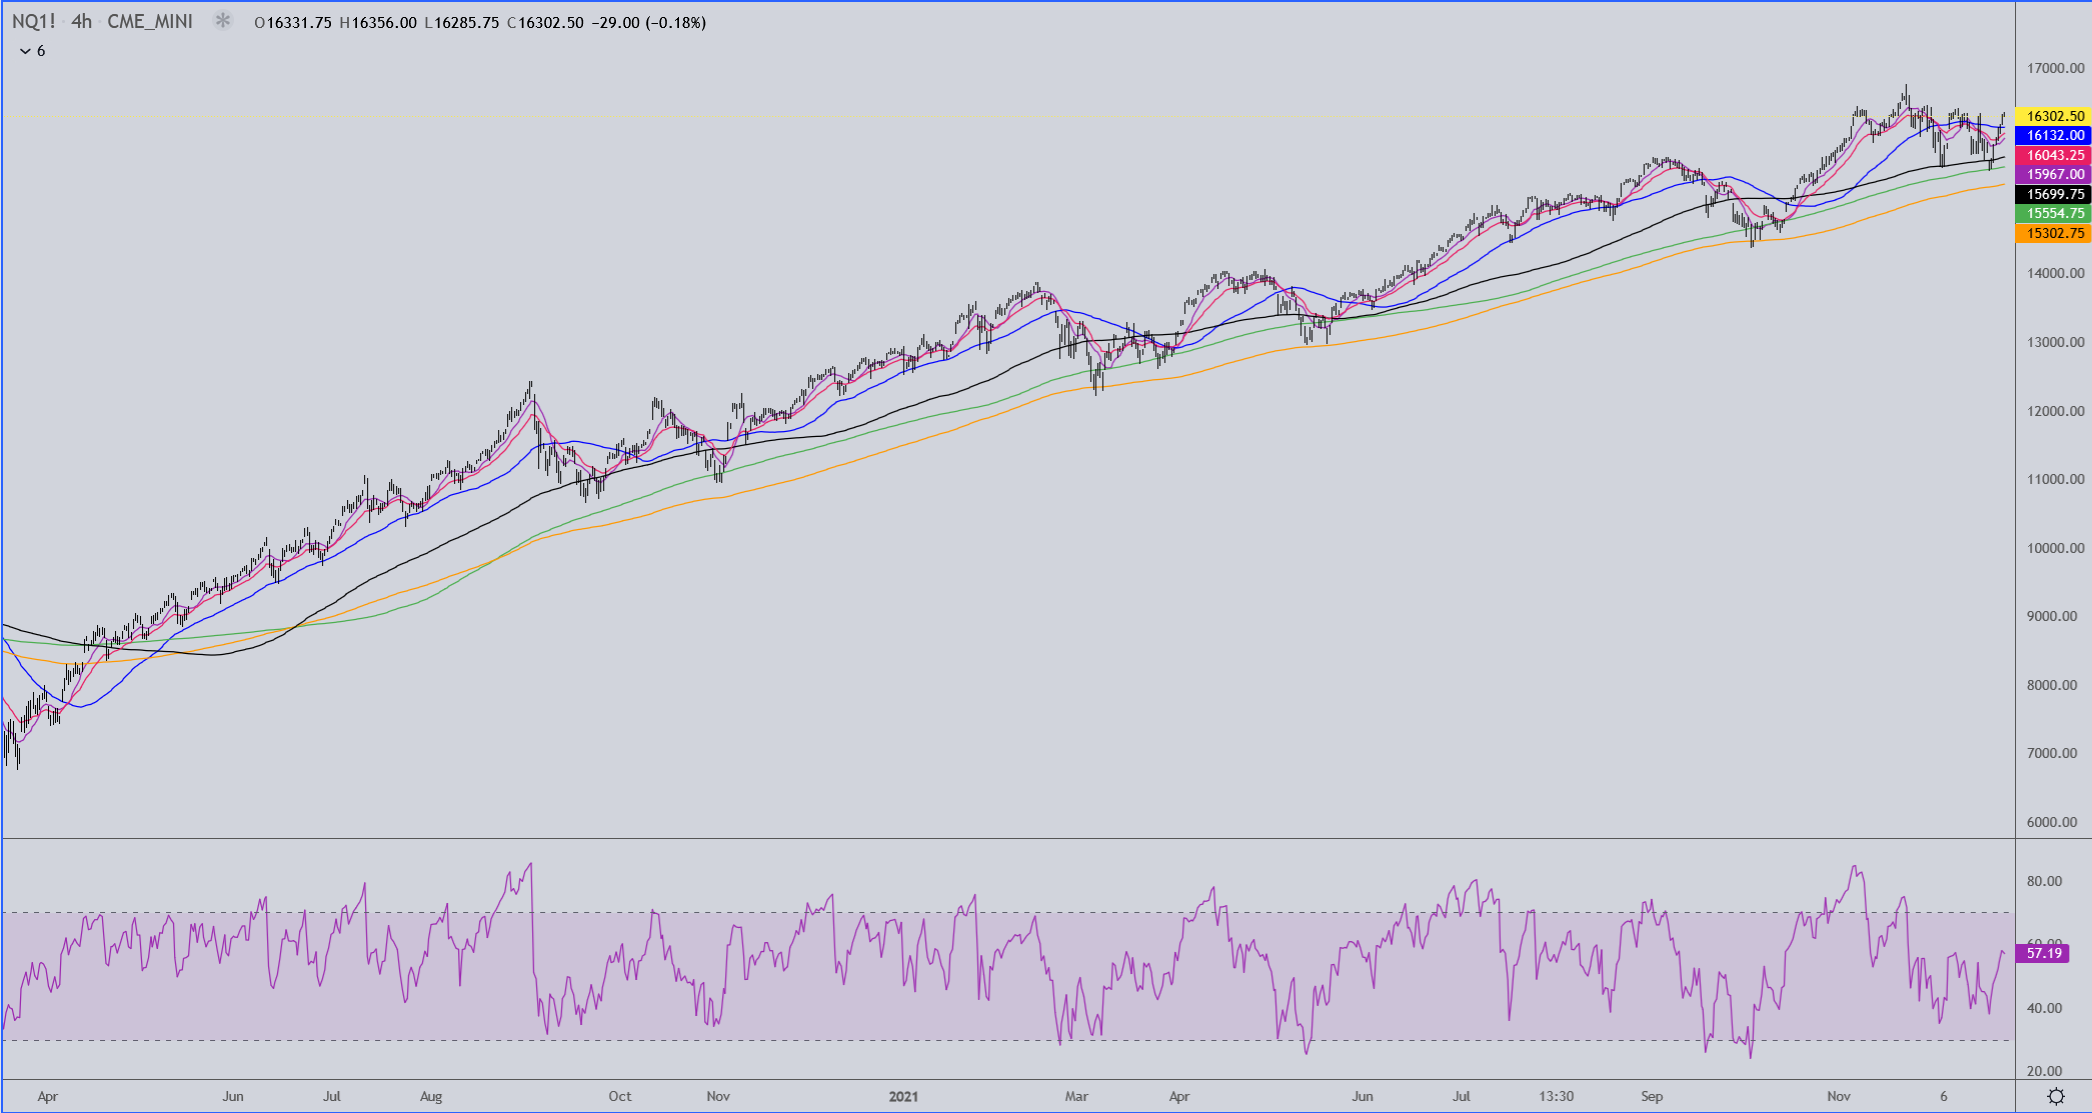
My 4 hour interval charts for ES (S&P futures) and NQ (Nasdaq futures)… nothing bearish about them at the moment.
1 Like
Rich,
Could you do a chart on ENPH, also TAN & QCLN?
I currently have no positions in these but would be interested in acquiring.
TIA,
EZ
ENPH
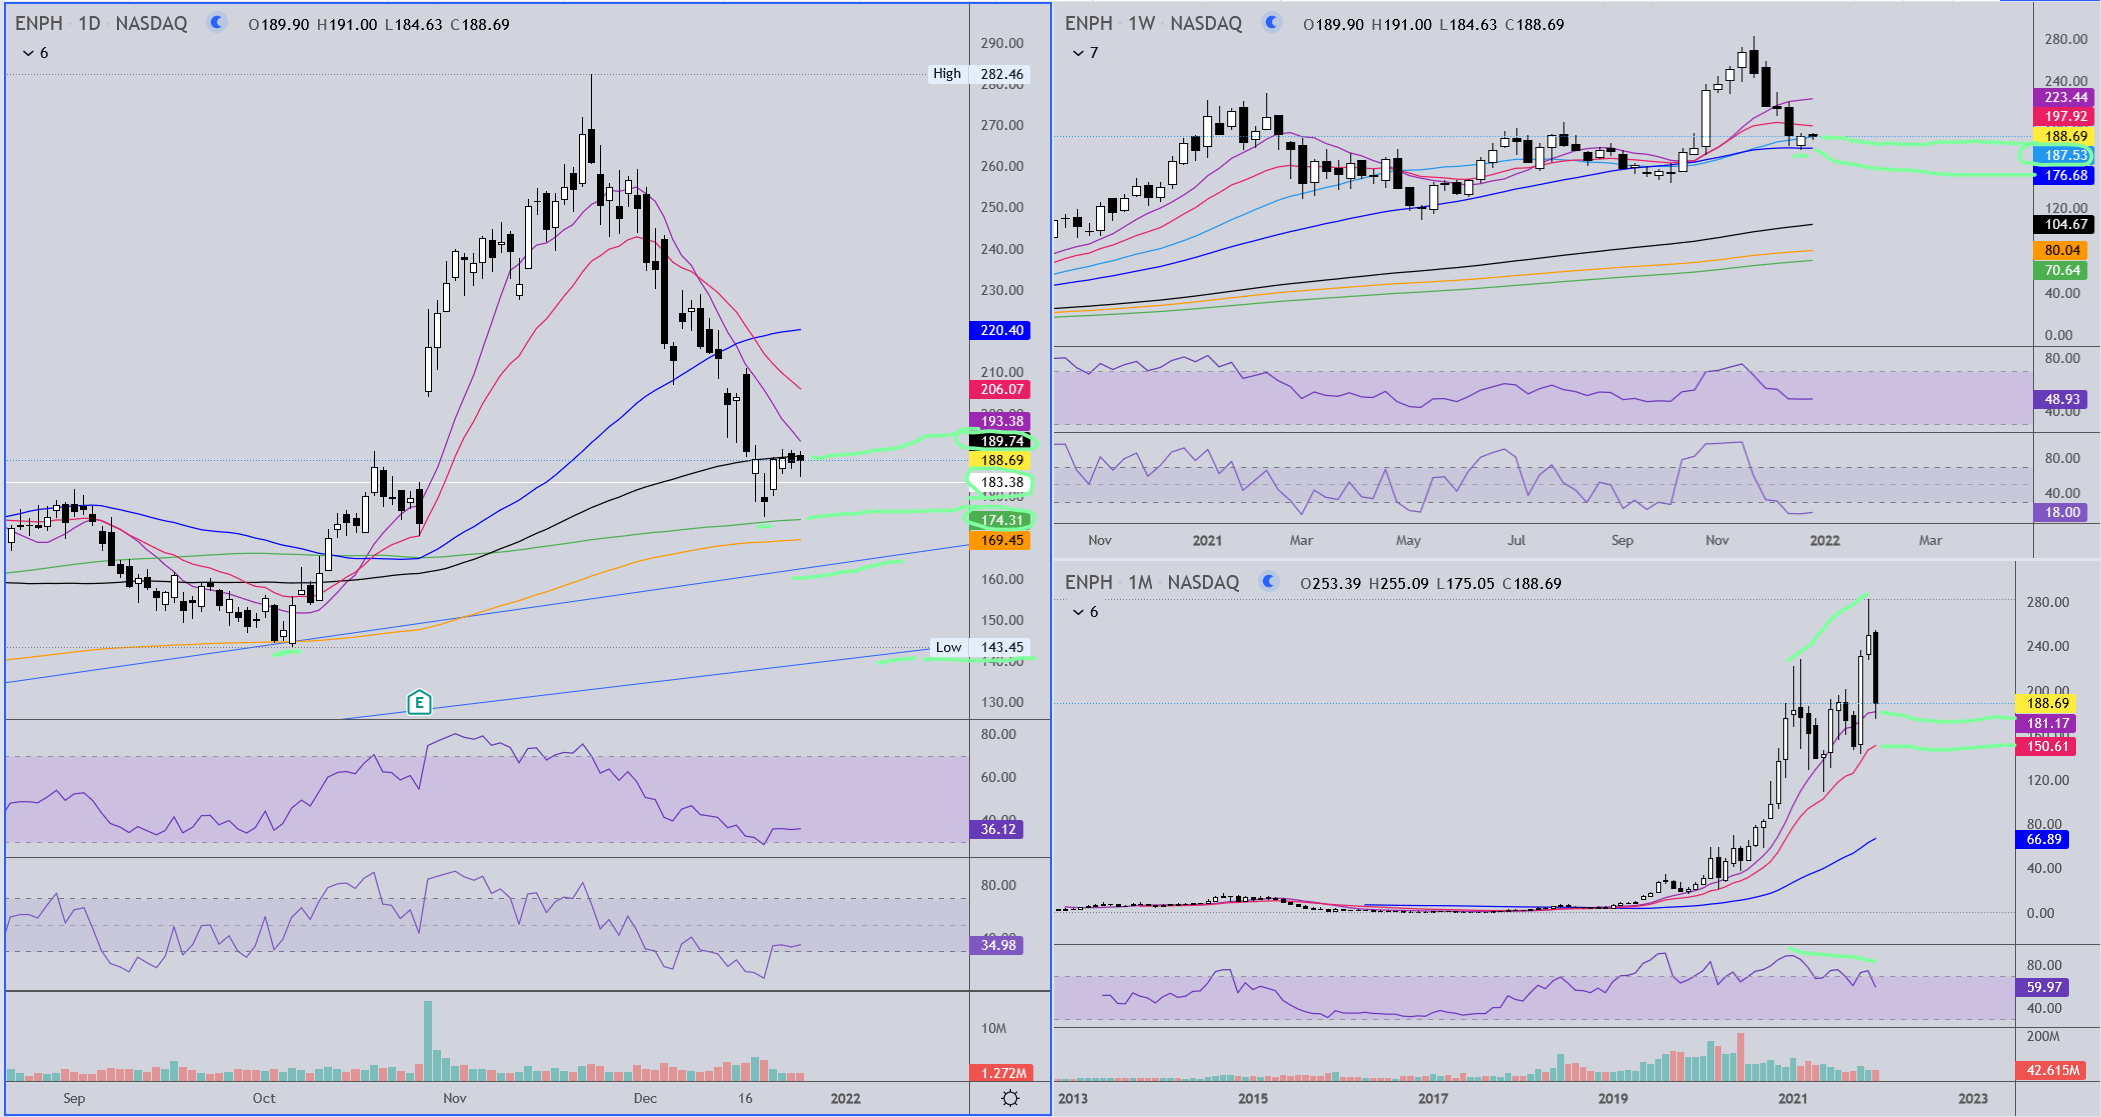
I’ll go from monthly to weekly to daily interval. Bottom right is the monthly. You’ve got bearish RSI divergence at the two highs, but the RSI is still above 50 and it’s still in bullish territory. Watch to see where this candle closes on the last trading day in Dec. If it’s below the 10ma that is currently holding then it may revisit the 20ema around 150.
On the weekly chart, upper right, so far this big retracement found support right on the weekly 50ma and this week’s candle has opened above the 30ma and is currently about a dollar above it. Keep an eye on those ma’s and watch where the weekly candle’s close.
The daily chart keeps me on the sidelines for now. This chart is bearish but it may be working out a bottom. It’s just too soon to know. On the bullish side, the stock found support at the 200ma and has had a decent bounce, although volume is lethargic. The RSI is oversold, but that isn’t necessarily a reason to buy as it can stay this way for some time. On the bearish side the stock is finding resistance at the 130ma well below the last swing high at 211. You can see the 10ma has been resistance since the 260 area, so a close above that can be an early bullish sign. I don’t have the Fibonacci grid drawn but the stock pulled all the way back to the 78% mark, which tends to mean there is the possibility that it retraces 100% back to 143.45, or at least to a lower low, maybe to the higher of the two trend lines I have drawn.
At this time I would give this more time to see what it’s going to do. Watch those MA’s on the weekly & monthly, and on the daily see if it can get support above the 130ma. Also watch for some consolidation giving the 10ma and 20ema time to flatten and turn up, with some closes above the 10ma and eventually a close and support at/above the 211 last swing high. Right now I see very little reason to buy this stock.
1 Like
TAN
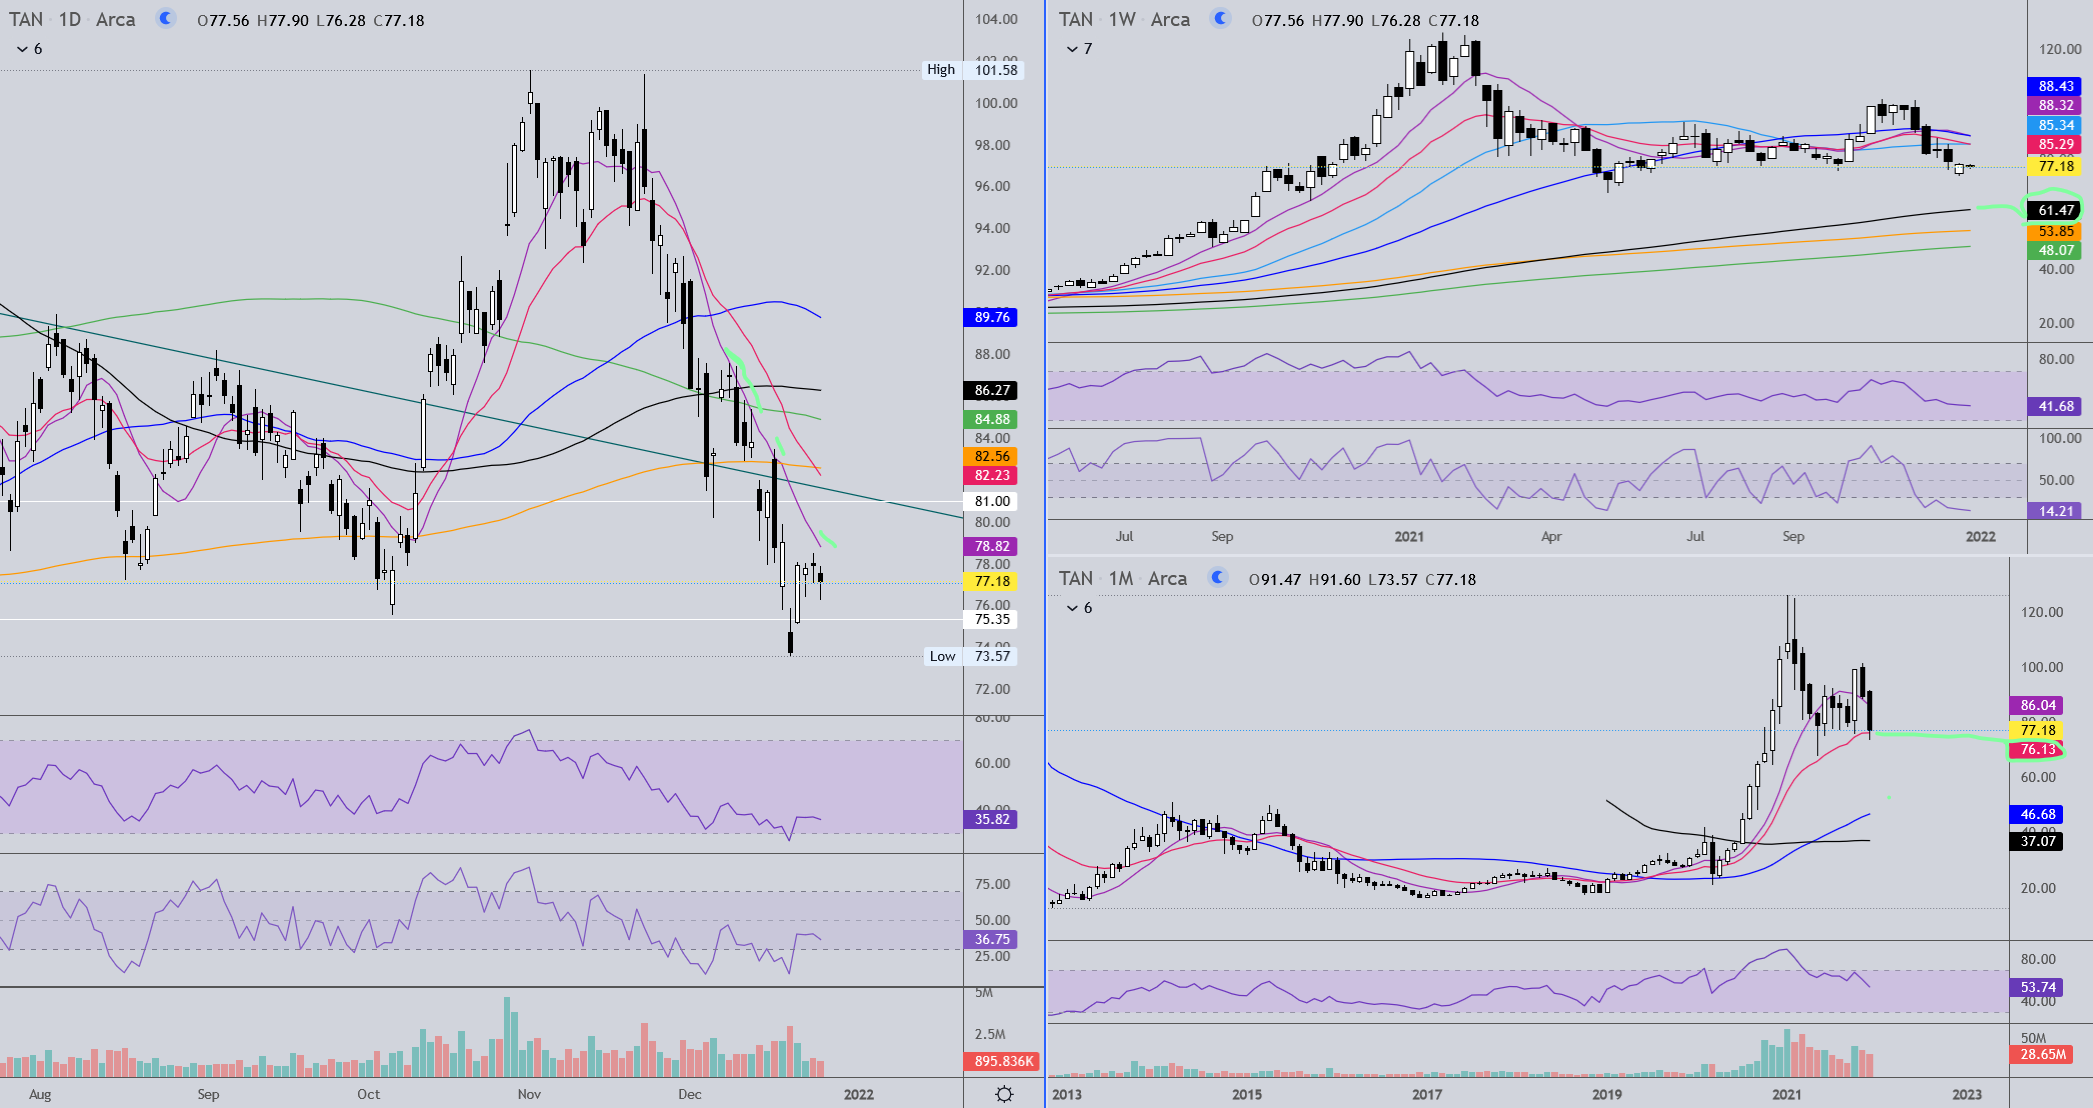
This is one I expect will see lower prices. You’ve currently got support at the monthly 20ema, but that’s about it, and watch to see how it looks at the end of Dec. The stock is below all the short ma’s on the weekly, and unless you get an $8 move this week it’ll stay that way.
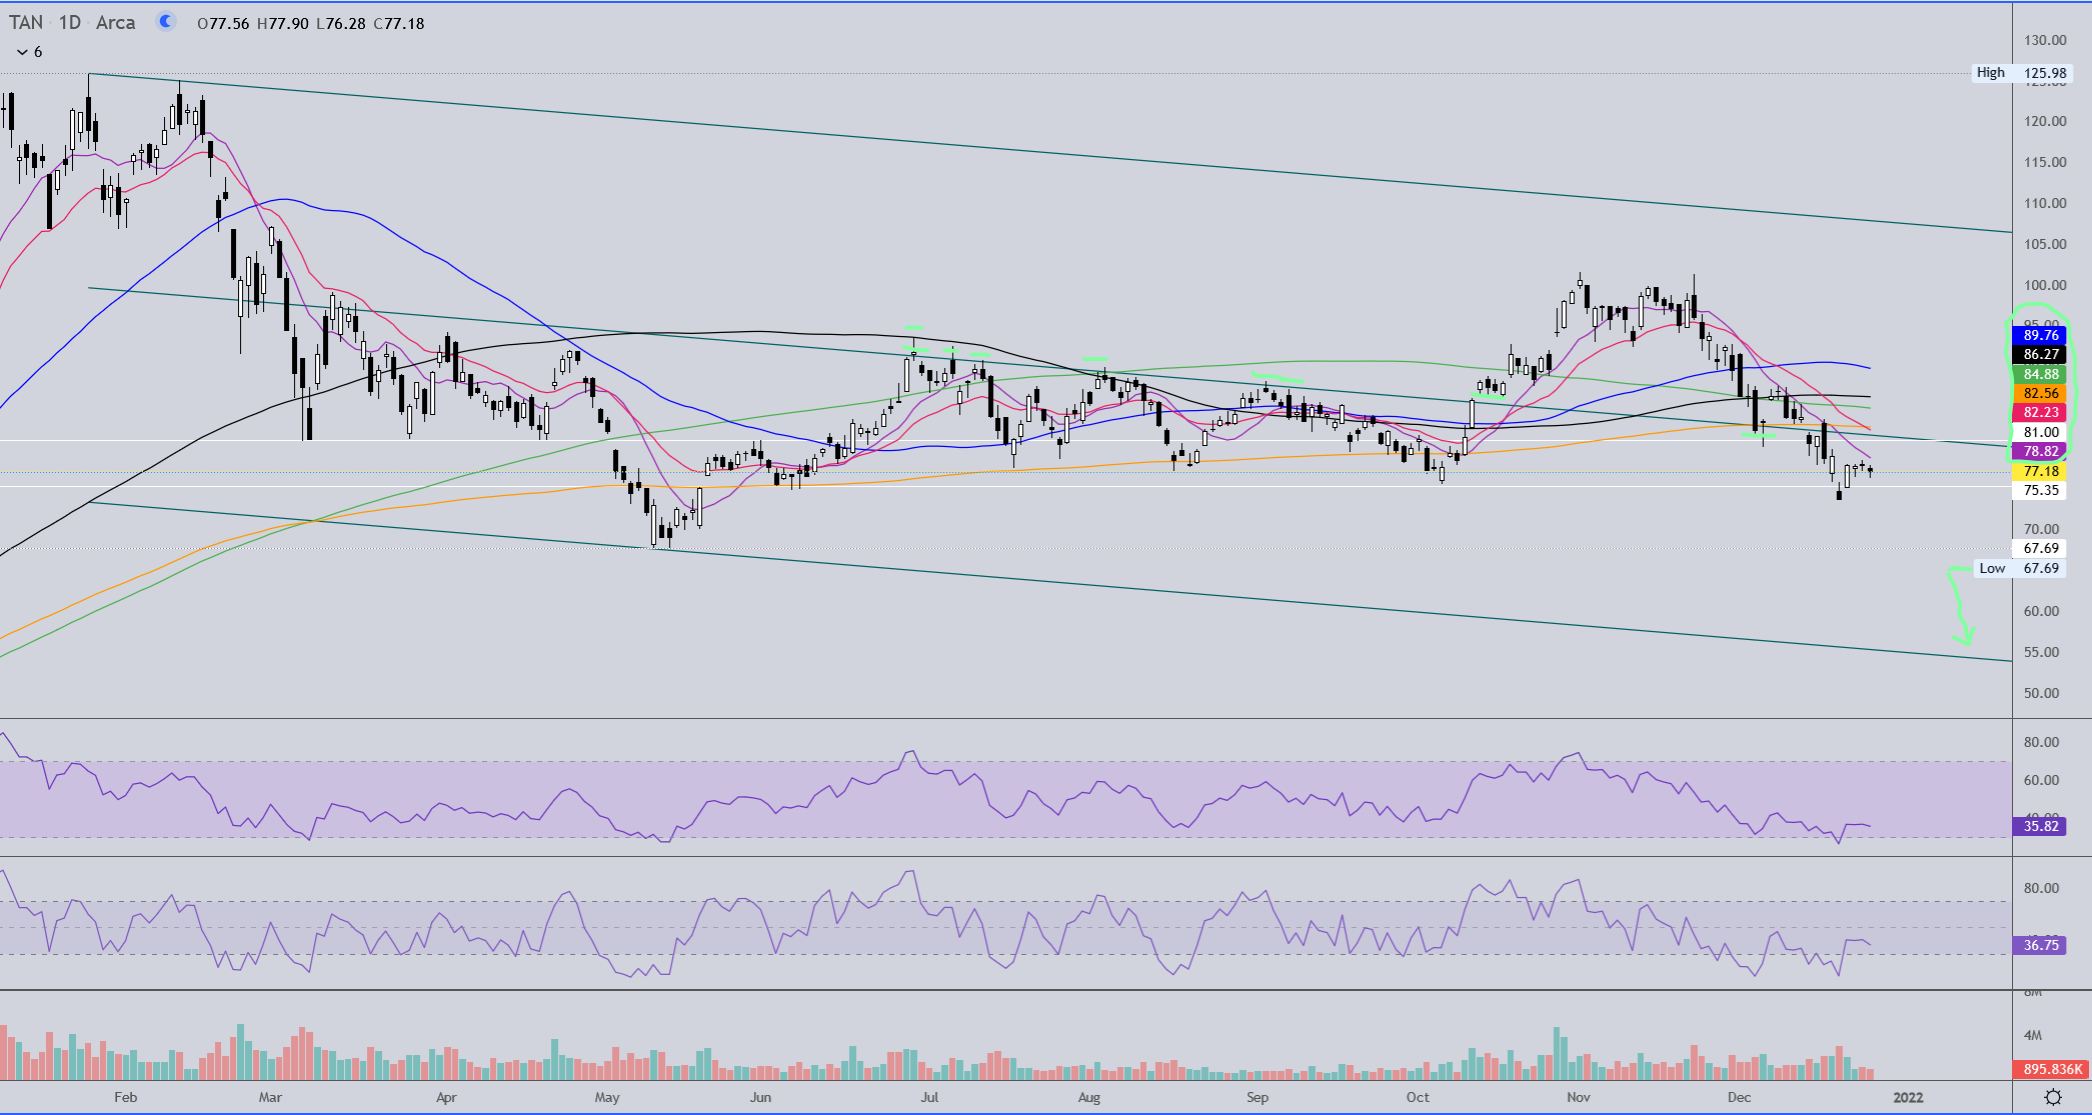
On the daily chart you’ve got horizontal support at around $75 and if that fails it’s likely going back to that last major swing low at 67.69, and then likely lower. Again the 10ma on this chart is the first line in the sand. Watch for price to consolidate and get above the 10 then the 20ema. Based on how it looks right now it wouldn’t surprise me to see this eventually test the lower line of the channel drawn here in the mid 50’s.
QCLN
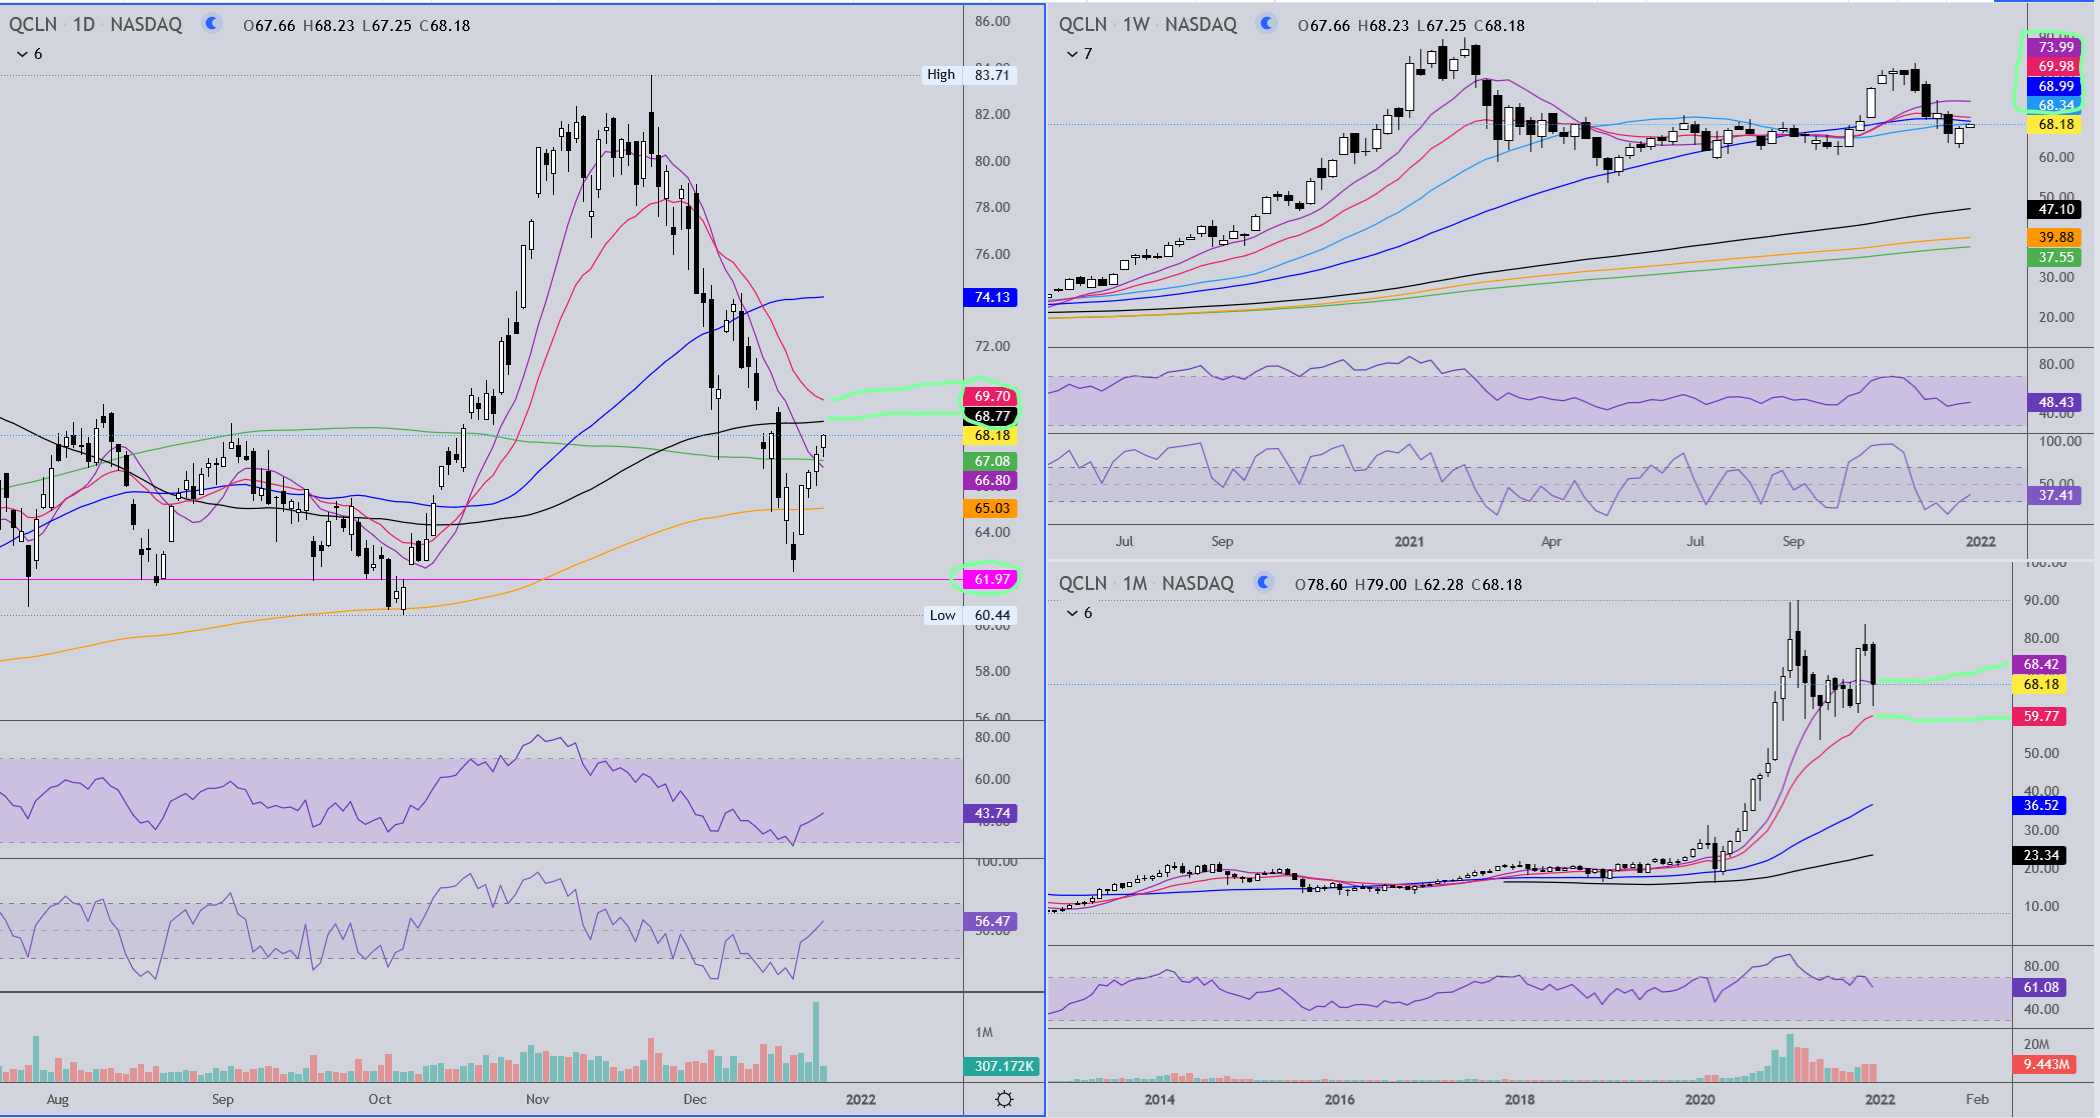
This one is very similar but a little better looking than TAN. Again see where it’s at with the MA’s on the monthly and weekly charts. On the daily it’s going to test the 130ma. See if it gets a close above that and holds for the next couple days. If it goes higher it needs to get above the 20ema and hold. If it gets rejected see what kind of retracement it does and if it finds support at the 50 - 61.8% levels, which would be right around where the 260ema is on the chart (it’s orange). The pink horizontal line is a gap that didn’t quite get filled at the recent low.
Right now I wouldn’t do anything with any of them. I would need probably another couple weeks to see if any kind of support is being established.
Thanks Rich. Watch list and patience on all three. Getting a list together and looking for opportunities when they arise.
1 Like
BKRRF/BRC
I have owned shares of BKRRF for about 8 months. In the past week it has been under some pretty decent accumulation, even yesterday with BRC closed to trading and today it’s had some decent bids this morning. I bought it as a technical play but I believe the company is looking to be acquired. There is an adam & eve formation which has played out to its target at .81, but the buyer(s) don’t seem concerned with that. My basis is about .733 and was hoping to buy more on a pullback, but so far it’s not looking like I’ll be able to lower my basis.
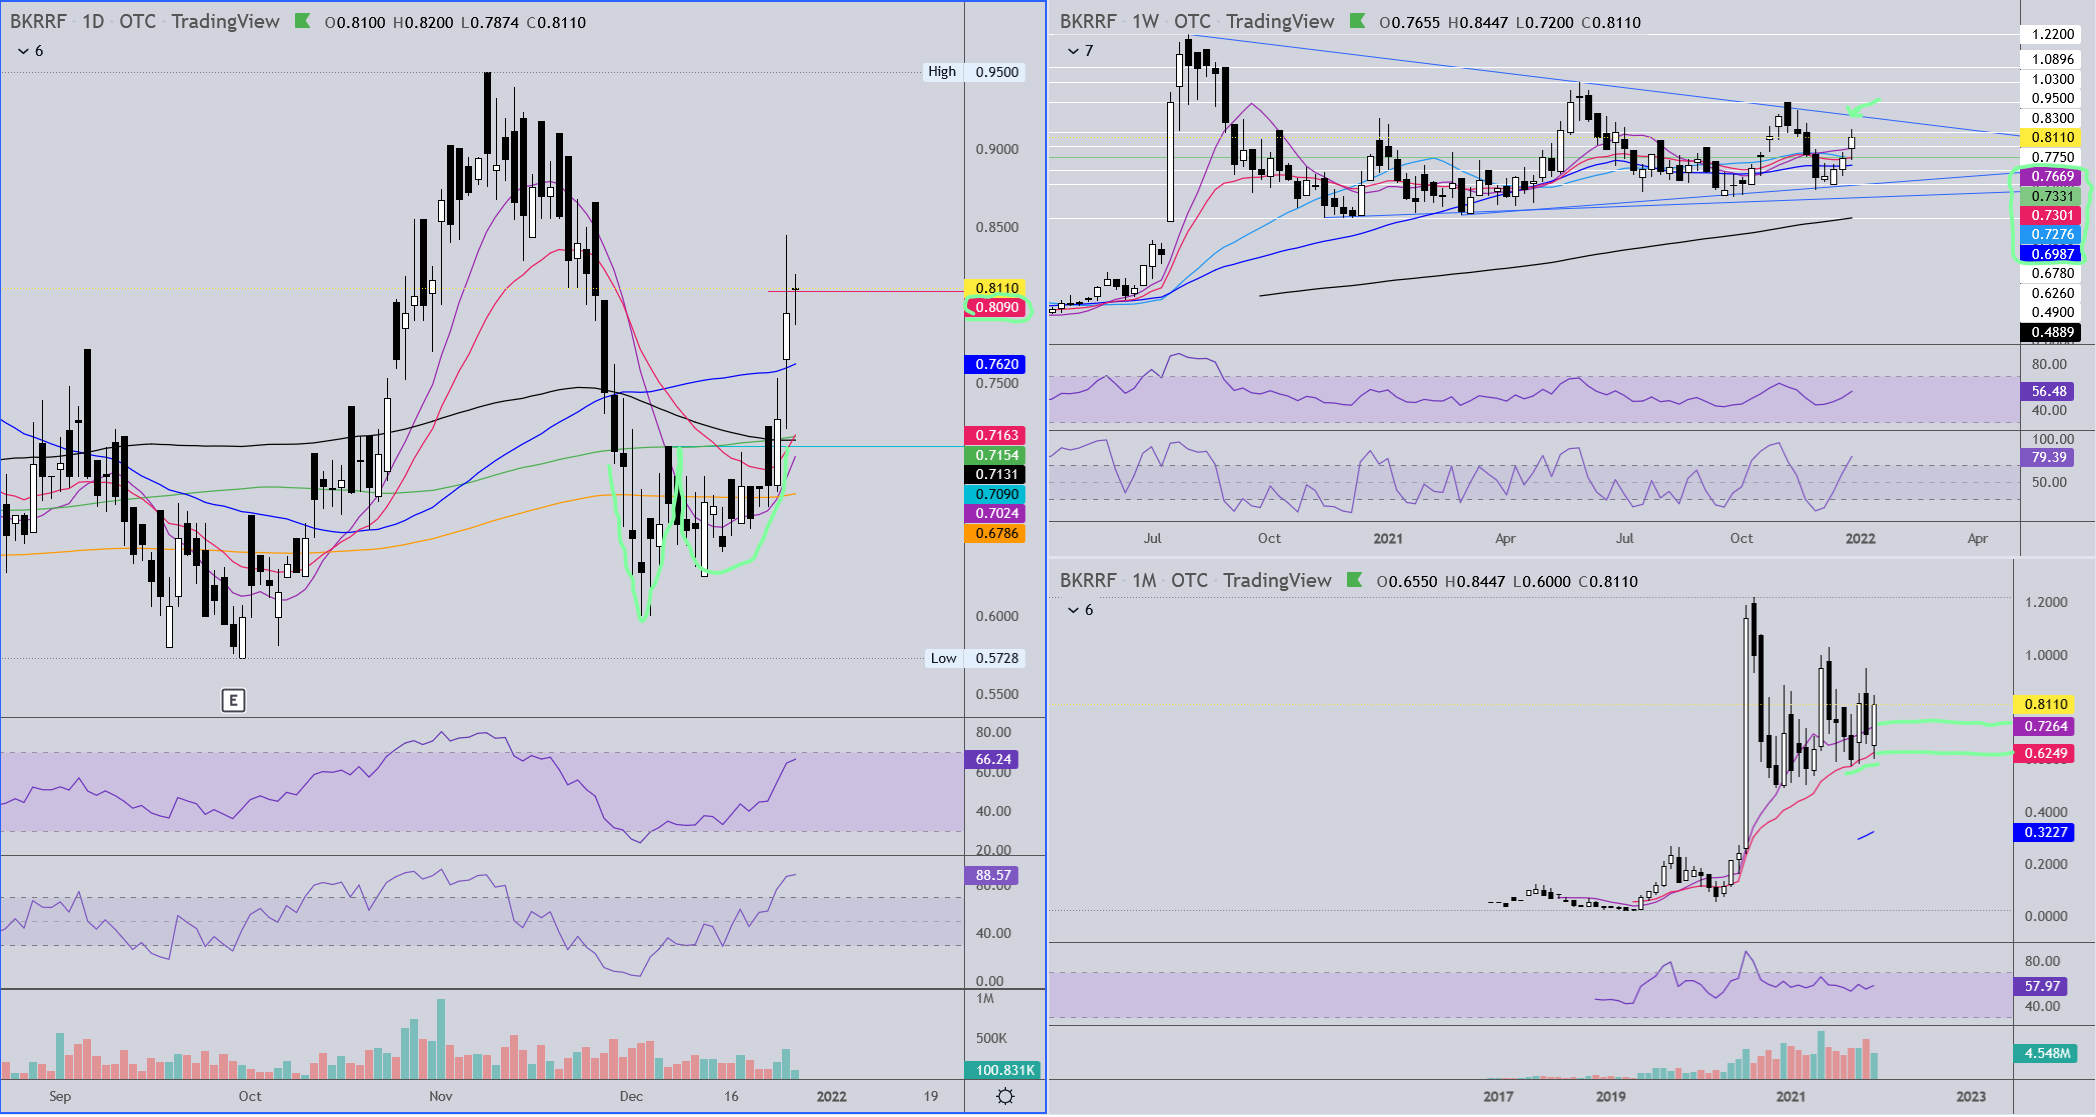
On the monthly chart, lower right, the stock has held the 20ema for support like a champ and is now in a resistance zone between about .81 - .86. On the weekly chart I have some horizontal resistance lines drawn, but at this point I’m thinking the stock could move up to the downtrend line. If it gets there this week then it will find resistance there at about .8965. If a breakout should occur this week of the long pennant formation then the target price would be 1.63.
On the large daily chart an adam & eve has already played out to fruition, but there is still a buyer of size that has been on the bid on and off for the past two days. I wish I had noticed that formation as it was forming but I haven’t been paying a lot of attention to my mining stocks for a few months. If the buying should dry up and the stock pulls back, support could be found at the 50ma around .762, and then lower in the .72 - .68 range. I expect .72 area would be solid support.
1 Like
NVO/NSRPF
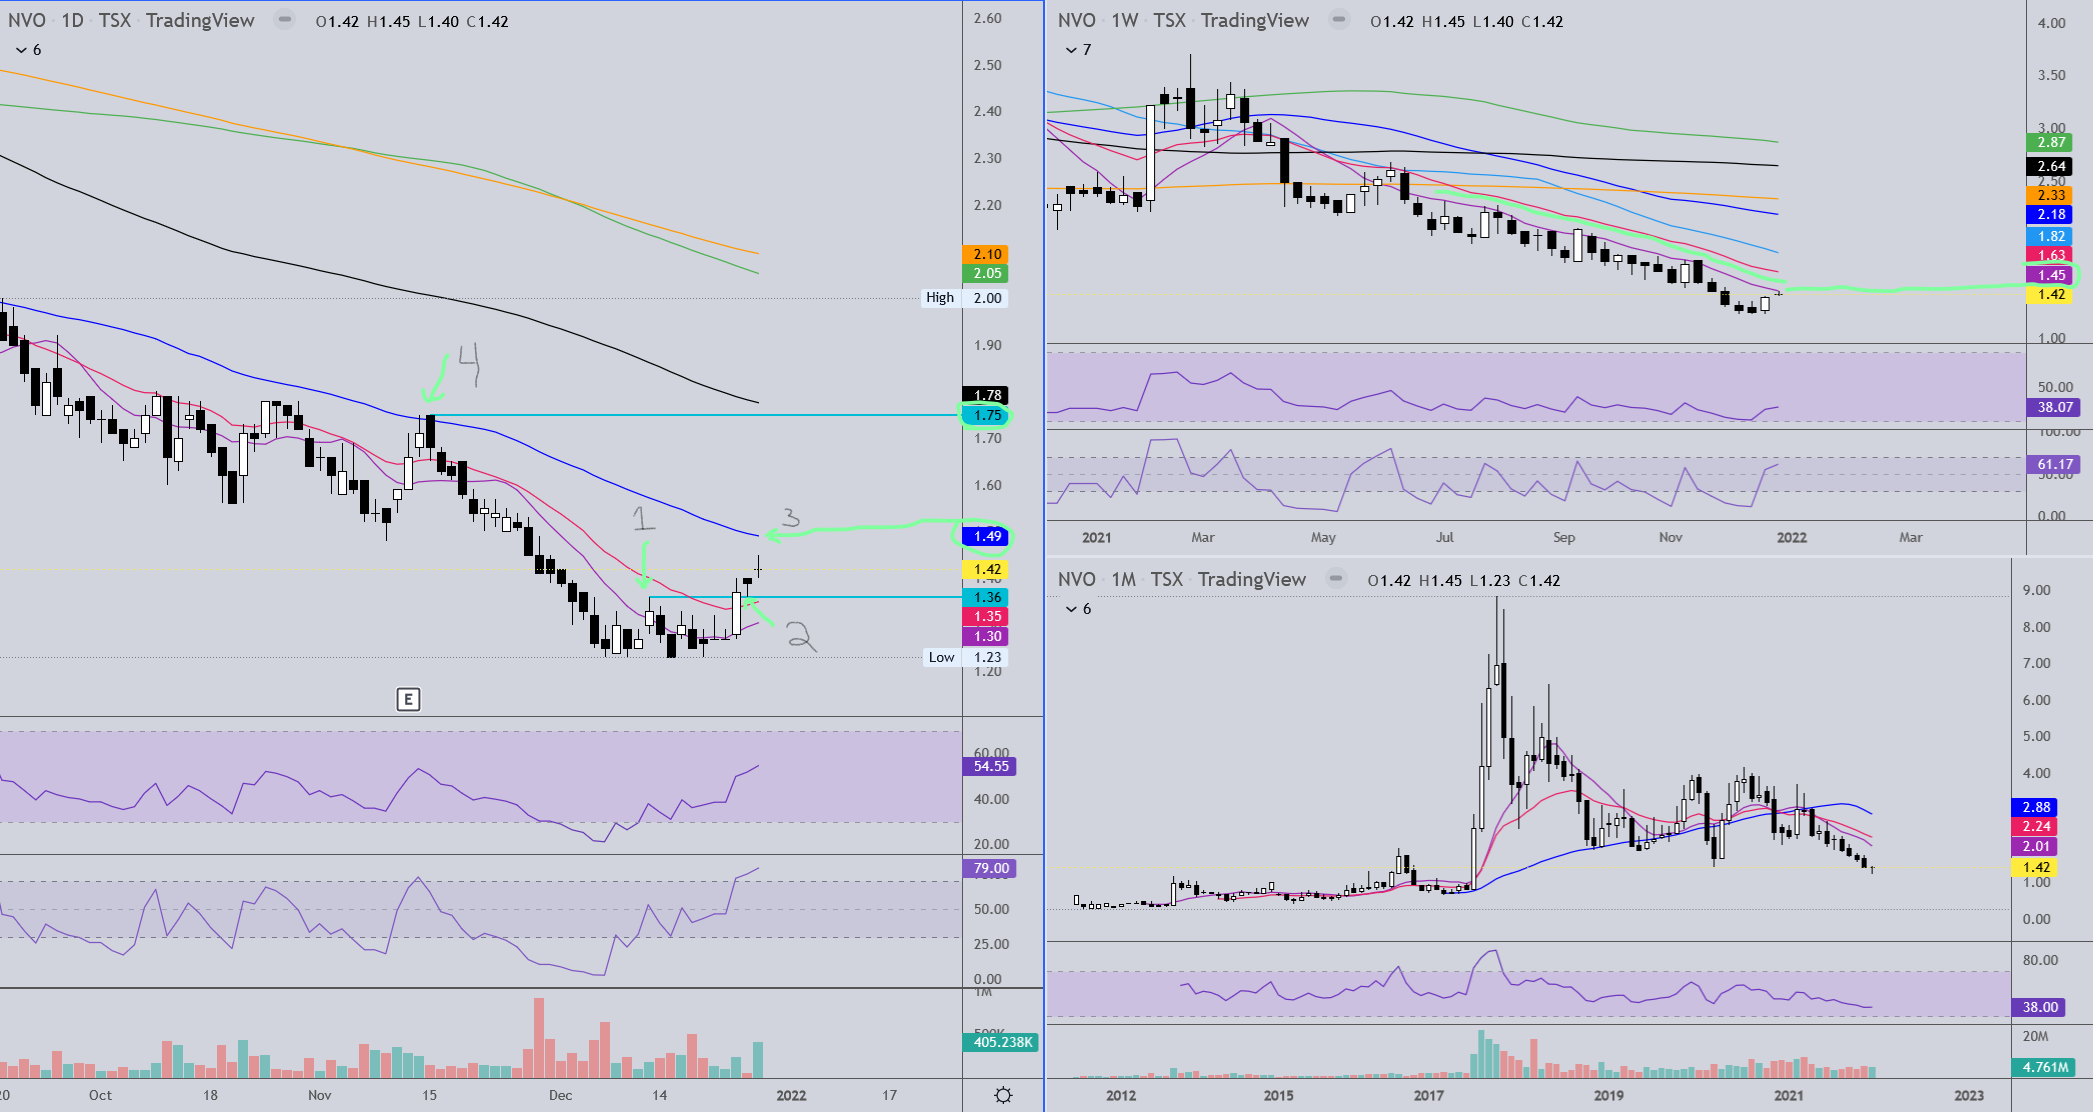
The weekly chart is on the upper right. There is not much new there. We want to see a move above the purple 10ma and red 20ema and life will be a lot happier for NVO investors. Now for the better news… The daily chart on the left is showing some early signs of a reversal now. During the formation of what at this time appears to be a double bottom NVO made a swing high (1) of 1.36. From there the low was retested and held as support. Next we had a fairly large bullish candle on decent volume that pushed through the prior 1.36 swing high and closed a tick above it. Then we got follow through the next day, although on very low volume and little price movement, but the 1.36 level held as support (2). Wednesday we made a higher high to 1.45 on very nice volume. It would have been nice to get more price action and at least tested the blue 50ma (3), but we are in a holiday period with a lot of people out of the market until next year. Now ideally the 1.36 support will continue to do its job and we get a close above the 50ma. It won’t take but a week with price above it for it to start flattening out then turning upward. Then we need to get to the next swing high at 1.75 and get above that, and while we’re at it that black moving avg. For me, when we get above that MA especially, NVO will be back on the bull.
I posted a list on Other Mining Stocks 2022 that I hope folks will find interesting enough to comment on.
Looks like lots of chart fodder there! 
I’m going to re-post it here for easy access…
Speculative Stocks
(watchlist – add on opportunity)
| Stock | P/E | Mkt Cap |
|---|---|---|
| BKRRF | -3.22 | 48.2M |
| DOLLF | -10.3 | 44.6M |
| GPL | -5.35 | 78.9M |
| IRVRF | -14.9 | 63.2M |
| IVS.V | -13.51 | 27,2M |
| LTHHF | -23.1 | 127.4M |
| MLLOF | -5.47 | 8.0M |
| NRGOF | -3.57 | 10.9M |
| SKE | -5.23 | 652M |
| SLVRF | -21 | 70.7M |
| ESKYF | -17.5 | 326M |
| LAB.V | -26.5 | 71.3M |
| NKOSF | -27 | 56.4M |
| SSVR.V | -9.45 | 58.9M |
| SSVRF | -9.5 | 46.4M |
| RRSSF | 44.7 | 575.4M |
Stocks for Accumulation (Value? presently under 200 MA?)
| Stock | P/E | Mkt Cap | Div |
|---|---|---|---|
| ATUSF | 14.7 | 587M | 1.37% |
| BTG | 8.81 | 4.0B | 4.23% |
| FSM | 11.3 | 1.1B | |
| FTCO | 5.9 | 151M | 4.66% |
| GOLD | 16.7 | 33B | 1.4%% |
| JAGGF | 5.4 | 240M | 5.8% |
| NEM | 23.8 | 48.1B | 3.65% |
| NSR | 34.3 | 433.5M | 1% |
| RGLD | 4.05 | 6.7B | 1.18% |
| VALE | 3.51 | 66.8B | 19.8% |
Dividend & Spec?
| Stock | P/E | Mkt Cap | Div |
|---|---|---|---|
| FUND | 2.89 | 253M | 8.70% |
| IBM | 26.7 | 124B | 4.60% |
| JBSAY | 4.75 | 14.8B | 8.70% |
| MMP | 11.41 | 10.1B | 8.70% |
| URA | 1.26B | 5.40% |
Wildcards (mostly full positions) long-term holds
AUMC
ARV.AU
KRRGF
MDMN
NFGC
OROCF
SAND
SKE
WPM
ELO/ELRRF
Pretty simple daily interval chart for ELO. Since last July most of the pullbacks that occurred went either to the orange 260 EMA or a well established trend line that is part of a long pennant consolidation that I expect will eventually be the launch point into the multi-multi-dollardom that is anticipated at some future point. Yesterday ELO dipped below the 260 EMA and closed above it. Same today and it closed nicely higher. Volume wasn’t great, but it didn’t suck either. In other good news, the 260 EMA is perfectly residing in the exact same price line as the 61.8% retracement of the range between the last swing high and low and, as a bonus, that also happens to be where a horizontal level of support exists. So this week ELO hit the support trifecta. Let’s see what it does with that next week. Happy weekending to all!

2 Likes
Thanks Rich, I should have had that one in my Spec list, Accumulate list and wild card long-term hold list…a trifecta as you’d call it! 