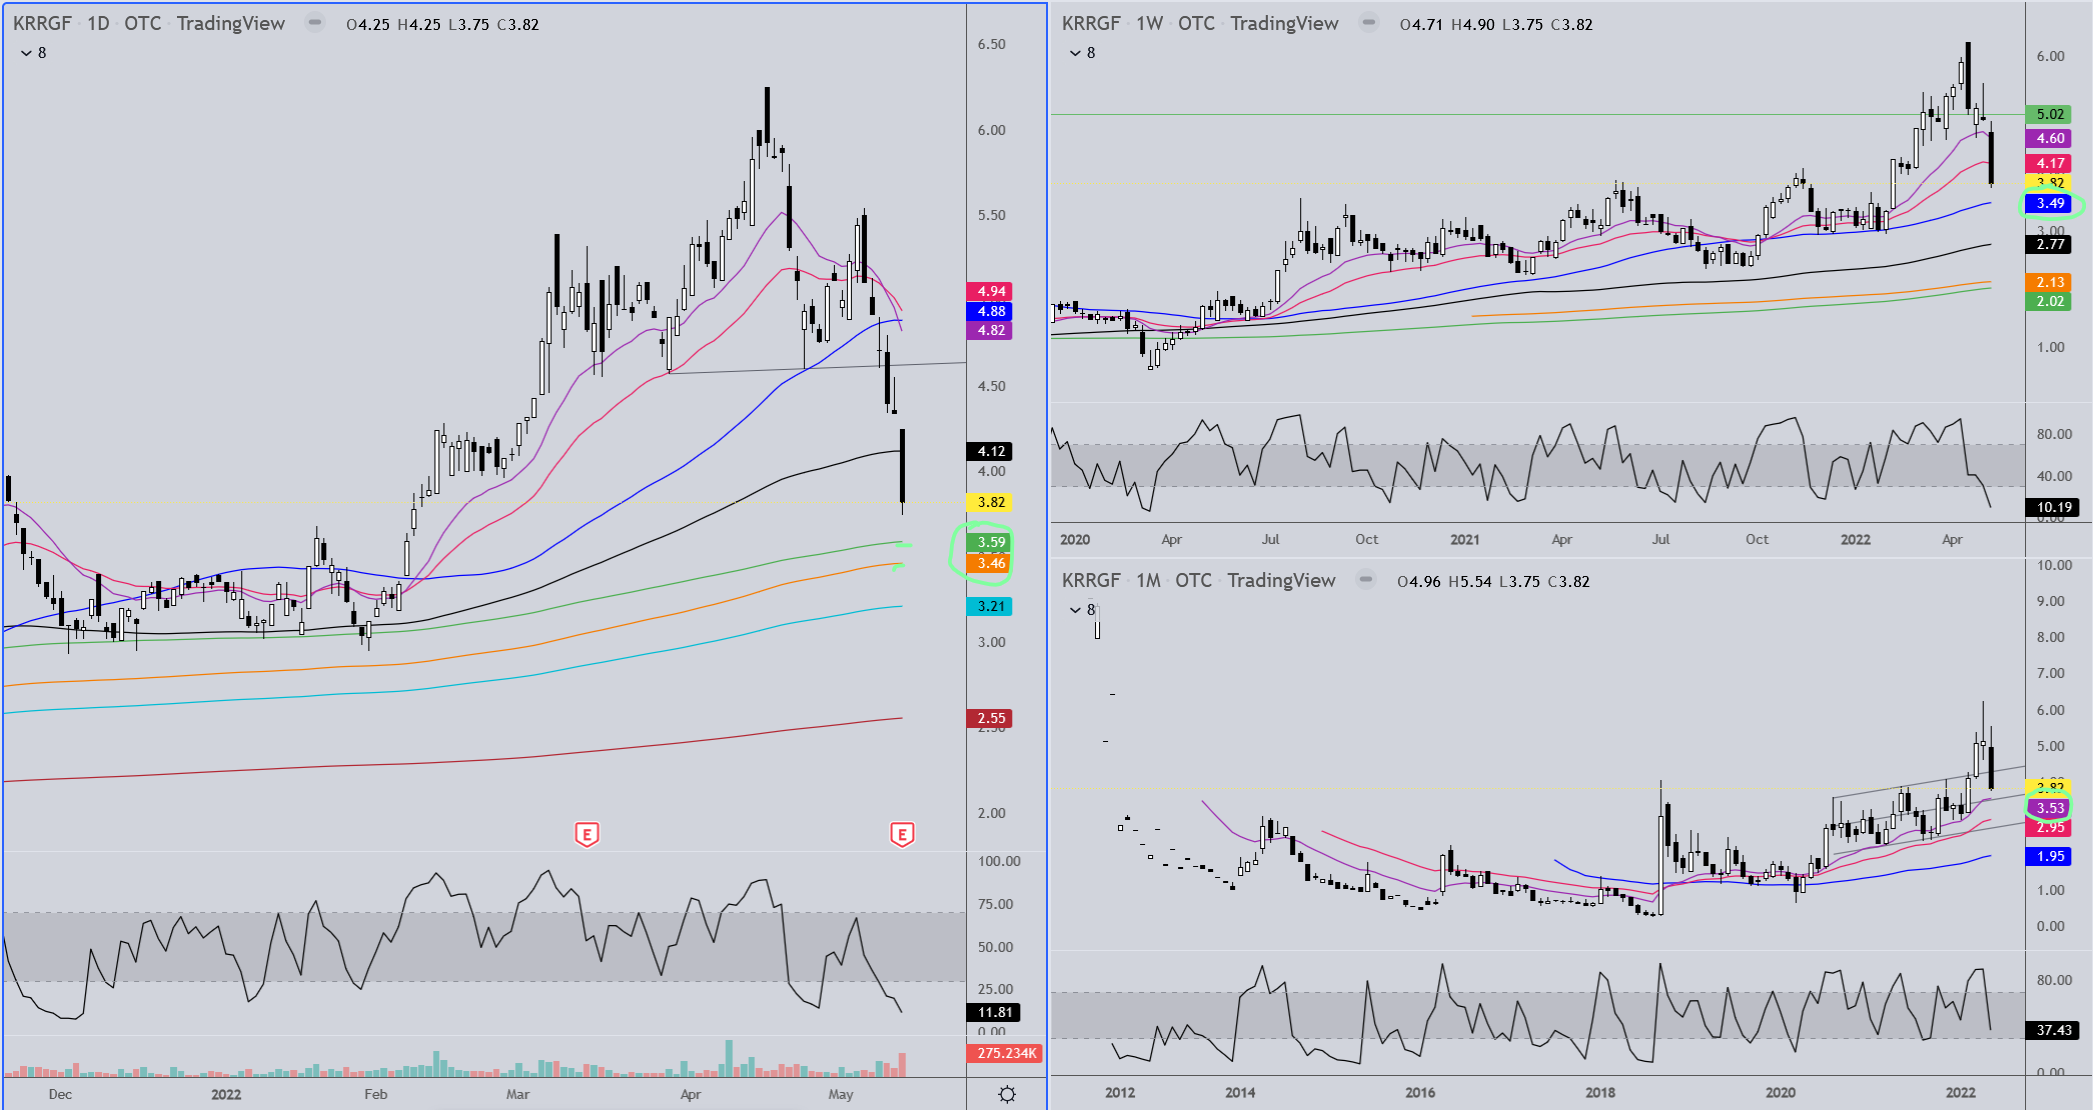
For KRRGF watch for support in the range from 3.60 - 3.46
For those interested or following Skeena:
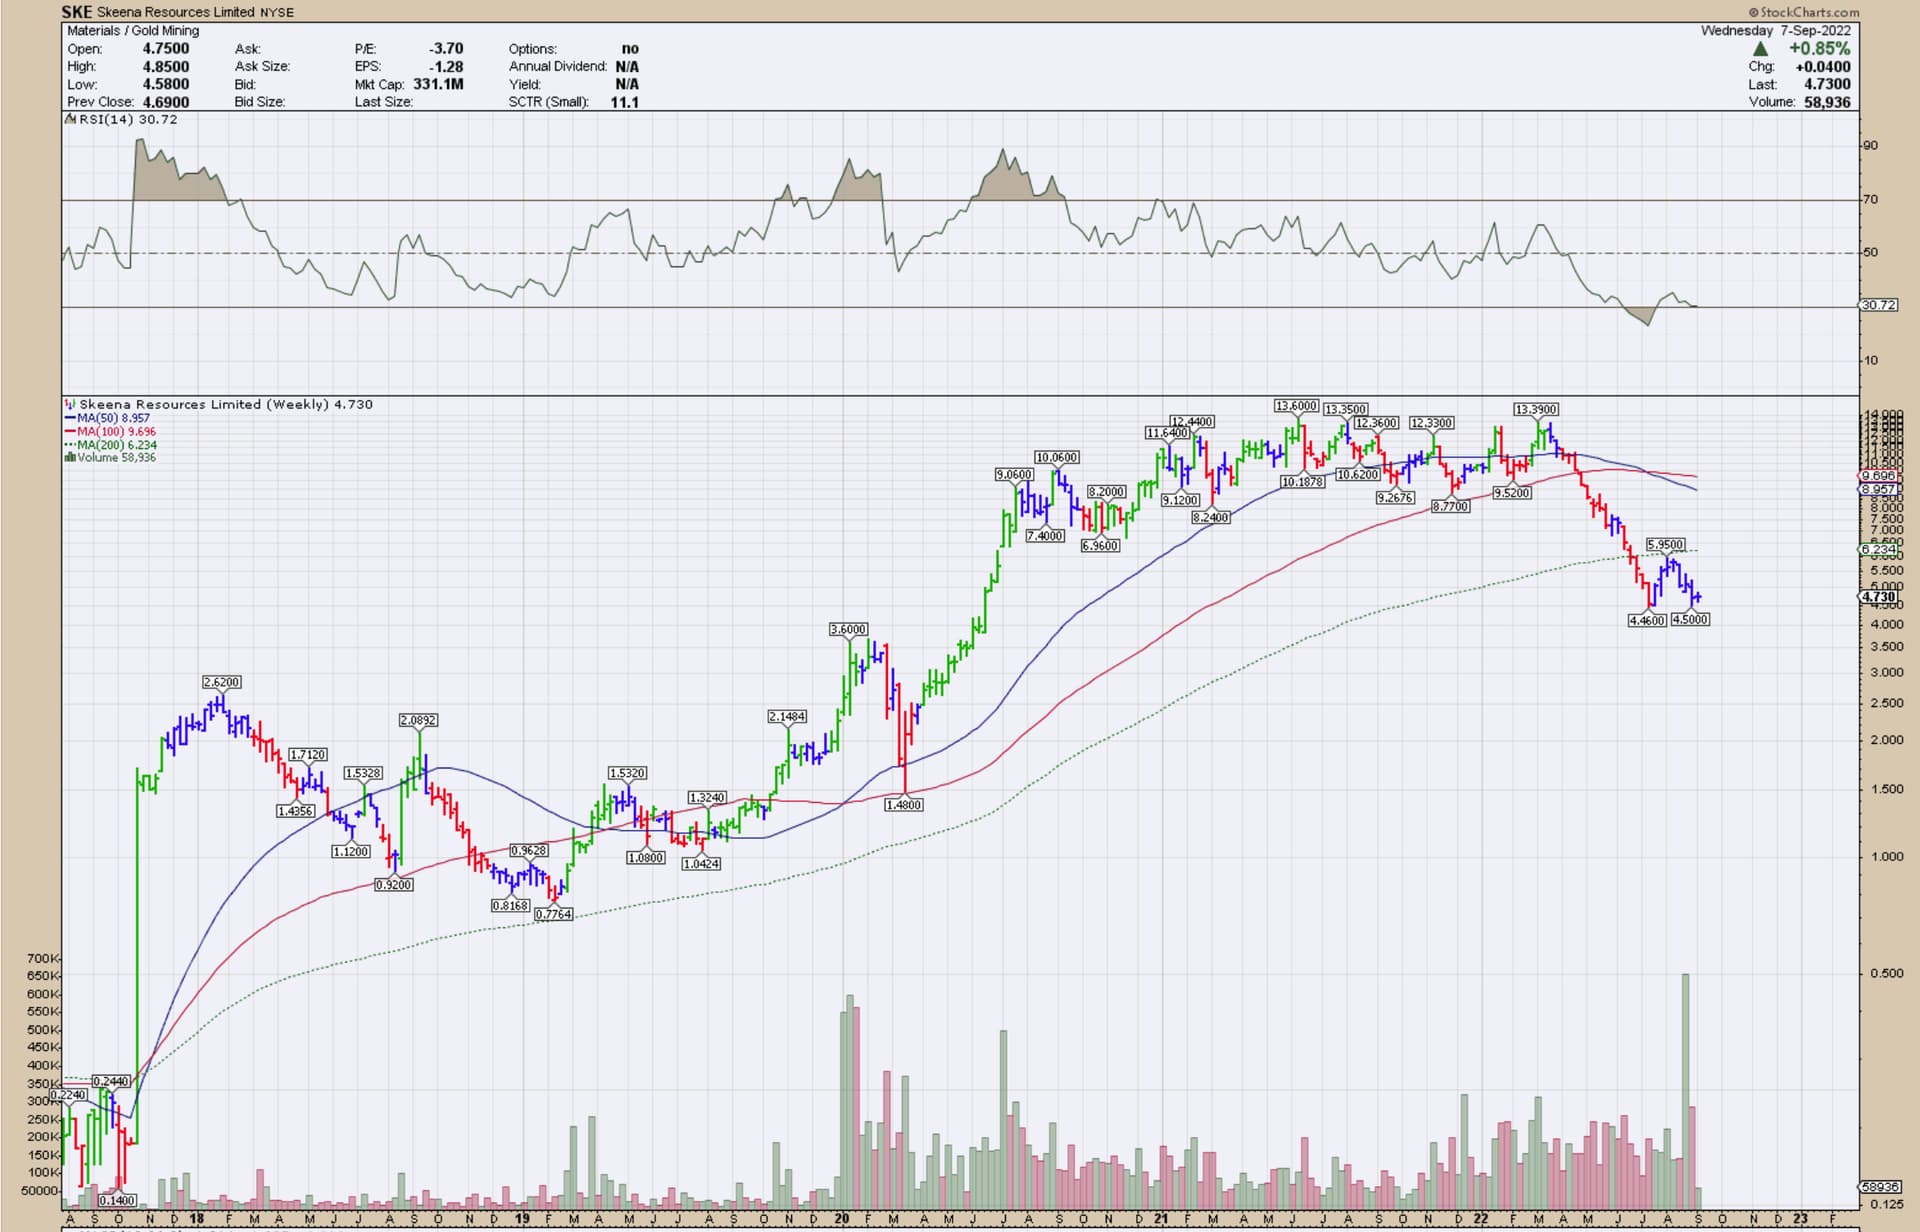
50% retracement from it’s Feb 2019, 0.77 low to previous highs in summer last year is approx. 7.25.
Hi TR,
Substantial news out this AM. Could you do a “quick chart” on NFG/NFGC to give some idea where we are at & what to expect?
1 Like
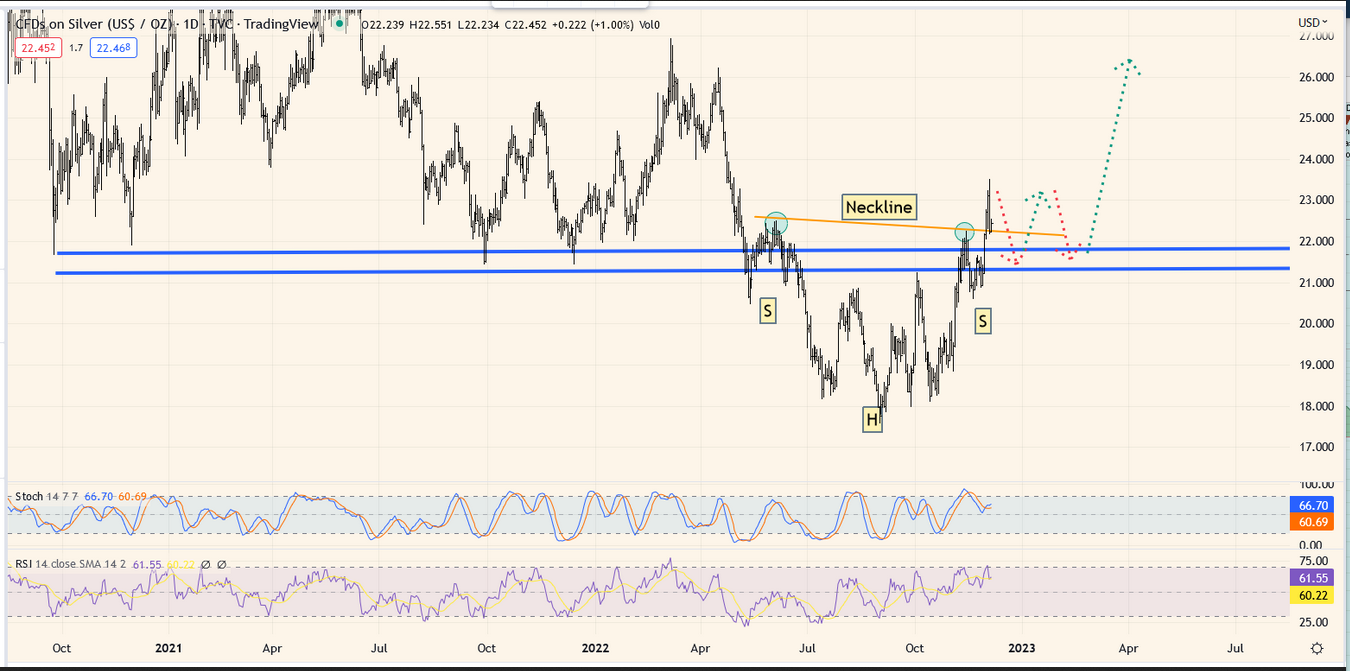
A couple of annotated charts, silver and gold miners, that may be helpful in determining which stocks you may want to invest/hold in upcoming months.
SILVER
GOLD

Note highlighted annotations to identify on stocks you may own.
GLTA
EZ
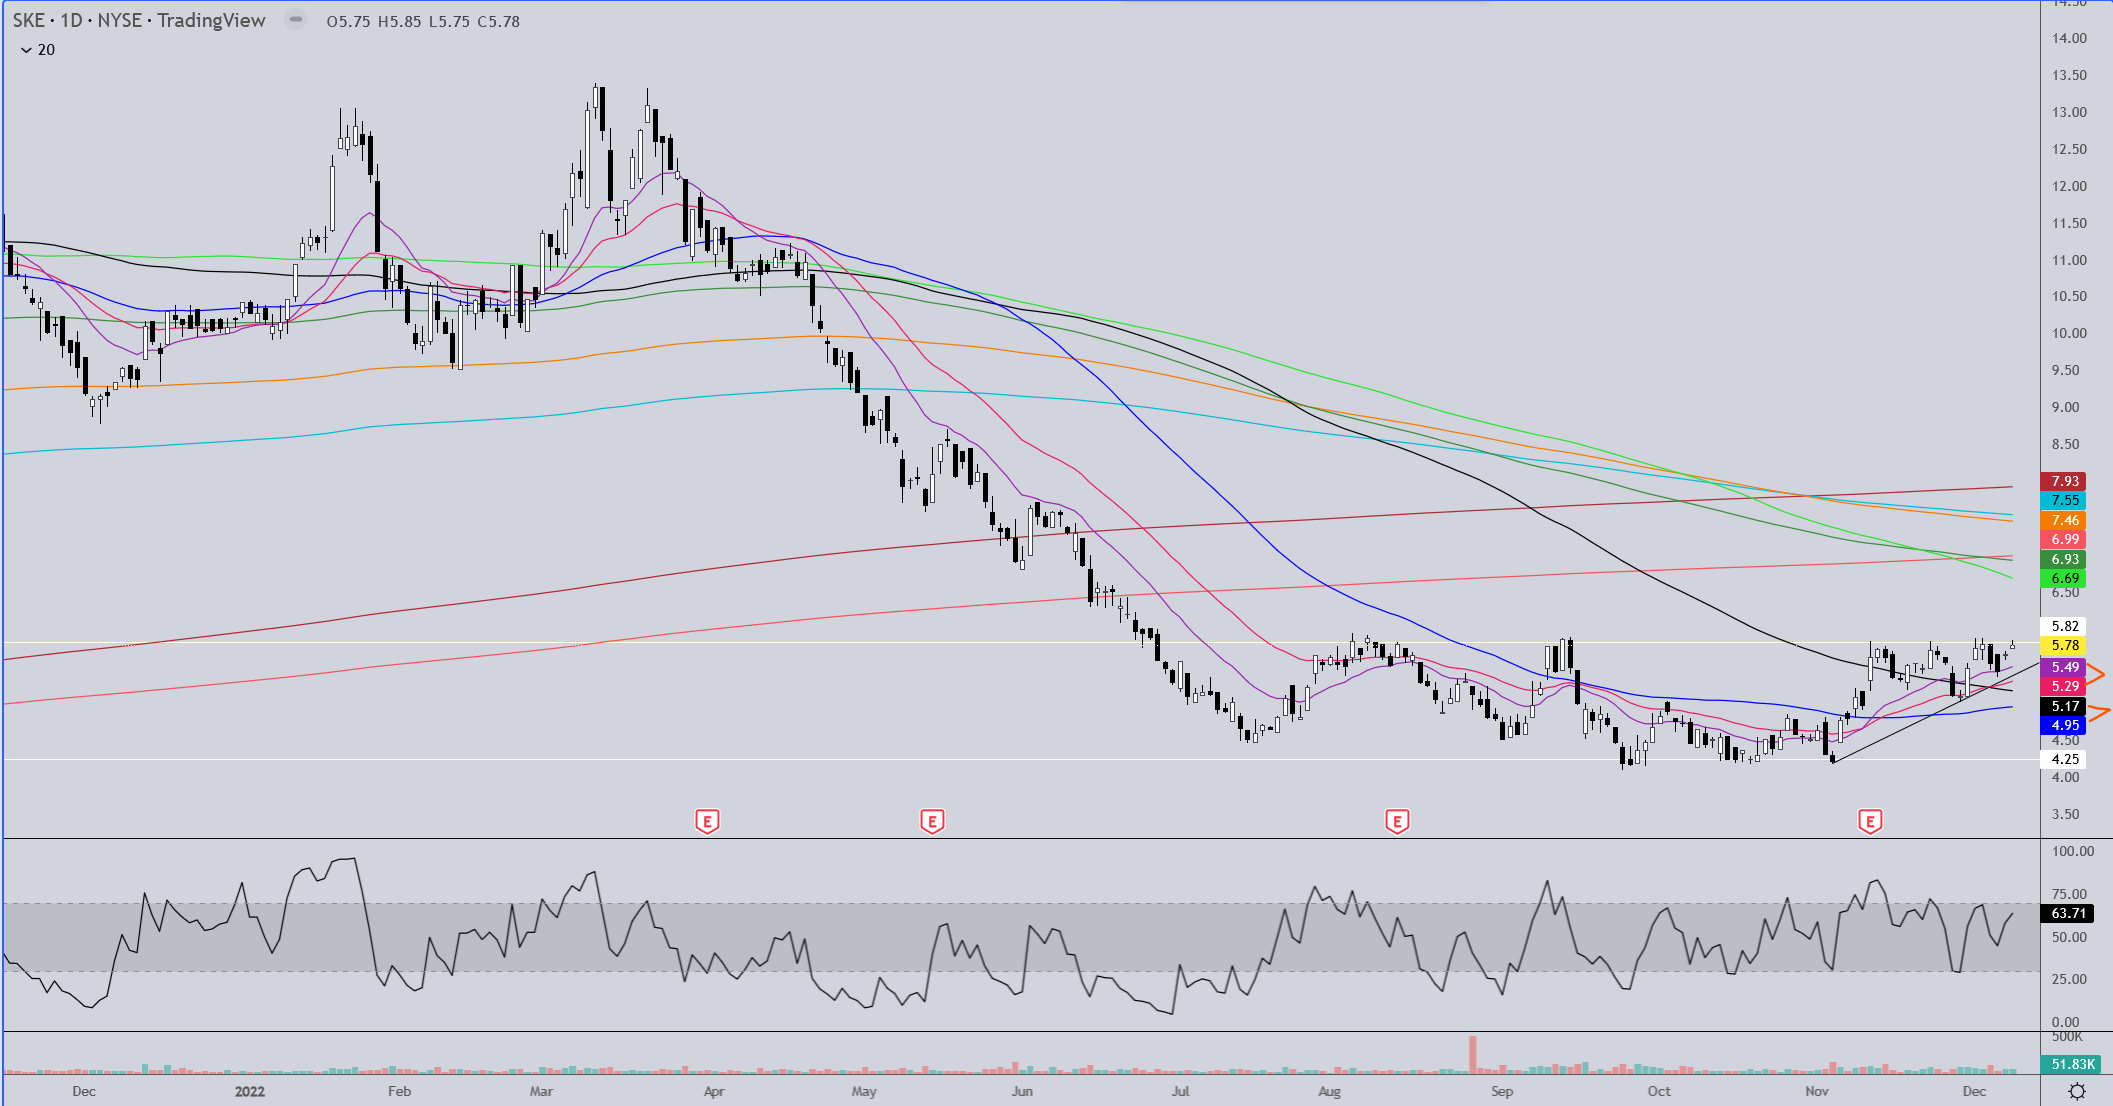
SKE looks like it may be getting ready to pop up out of a 6 month+ consolidation and a cup&handle formation. The breakout could happen any time between tomorrow and Dec 22nd, if it does break out. Target would take it eventually to the 7.40 area, which would be the 38% retracement of the drop that started in March from above $13.
2 Likes
Excellent analysis TR. That’s what I’m seeing too. Thanks.
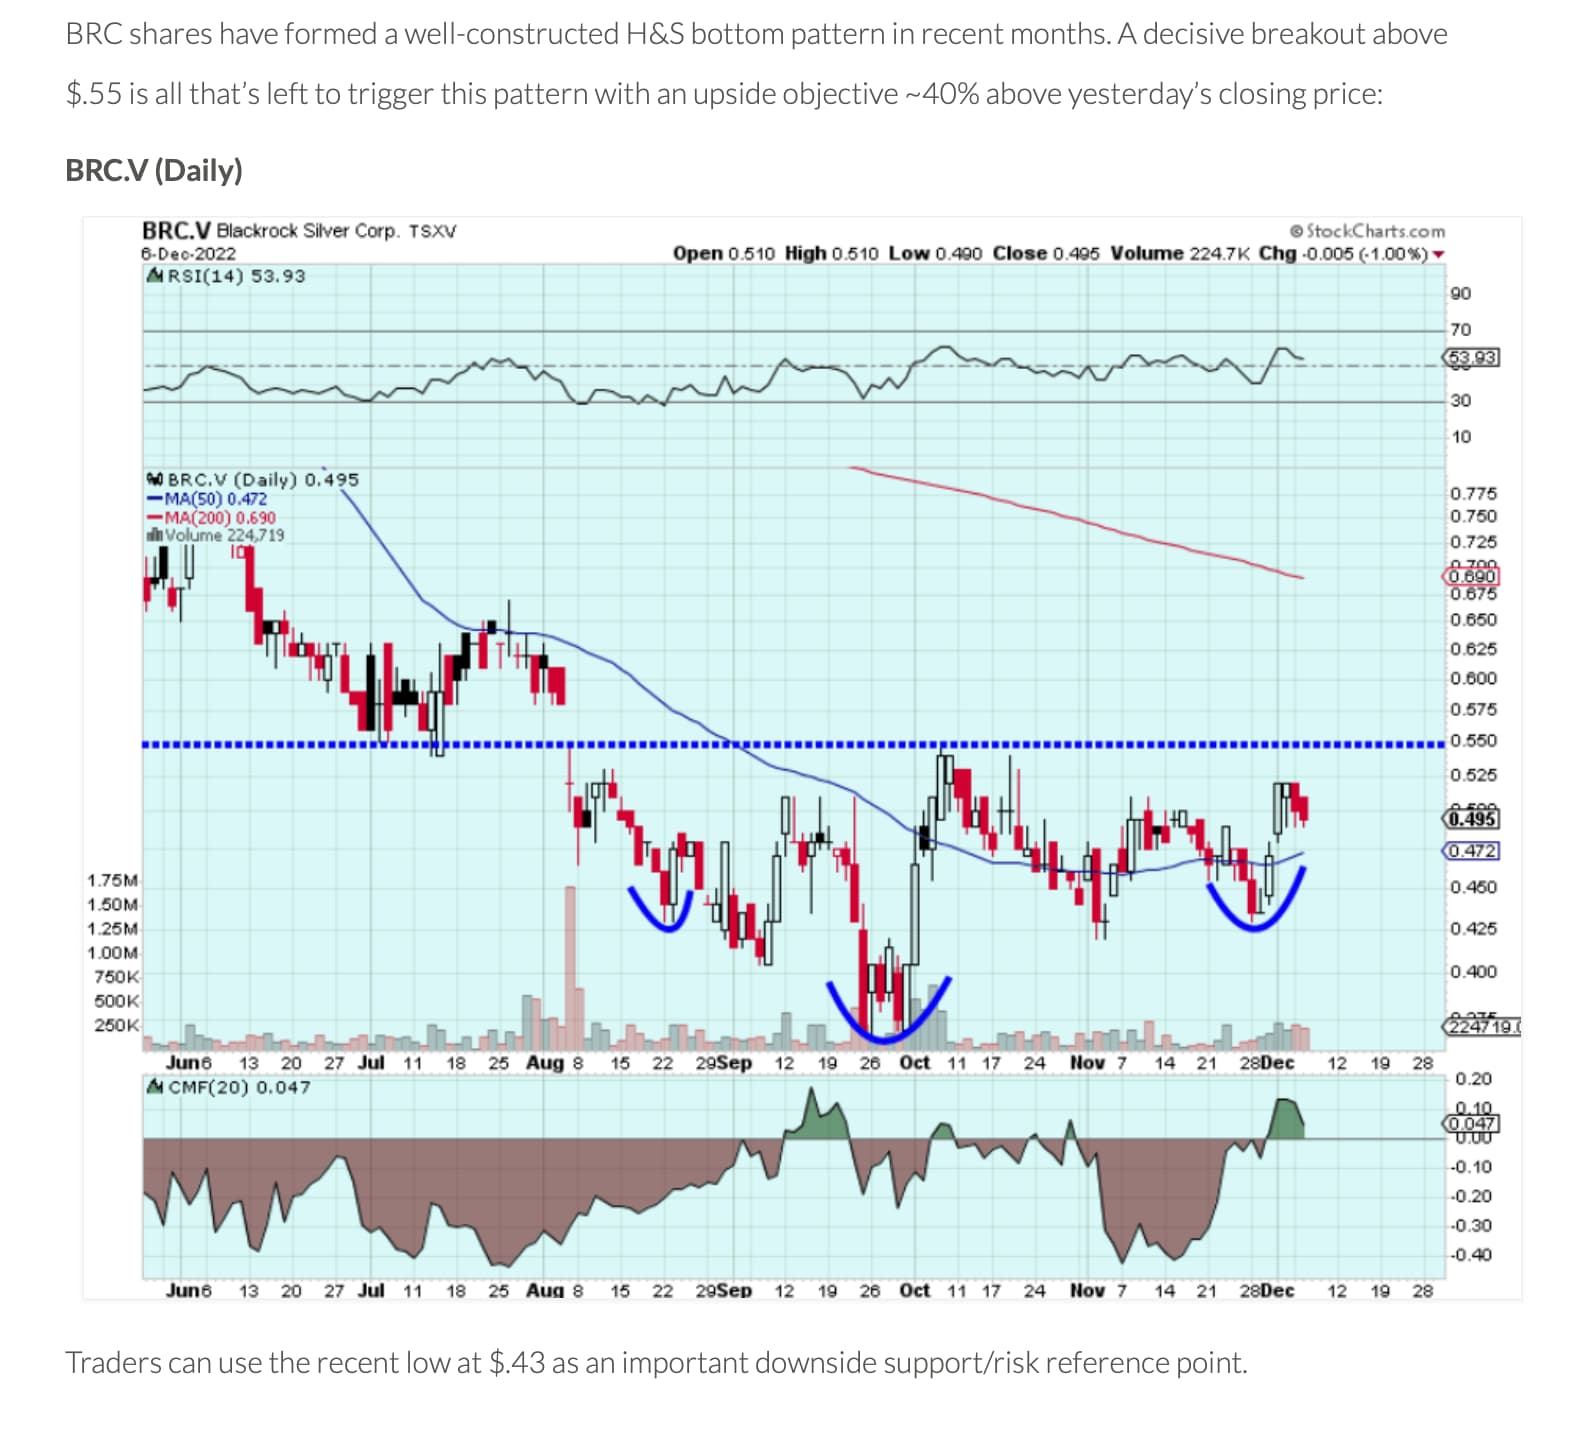
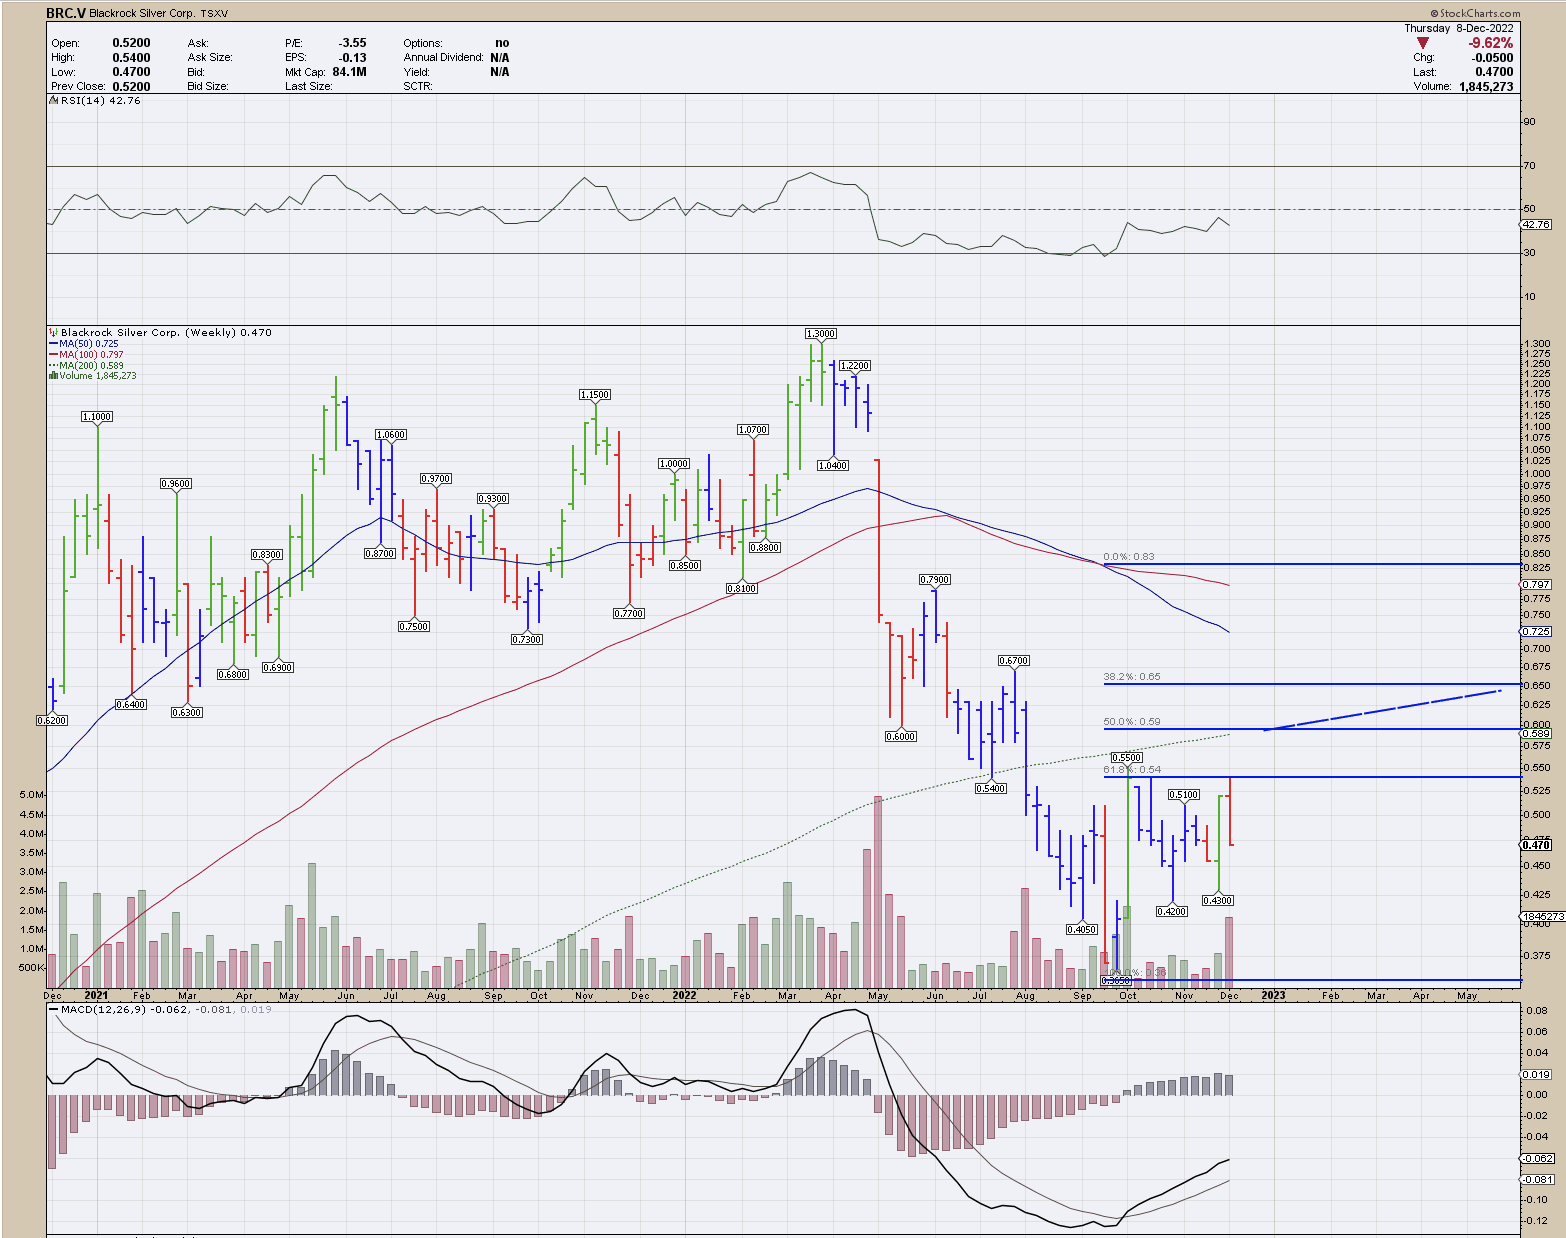
It’s interesting how the annotation BRC.V published shows an inverted H&S (with a smaller cup & handle forming on the daily chart) to the chart below. Since I primarily use a longer term weekly interval chart as I accumulate long shares, I did not identify this formation. In retrospect, a Fib retracement back to the 38% level using the 0.365 low and upper MA50/MA100 crossover as major resistance/breakout target, shows a current breakout level above 0.55, the same as stated in the the PR. A second major resistance level occurs at the 0.92 level with blue skies above.
From the recent PR link posted on the Other Mining Stocks 2022 thread:
I think keeping a close watch on both of these equities could be profitable near and long term.
NFG.V is getting quite interesting also, but may take longer to breakout. as they just completed a $50M bought deal.
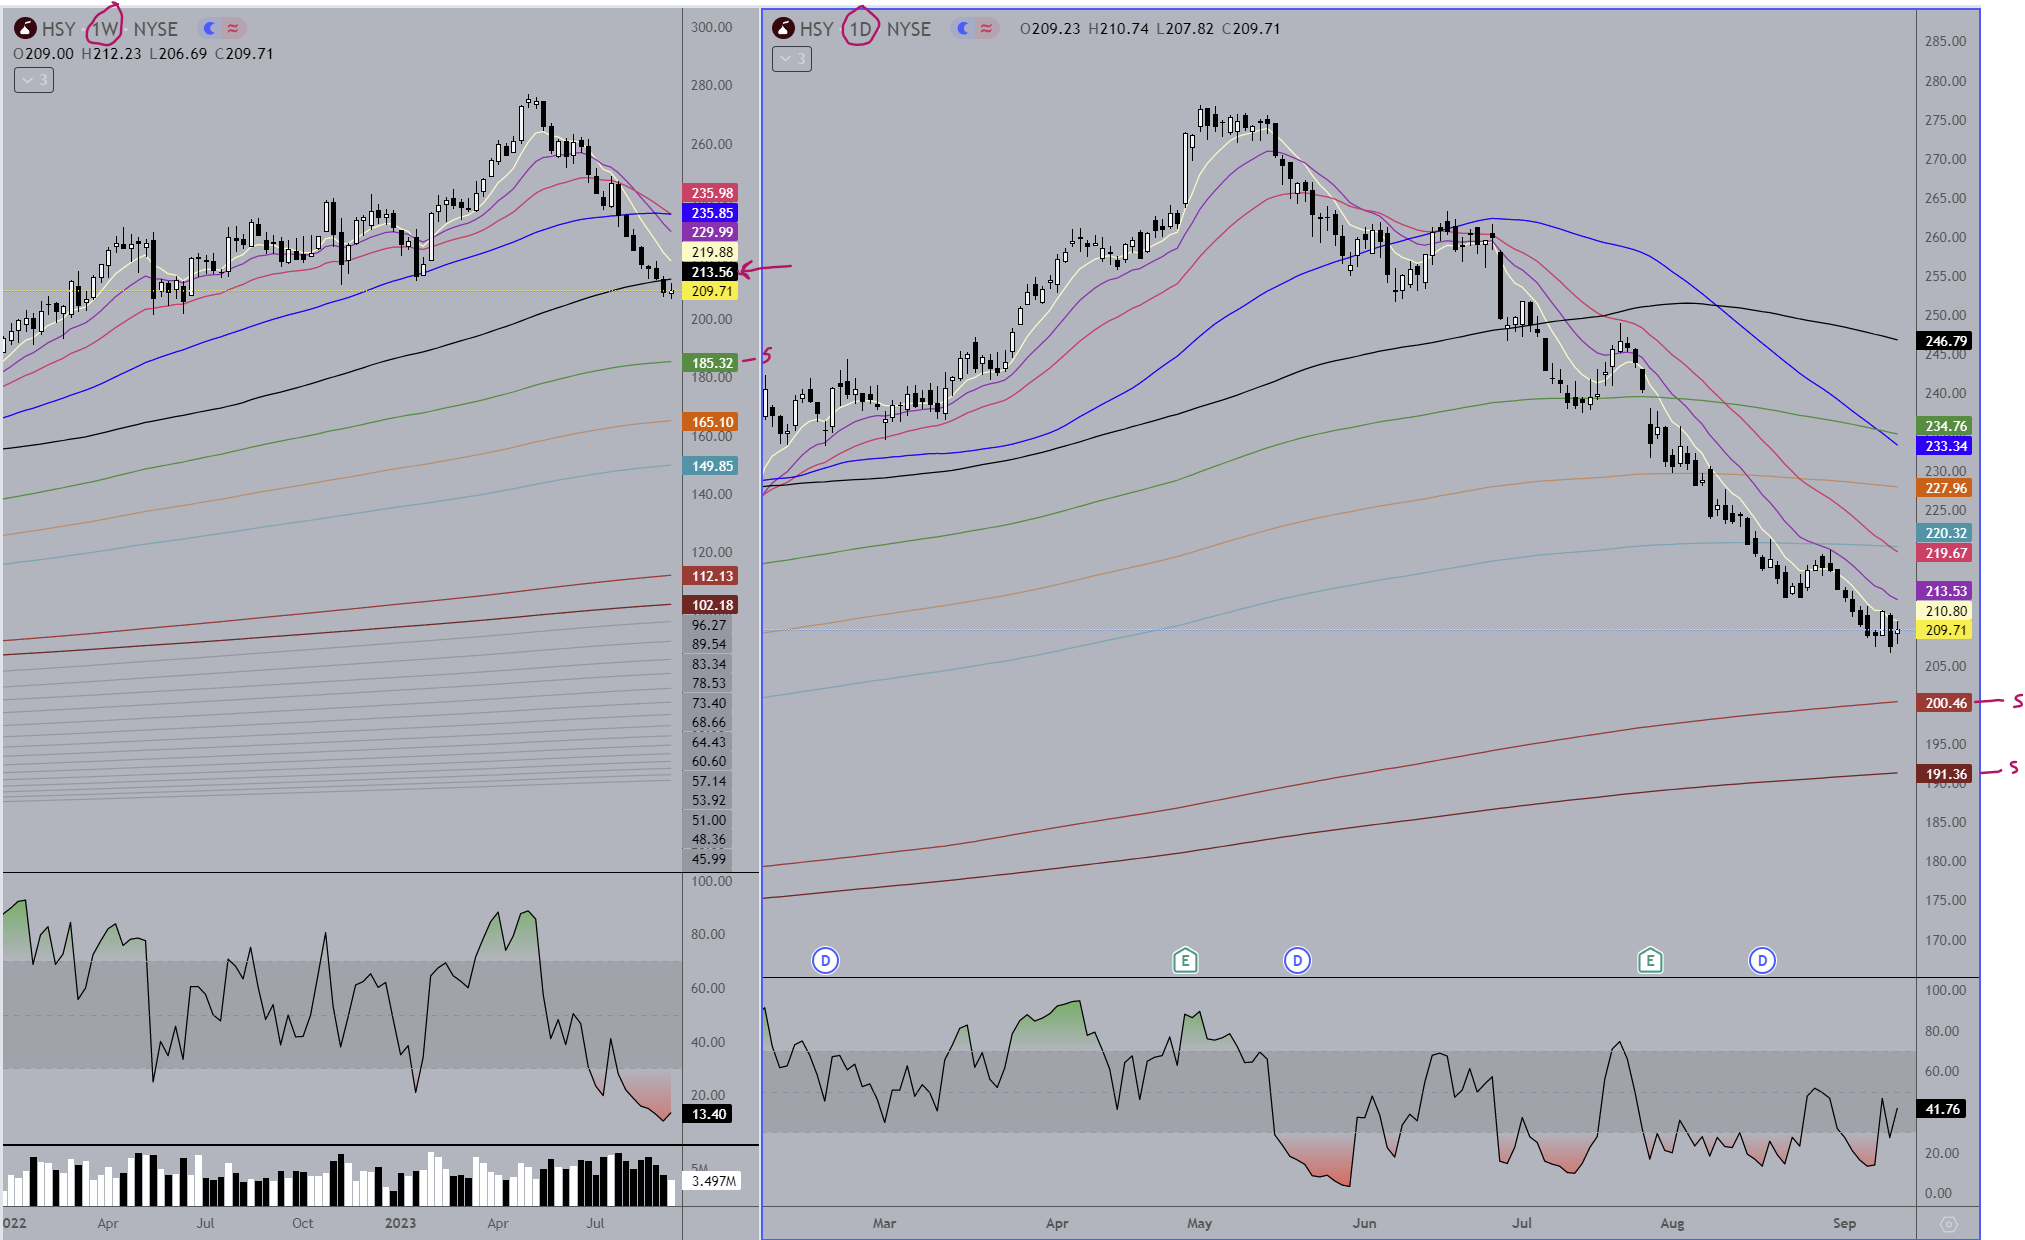
If anyone is interested, I thought I’d post some charts from time to time. This one was recently brought to my attention. The chart on the left is the weekly with the daily on the right. If the stock gets back above the black MA on the weekly that could be an early indication that the bottom is in. In the meantime, since it is below the black MA, watch the price areas of the two brown MA’s on the daily chart for support. If it goes below that, watch the green on the weekly.
The MA’s on these charts are the result of something I have worked on for most of my 24 yr trading career, and although there is nothing terribly special about them, they are not the normal MAs used and they work very well so I’m keeping them to myself until I am done with trading. Since I do intend to continue posting charts from time to time I will explain how I use them so that anyone viewing here has some understanding of what they are looking at. I’ll see if I can start a new thread for this…
1 Like