Thanks Rich, I really appreciate your analysis!
1 Like
AG
I have a couple of weekly intervals and a monthly that I think will be more useful than the daily. The first one is simply highlighting a potential inverted head & shoulders formation. Nothing more to say about it right now since we need to see if the right shoulder actually makes a right shoulder.

The second weekly interval points out a gap at 11.60 that will offer some resistance whenever the stock heads back up, along with two potential MA support areas at $10 and 9.57. If it should go lower the brown MA at 9.34 could be a support area, and then the downtrend line which is currently at about 8.75.

The monthly interval looks like it could be even more useful with potential MA support levels around 10.25 and 9.52. I looked at the SI futures chart and a potential bottom in silver lines up pretty well with the 9.50’s at the moment.

SAND Weekly
In regards to my comments last night on the hourly SAND chart… forget it, formation is no more.
On the weekly chart here are the price areas to watch for support:
7.44 - 50% Fib retracement
7.34 - Black MA
7.25 - Red MA
7.09 - Blue MA
7.03 - 61.8% Fib retracement
6.80 - Trend line support.

Keep in mind this is a weekly interval. If I were buying I’d want to see it drop to one of the three lower levels and buy my shares, but if this candle can have a nice push back up anywhere above the blue MA and hold that then I’m a happy camper.
RRSSF
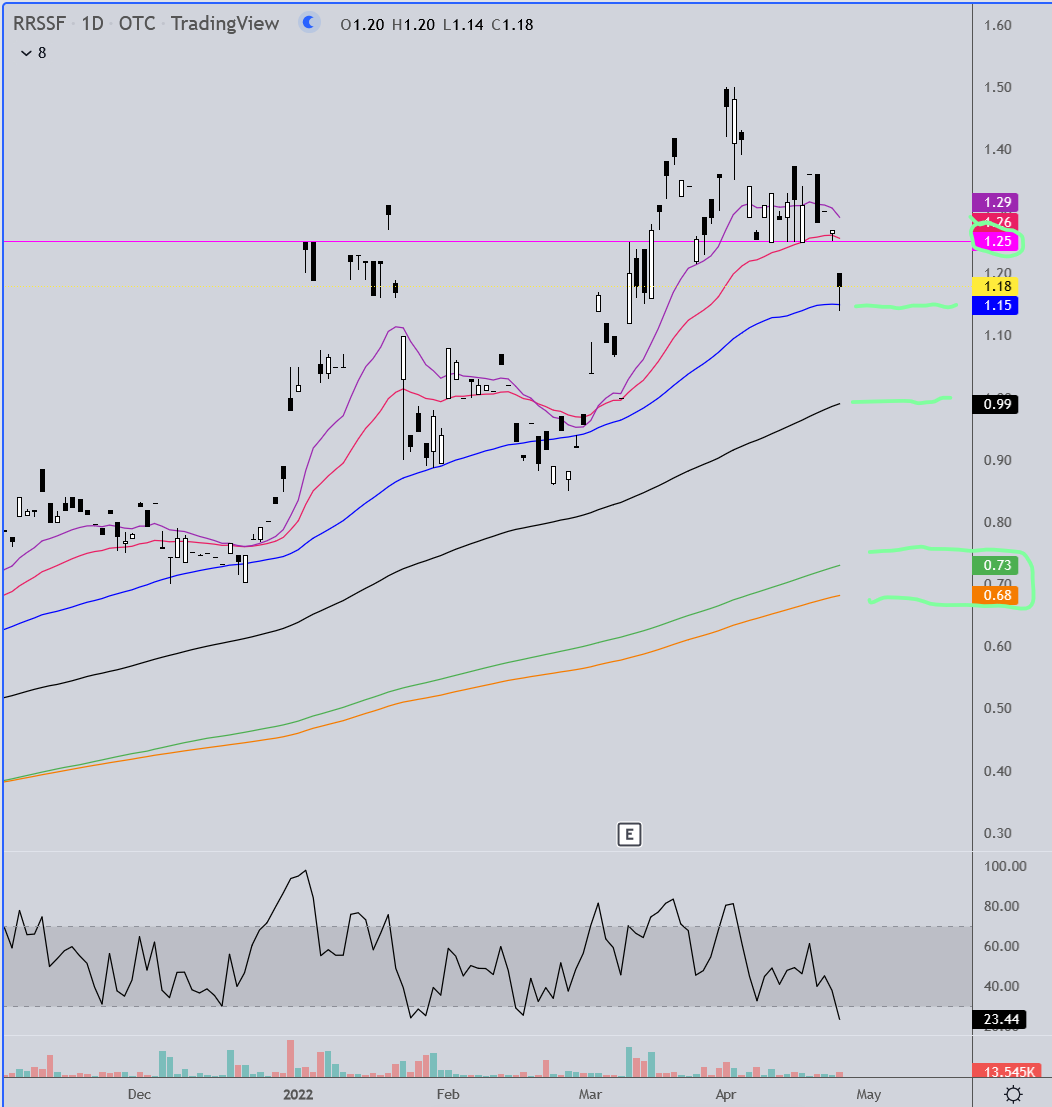
Very nice uptrend going on here holding the fastest two MA’s all the way up so far and very low volume on the dips. The fastest two MA’s, when acting as support, show a very strong uptrend. When a deeper pullback is needed due to overbought conditions the blue tends to be the support area as long as the trend remains strong. Both this and the daily chart right now are indicating the possibility of another push higher. If not, it’s headed to right around a dollar next.

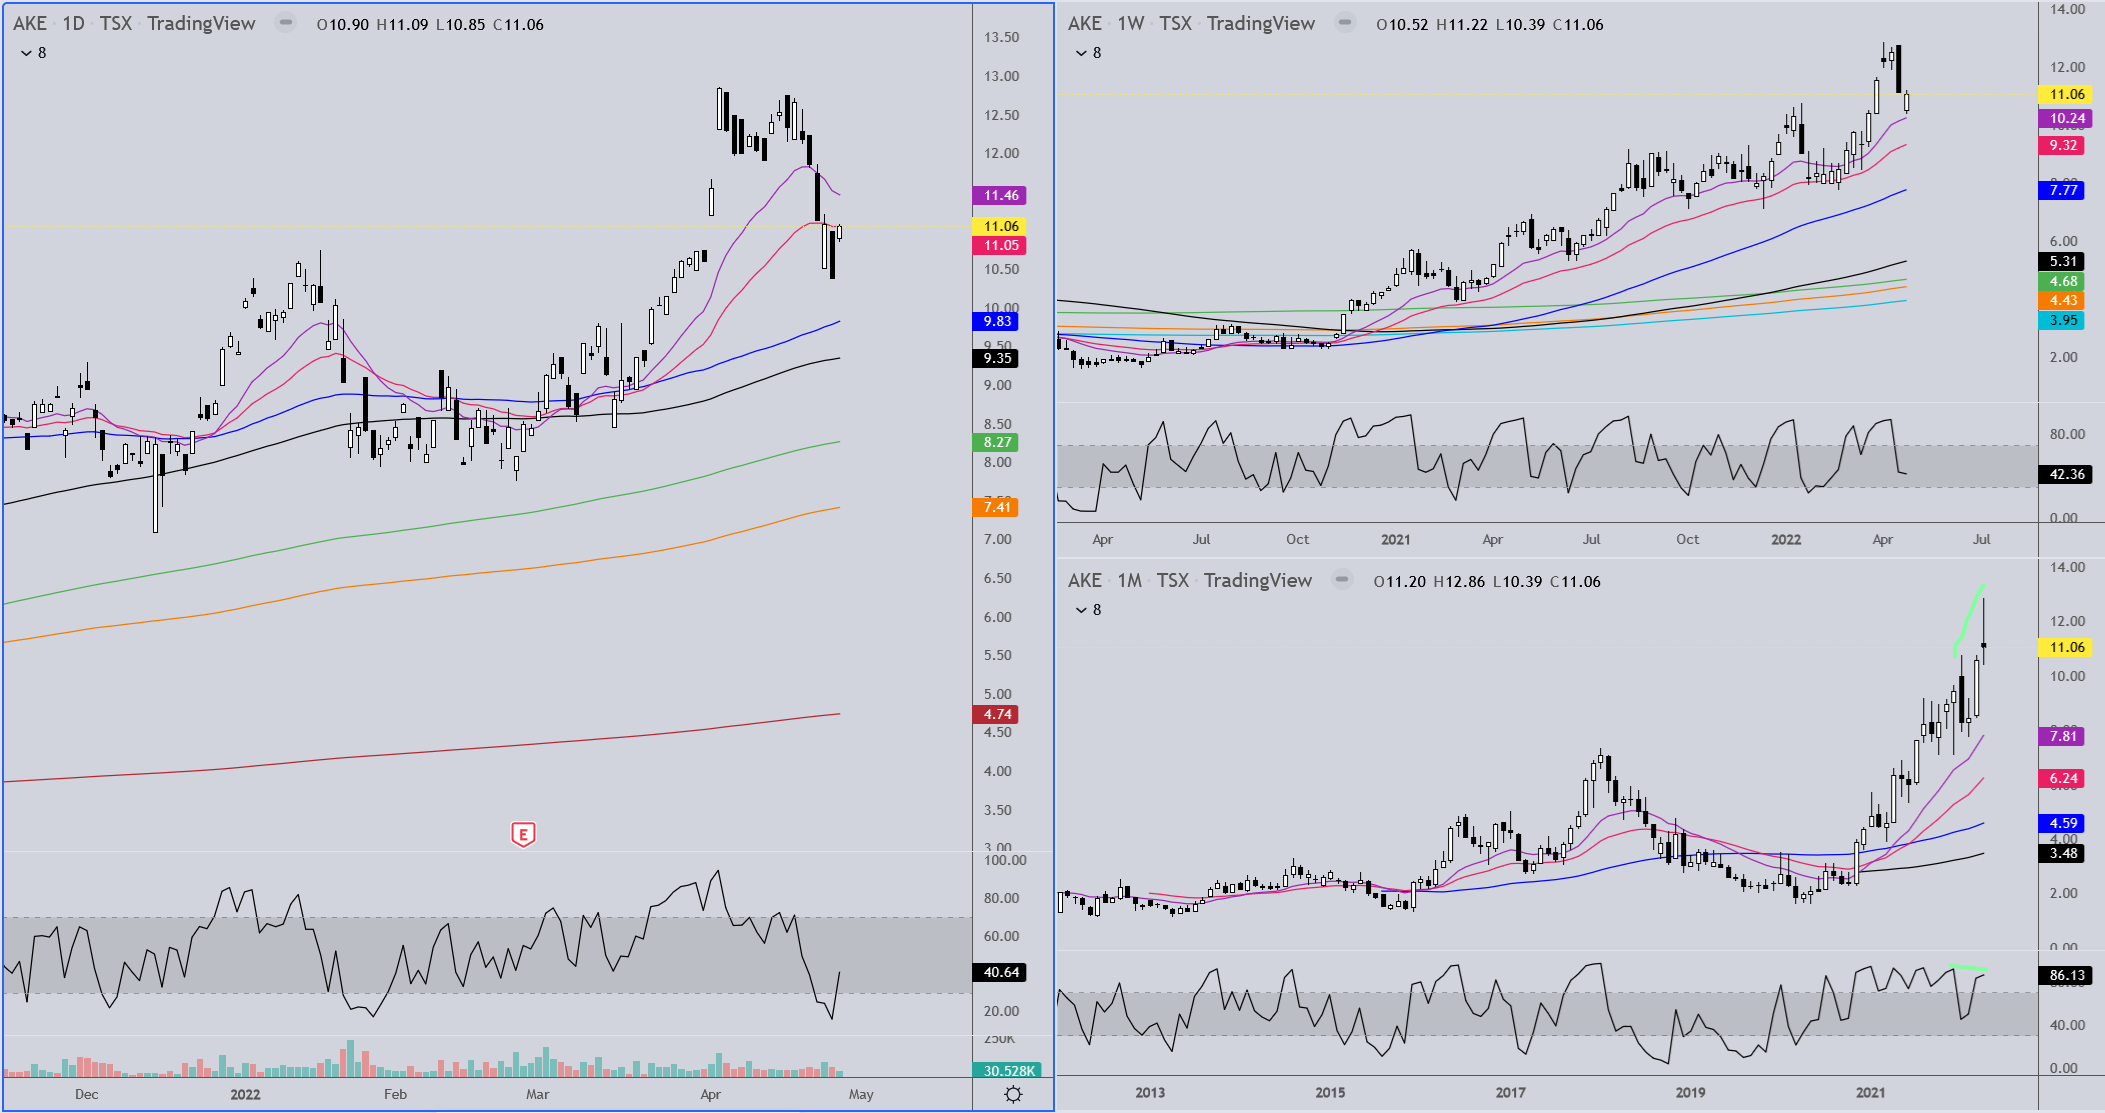
AKE Daily/Weekly/Monthly
The daily hit oversold yesterday and bounced on a “lap” up (a gap within the previous day’s trading range). It closed a tick above the red MA. Tomorrow should be telling. The weekly chart is showing a strong uptrend with the bounce off the shortest MA. The red has been dependable support for a long time. The monthly is so far possibly showing bearish divergence since price hit a new high but RSI did not, so keep that in mind when watching the other time frames.
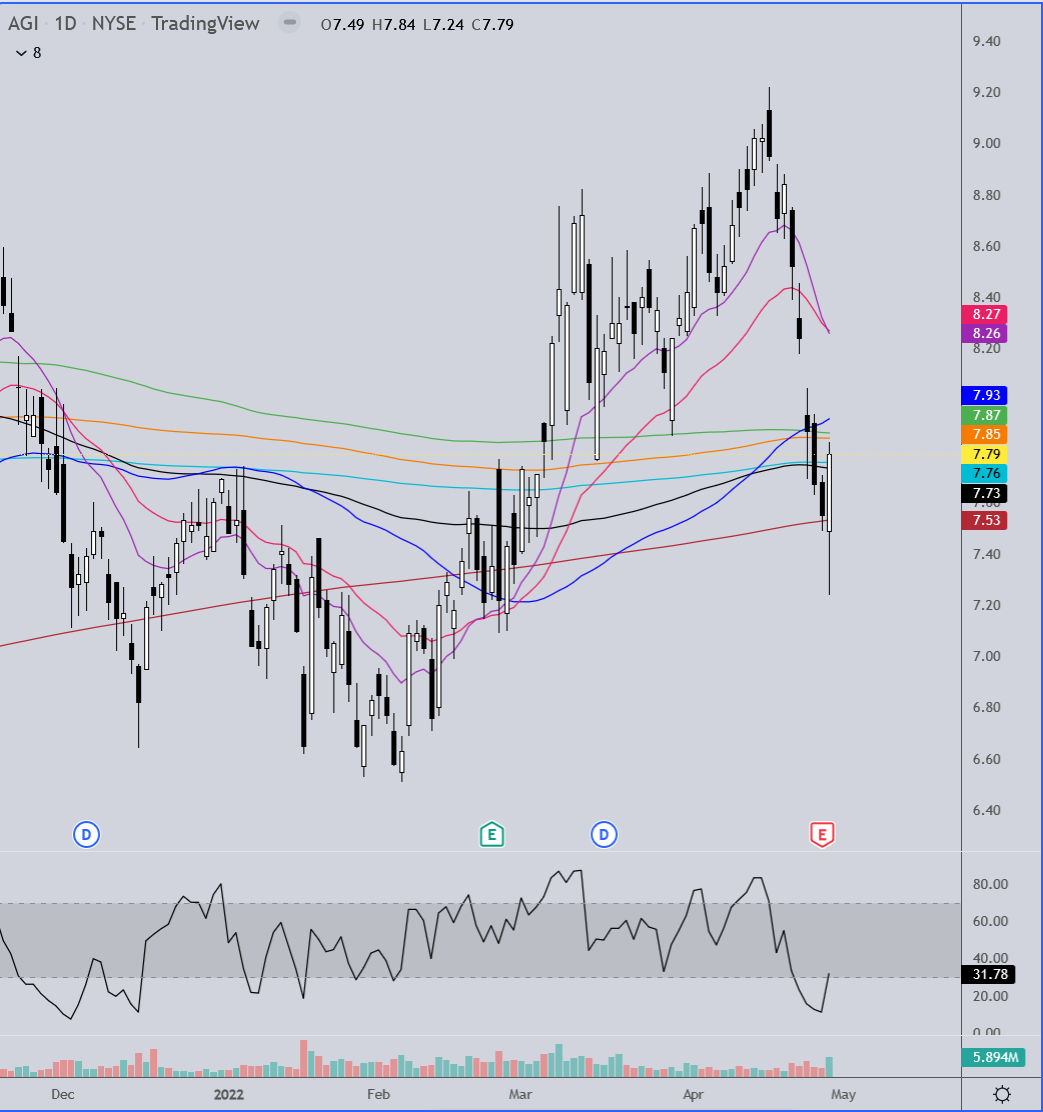
Here are 4 charts I found interesting and thought I’d share here. I don’t currently own any of these.

1 Like
Thanks again TraderRich, I always enjoy you analysis!
1 Like
What’s your trading strategy?
Everyone needs to ask and answer this question individually for any company they own stock in.
Is it short term or long term?
Not everyone has the same strategy, and probably different for different stocks.
When’s a good time to accumulate?
Personally, on the Junior miners and Explorers/Developers I like to accumulate incrementally on major pullbacks.
Here are a few charts I found interesting with labelled comments from SilverChartistLiberty.
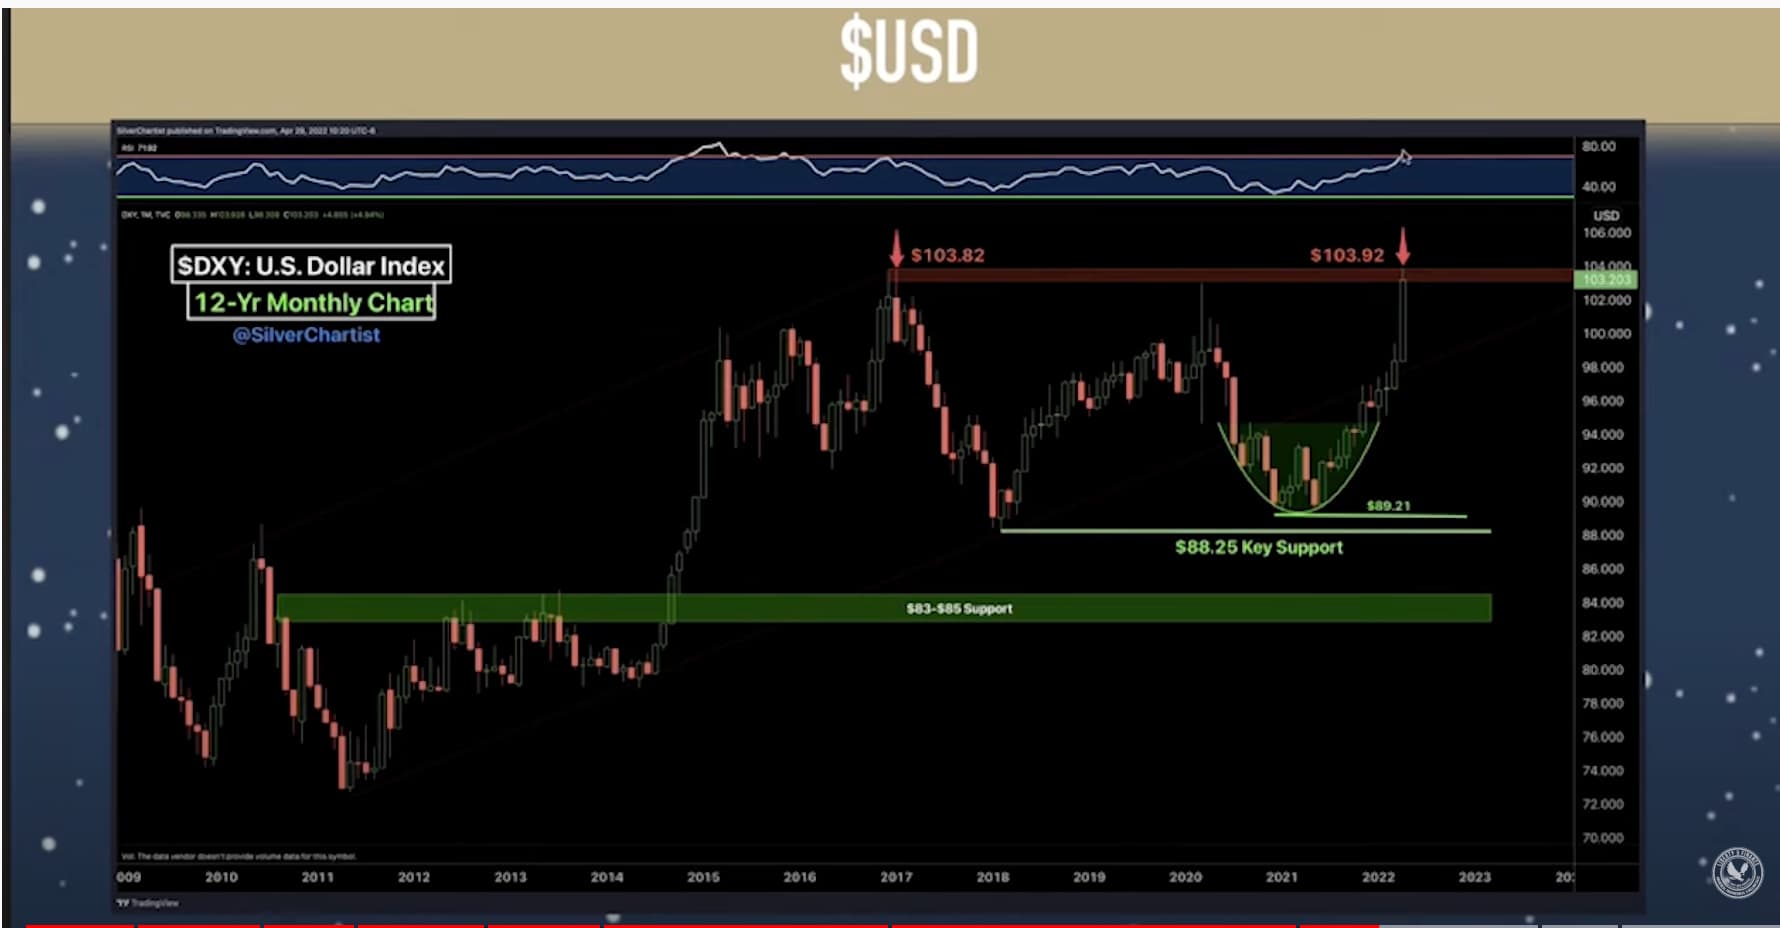
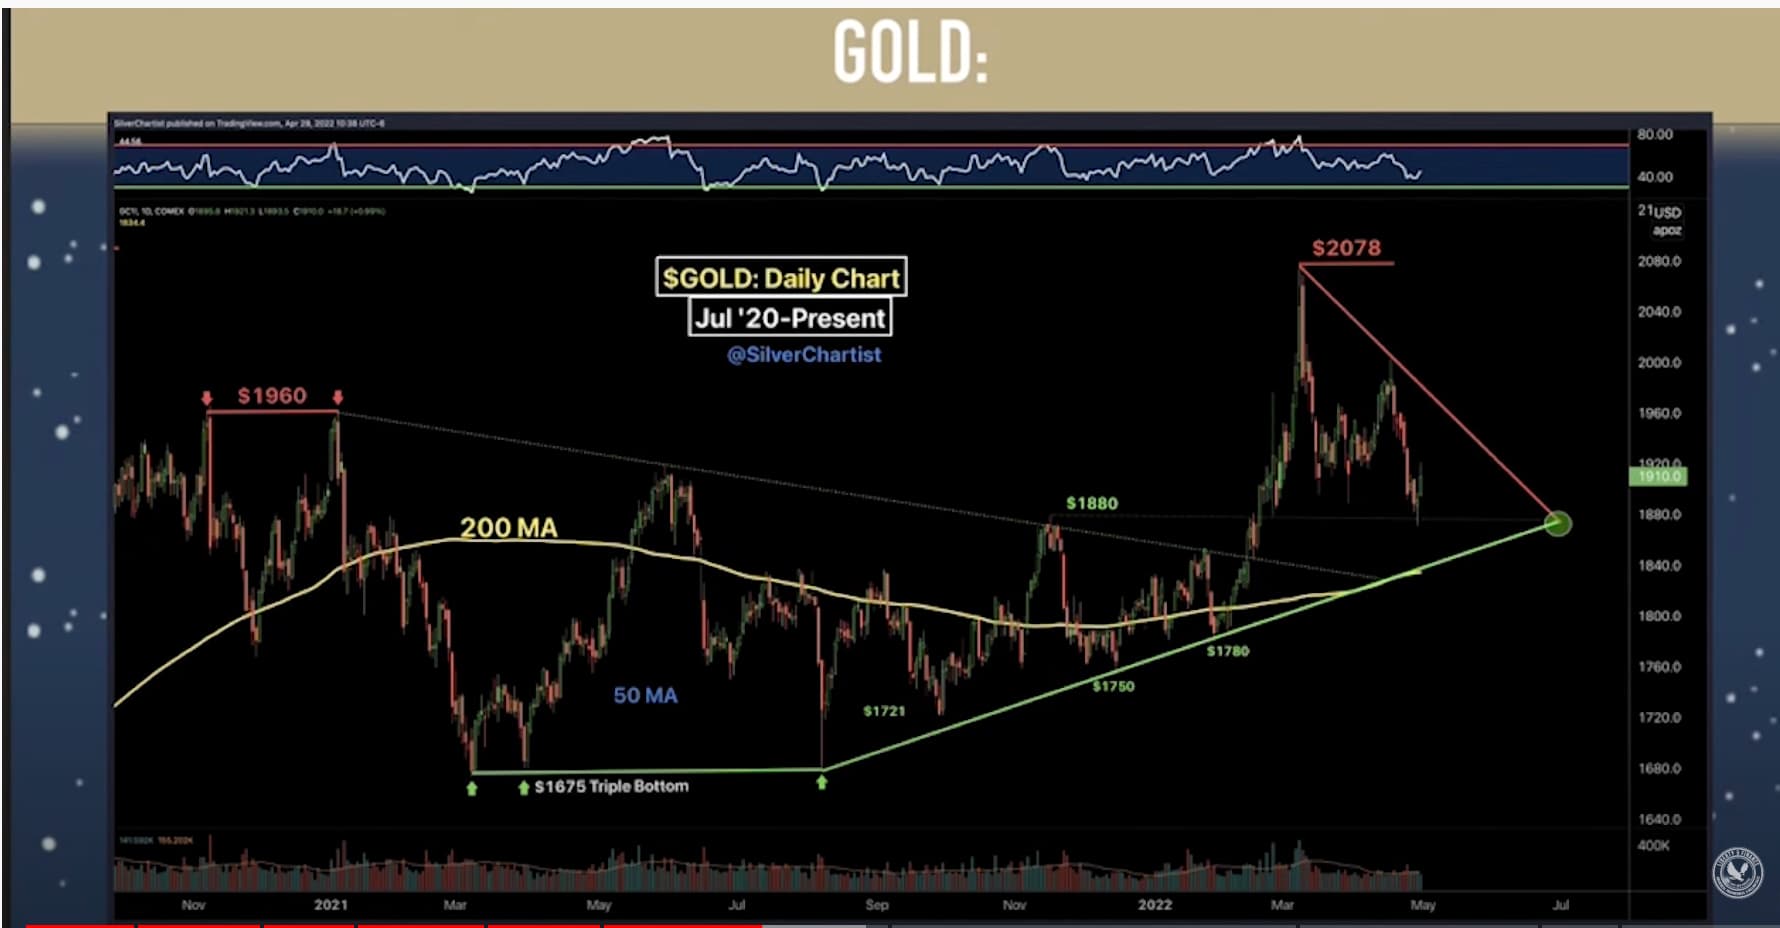
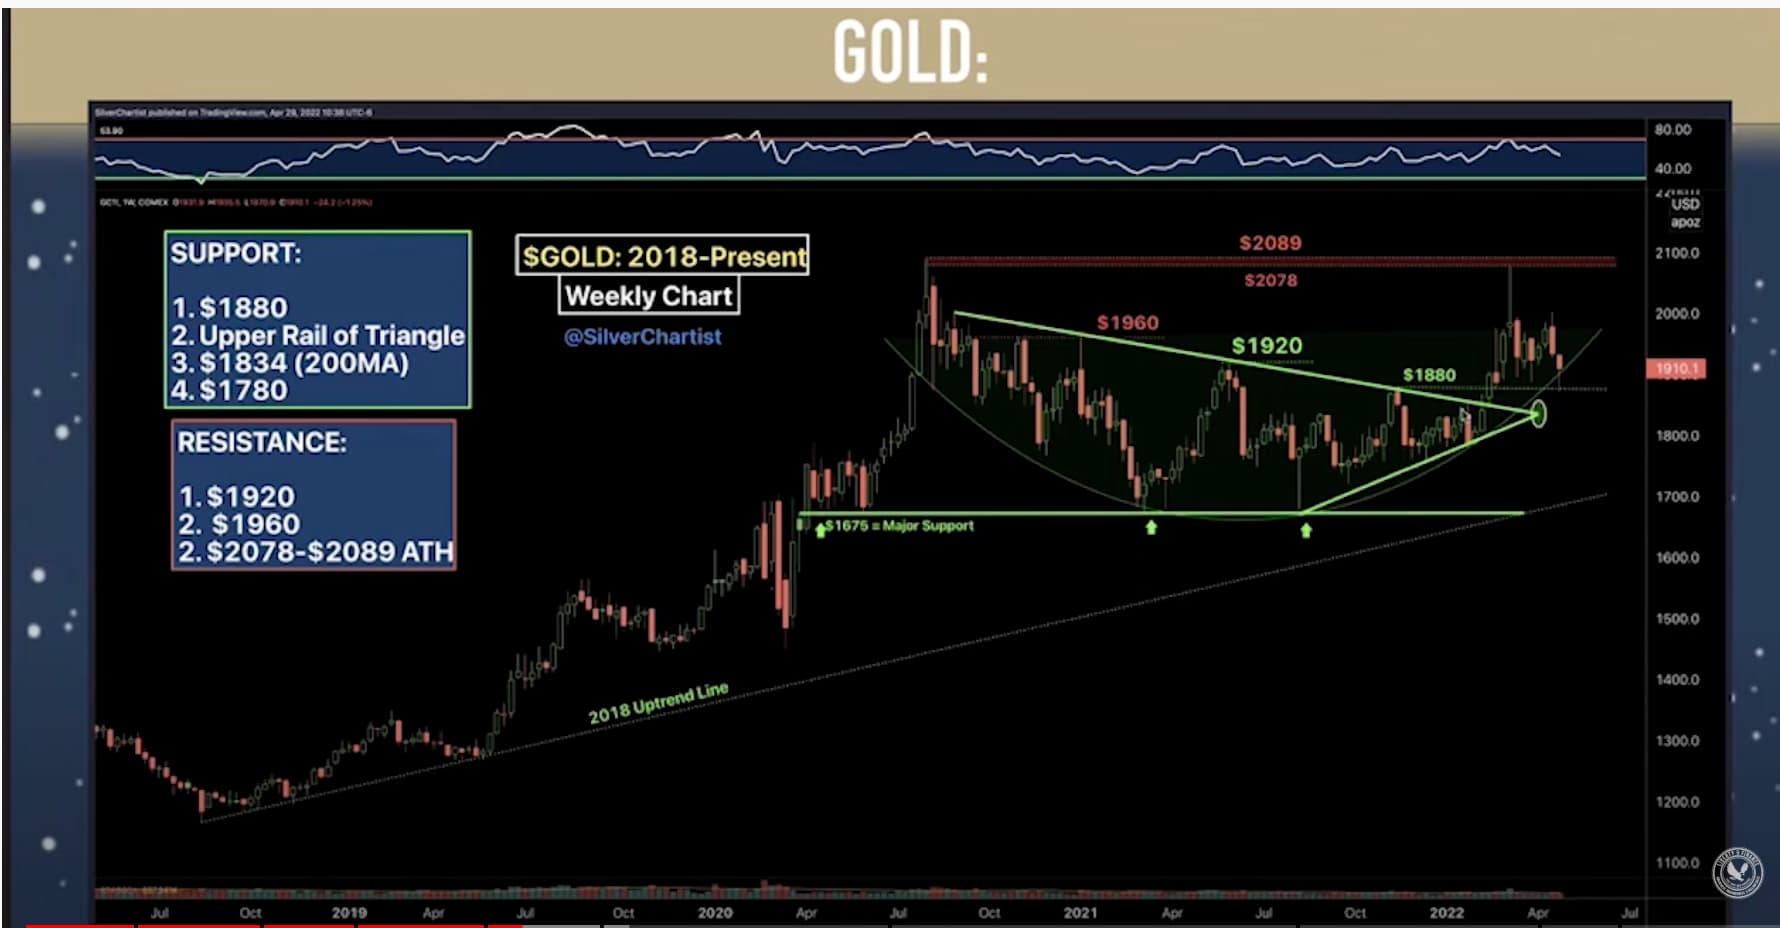
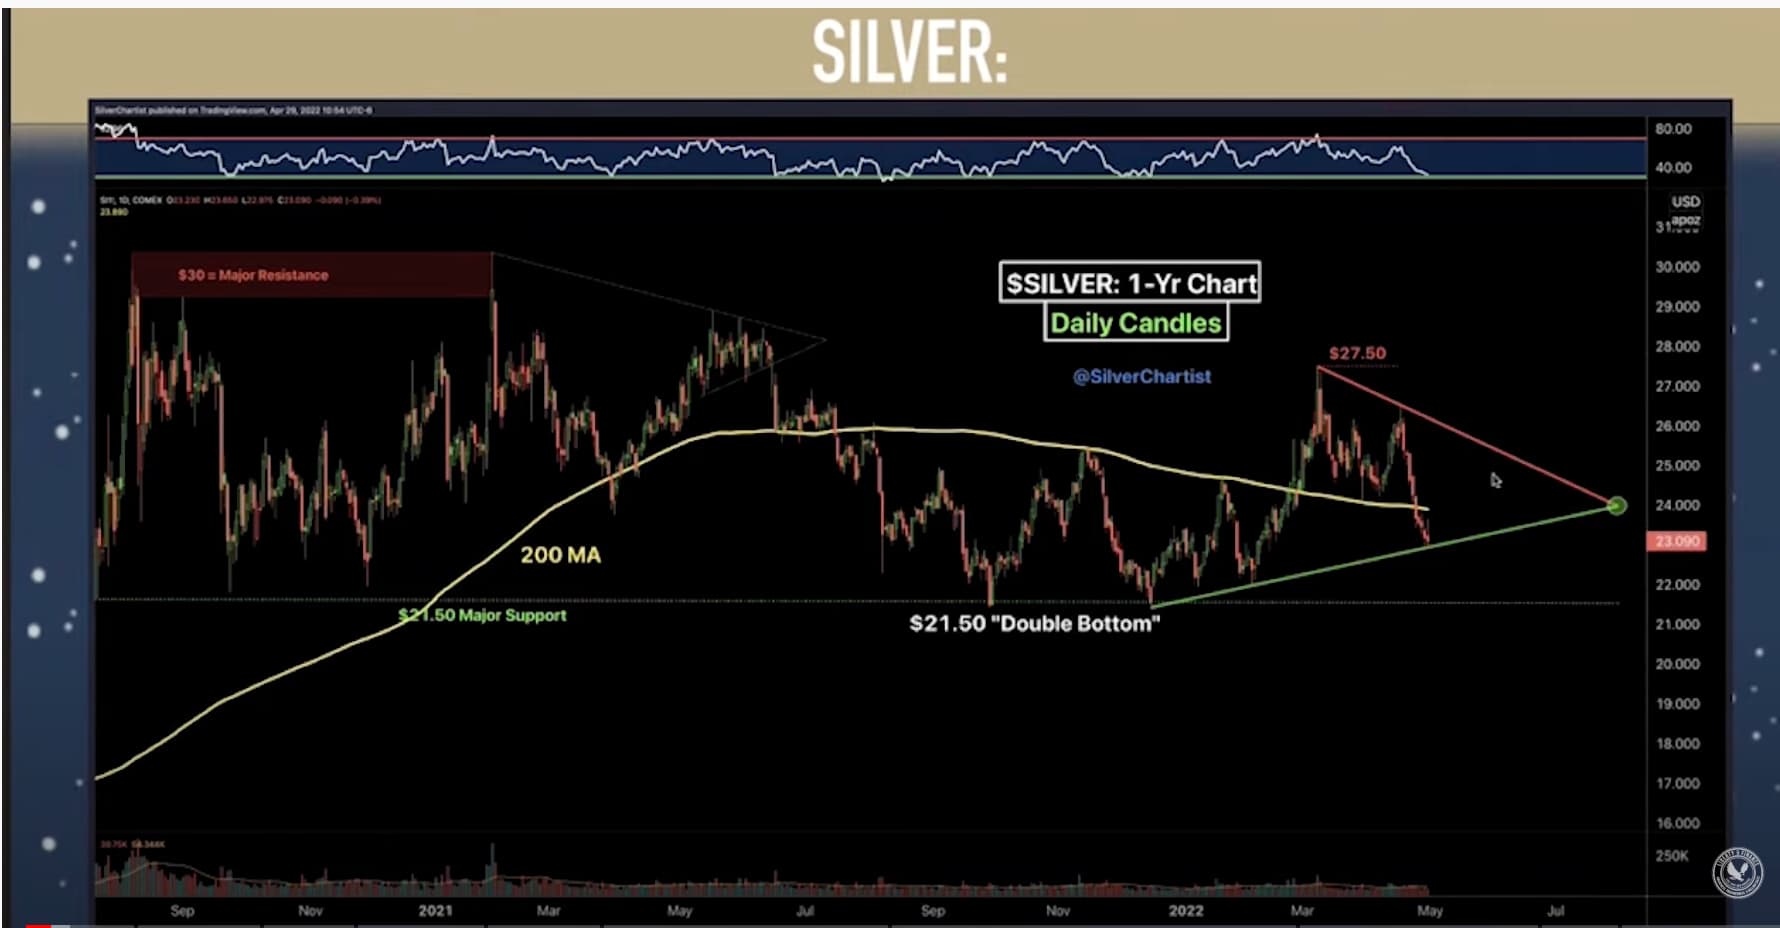
Feel free to interpret and post what you see in any charts of interest.
EZ
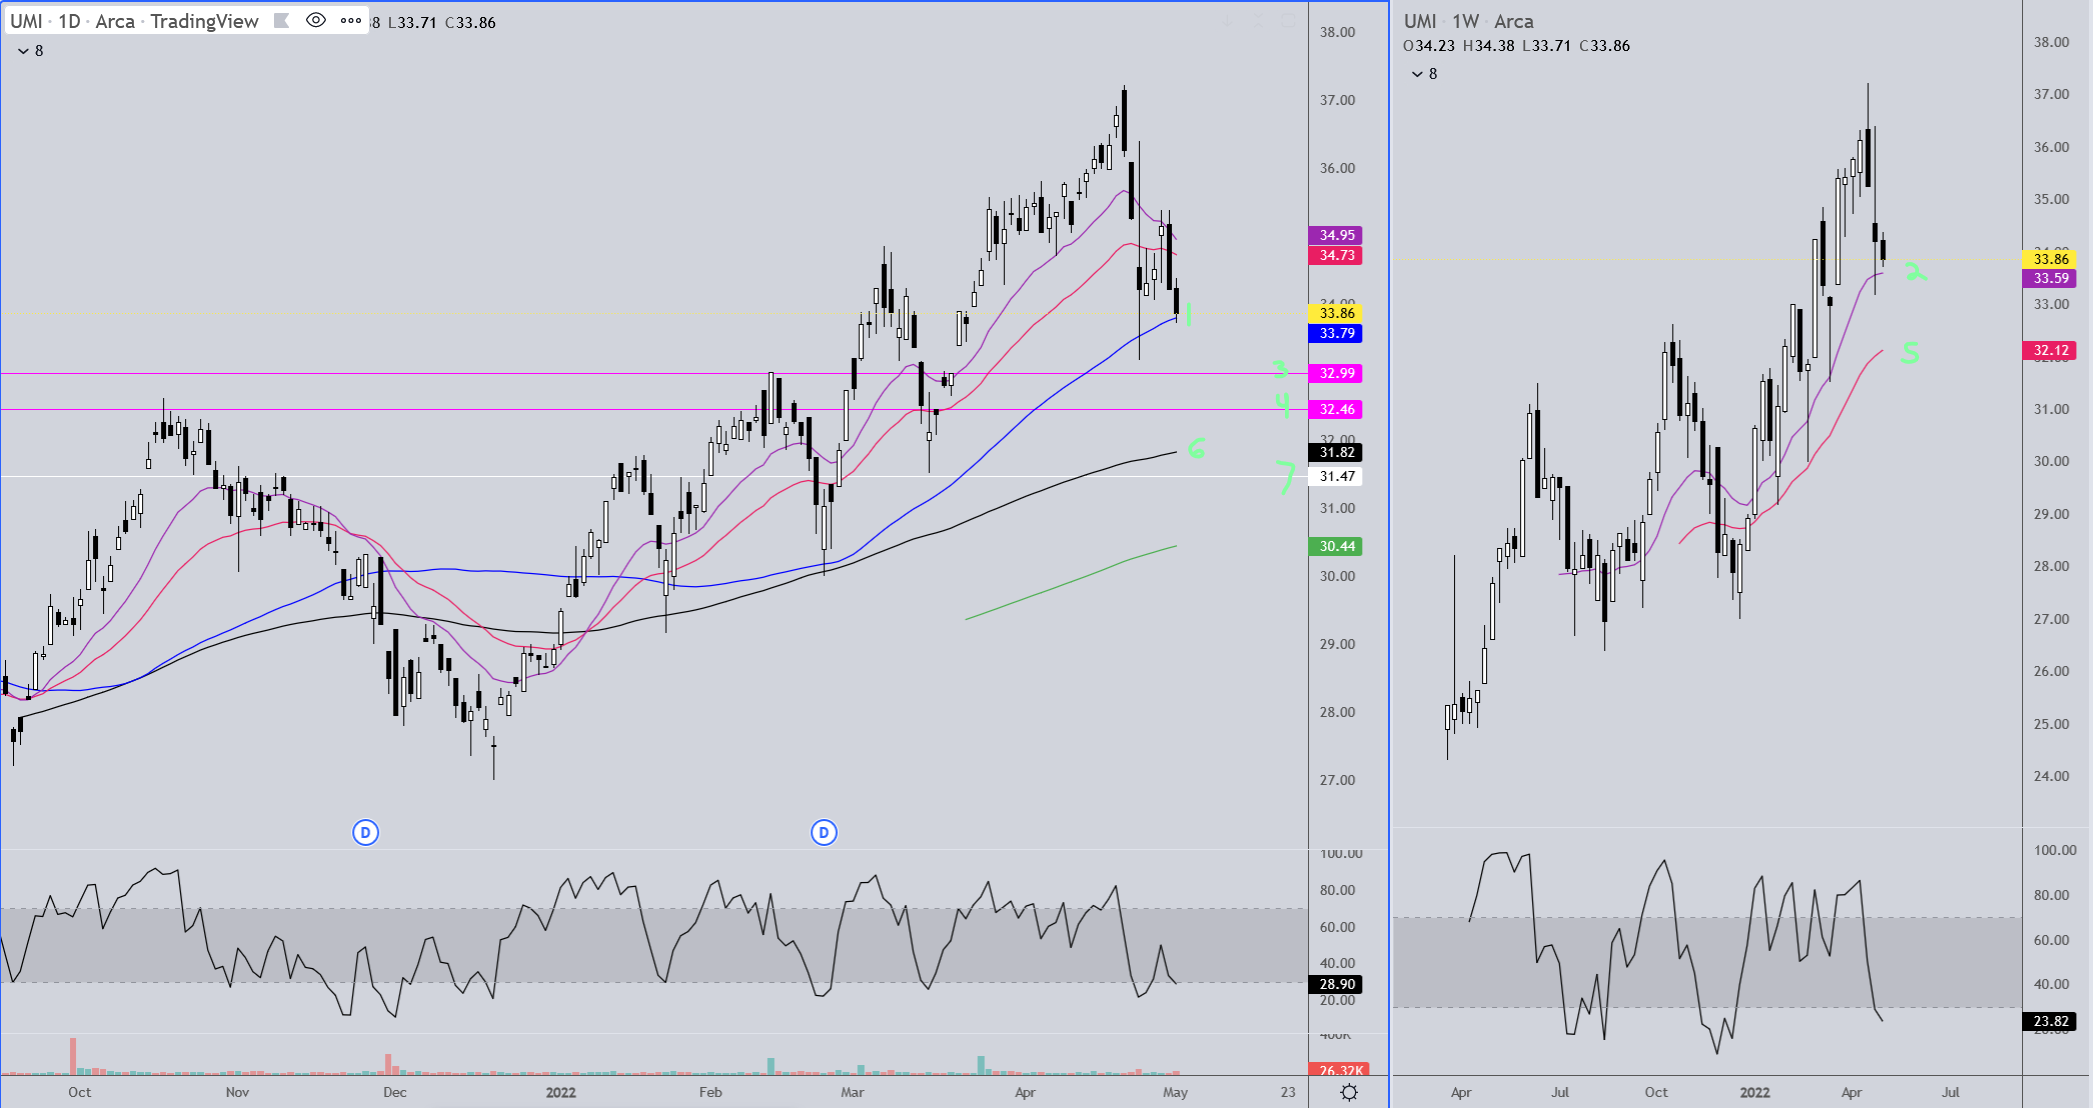
TR, when you find time, a chart and analysis on UMI please.
TIA
EZ
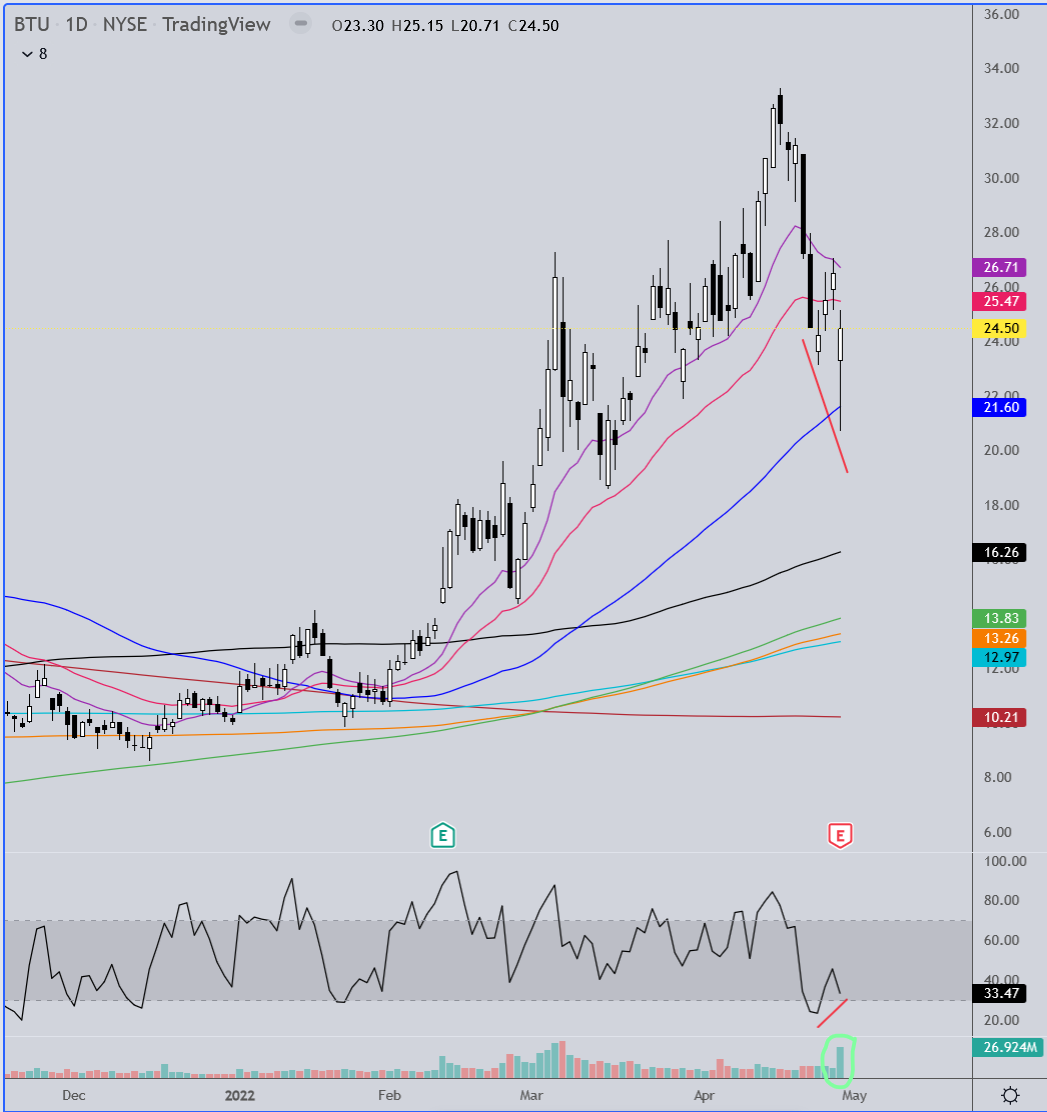
UMI
Daily: Not enough trading for my full arsenal of MA’s but probably enough. If support at the blue MA (and violet MA on the weekly) fails watch the two pink gap fill lines, followed by the weekly red MA at 32.12 currently, and then the daily black MA and then horizontal support at around 31.47. If all those fail let me know and I’ll update, but if all those fail you may want to hold off for a while. ![]()
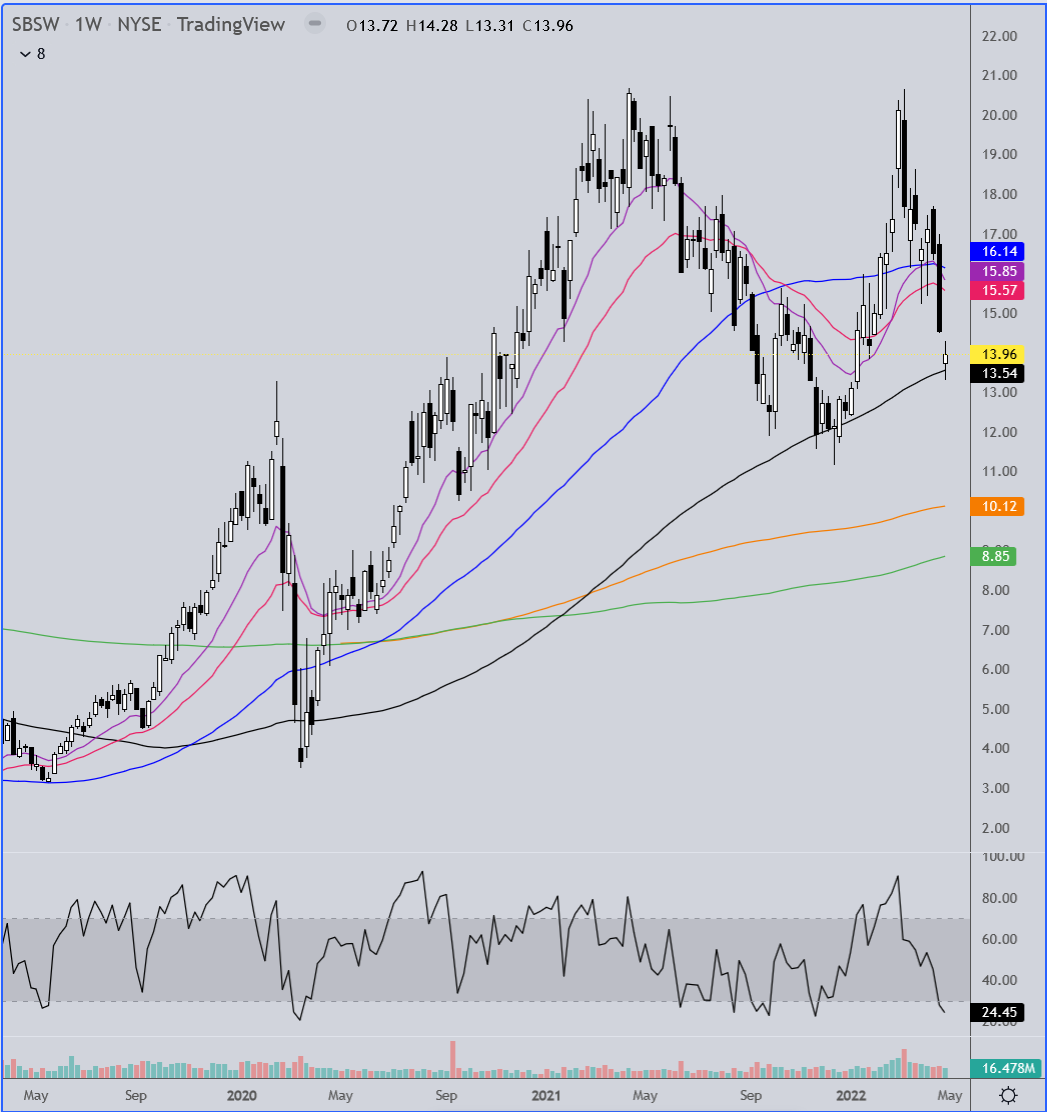
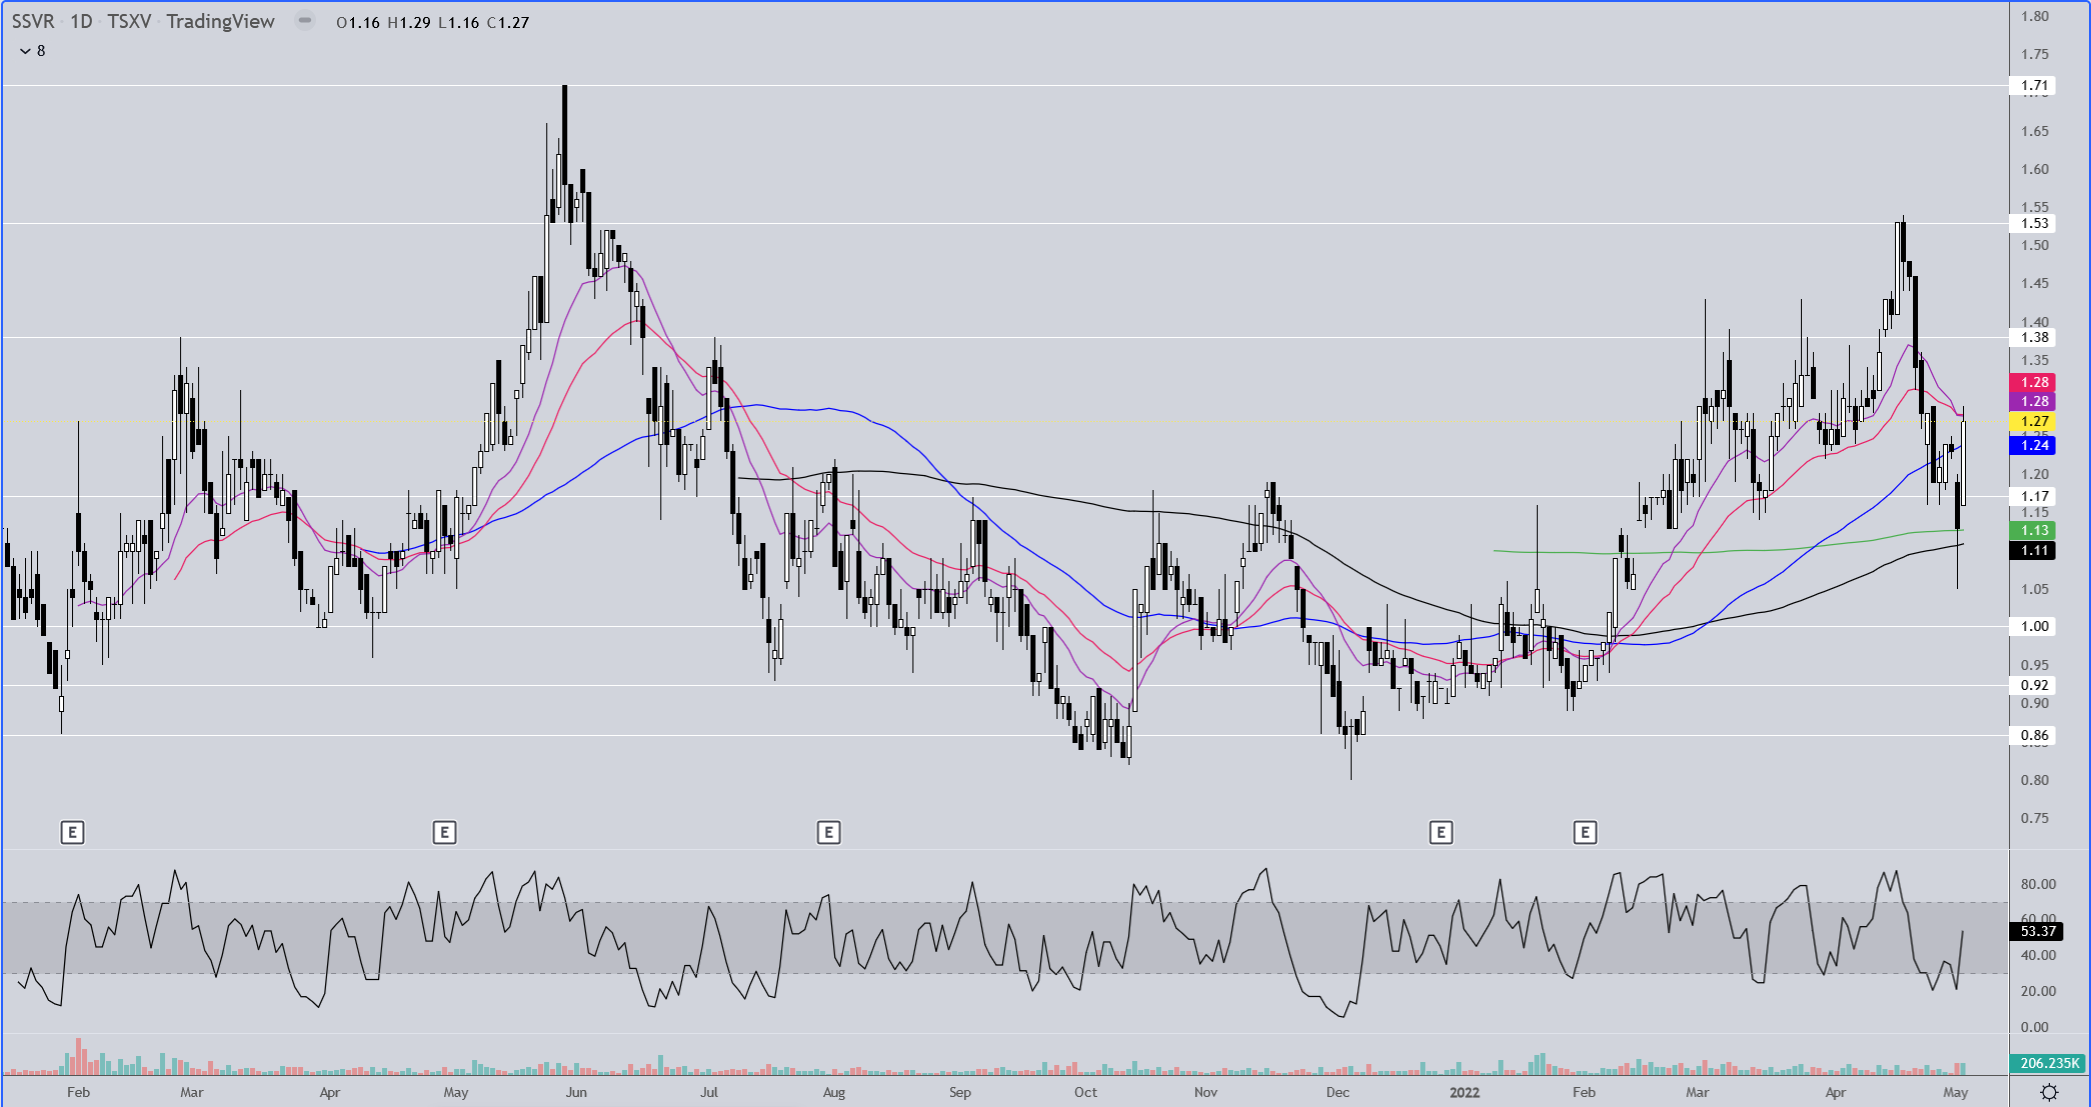
SSVR
Nice bounce on decent volume so far. Hit resistance at the two fastest MA’s today. Since there’s not a lot of chart real estate horizontal S/R lines can be helpful. If silver takes another hit tomorrow see if any of the lower levels act as support, otherwise you’re headed for cheaper shares. ![]()
1 Like
TR, Could you do an analysis and chart on Lundin Gold. I’m beginning an accumulation adding to my existing small position started earlier last year. It has a P/E in the mid 8s that looks attractive as a value play. This company has a news release I saw this morning.
Lundin Gold Reports Exceptional Results In The First Quarter Of 2022
Inaugural Dividend Anticipated Following Q2 Results under Recently Approved Policy
VANCOUVER, BC, May 3, 2022 /CNW/ - Lundin Gold Inc. (TSX: LUG) (Nasdaq Stockholm: LUG) (“Lundin Gold” or the “Company”) today reports exceptional results for the first quarter of 2022, highlighted by the production and sale of 121,665 and 119,282 ounces of gold, respectively, at an All-in Sustaining Cost (AISC)1 of $696 per oz sold. The Company generated free cash flow1 of $91.8 million this quarter resulting in a cash balance of $337 million at quarter end. Lundin Gold’s exceptional performance in Q1 2022 provides a robust foundation for the rest of the year, and the Company’s production guidance of 405,000 to 445,000 oz and AISC1 of $860 to $930 for 2022 remain unchanged. All amounts are in U.S. dollars unless otherwise indicated. PDF version
As a result of the Company’s significant cash flow generation throughout 2021 and continuing in Q1 2022, the Company’s Board of Directors has approved implementation of a dividend policy. Under this newly established policy, the Company anticipates paying two cash dividends per calendar year, following the release of second quarter and year end results, respectively. Subject always to the board’s discretion, the Company anticipates declaring and paying an inaugural semi-annual dividend of $0.20 per share (equivalent to approximately $100 million annually based on currently issued and outstanding shares) pursuant to the policy after the announcement of the Company’s Q2 2022 financial results.
LUG Daily: It seems the market liked the dividend PR. They bought it right up to the 61.8% retracement level. If the move in gold and silver holds tonight most of the rest of this may be irrelevant. Generally though, this stock moves like a schizophrenic cat!
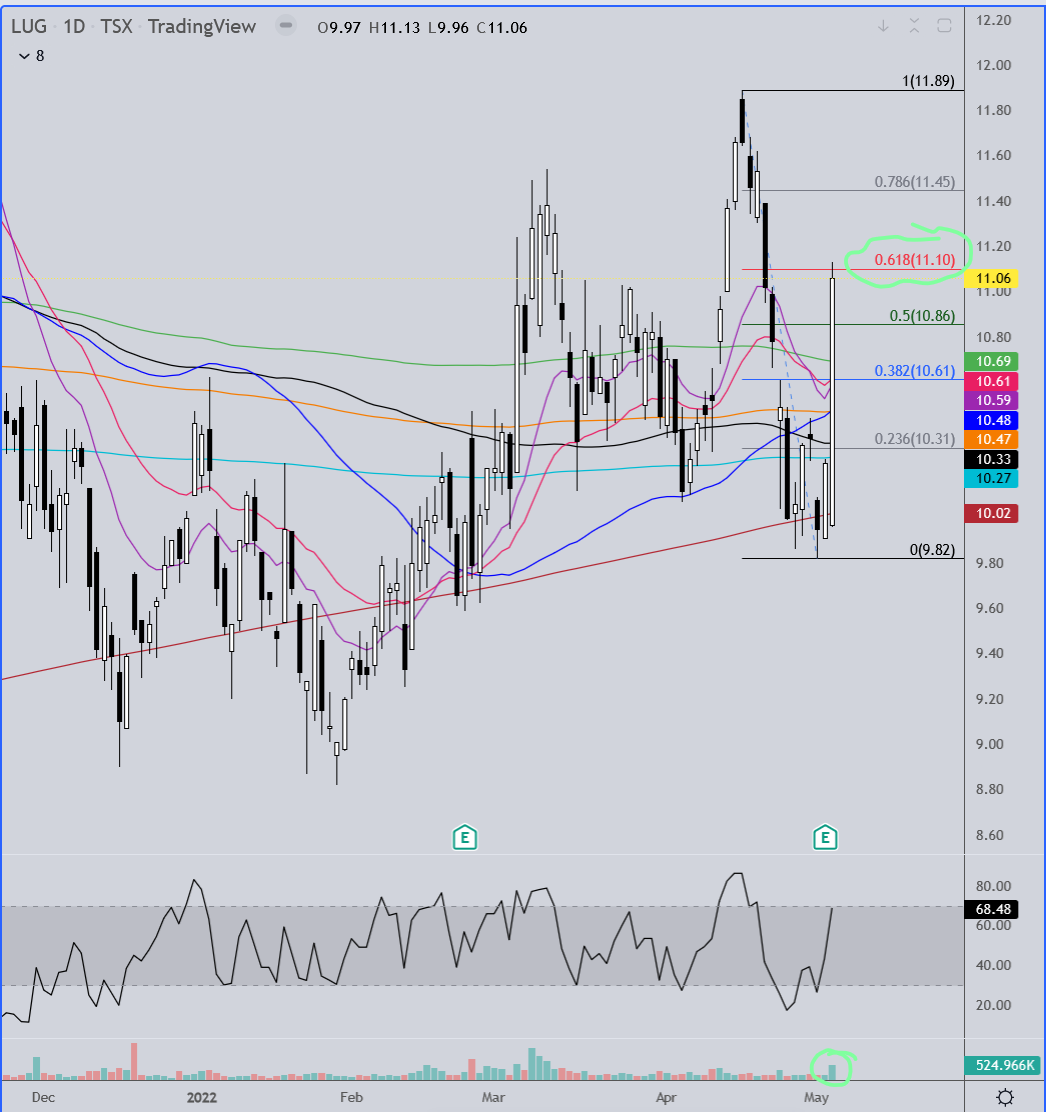
In the event that there is a pullback tomorrow the support levels that will hold if this new uptrend is going to stay strong are those that are at or above the 50% retracement level.
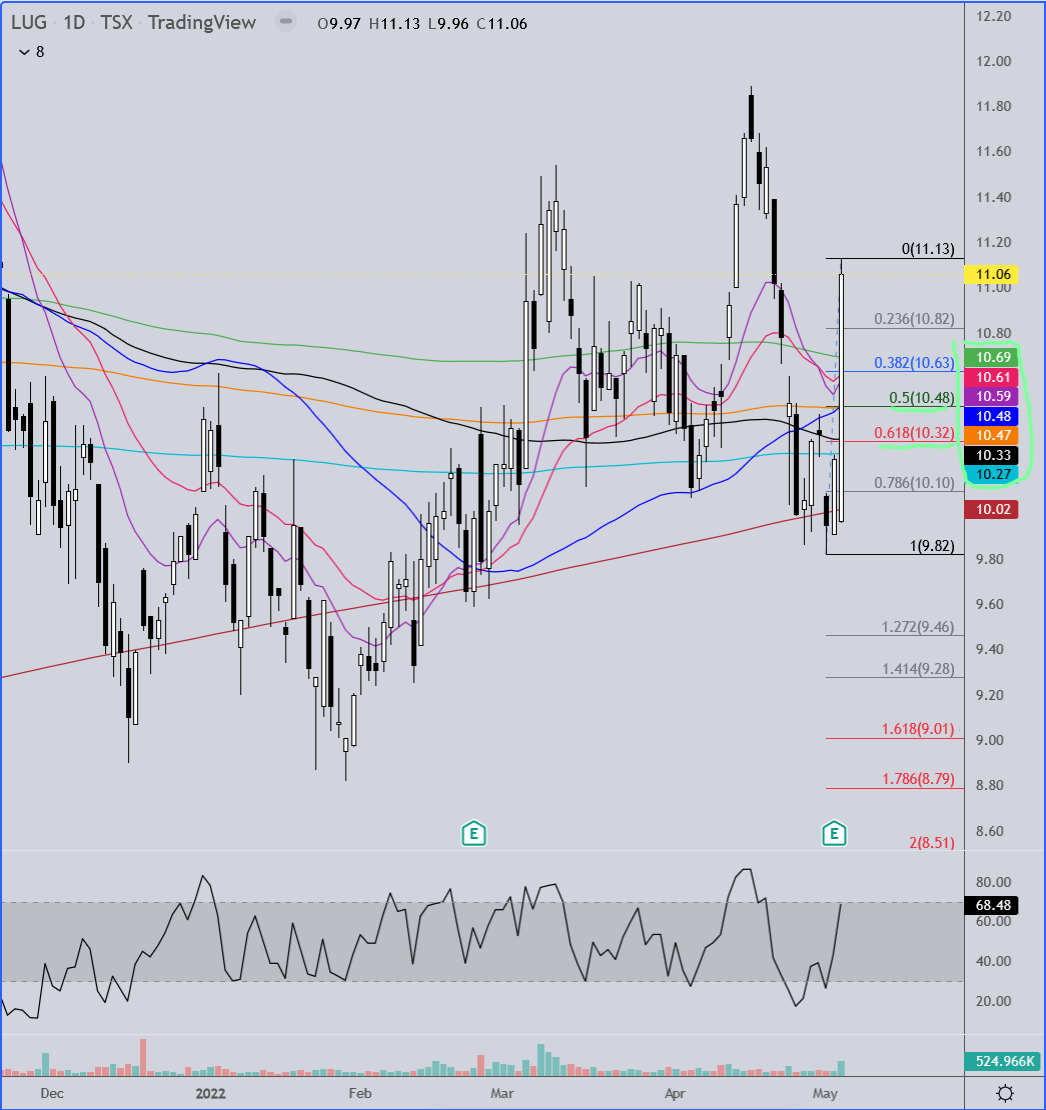
The weekly chart helps to make more sense out of the stock movement. Buy low, sell high. ![]()

1 Like
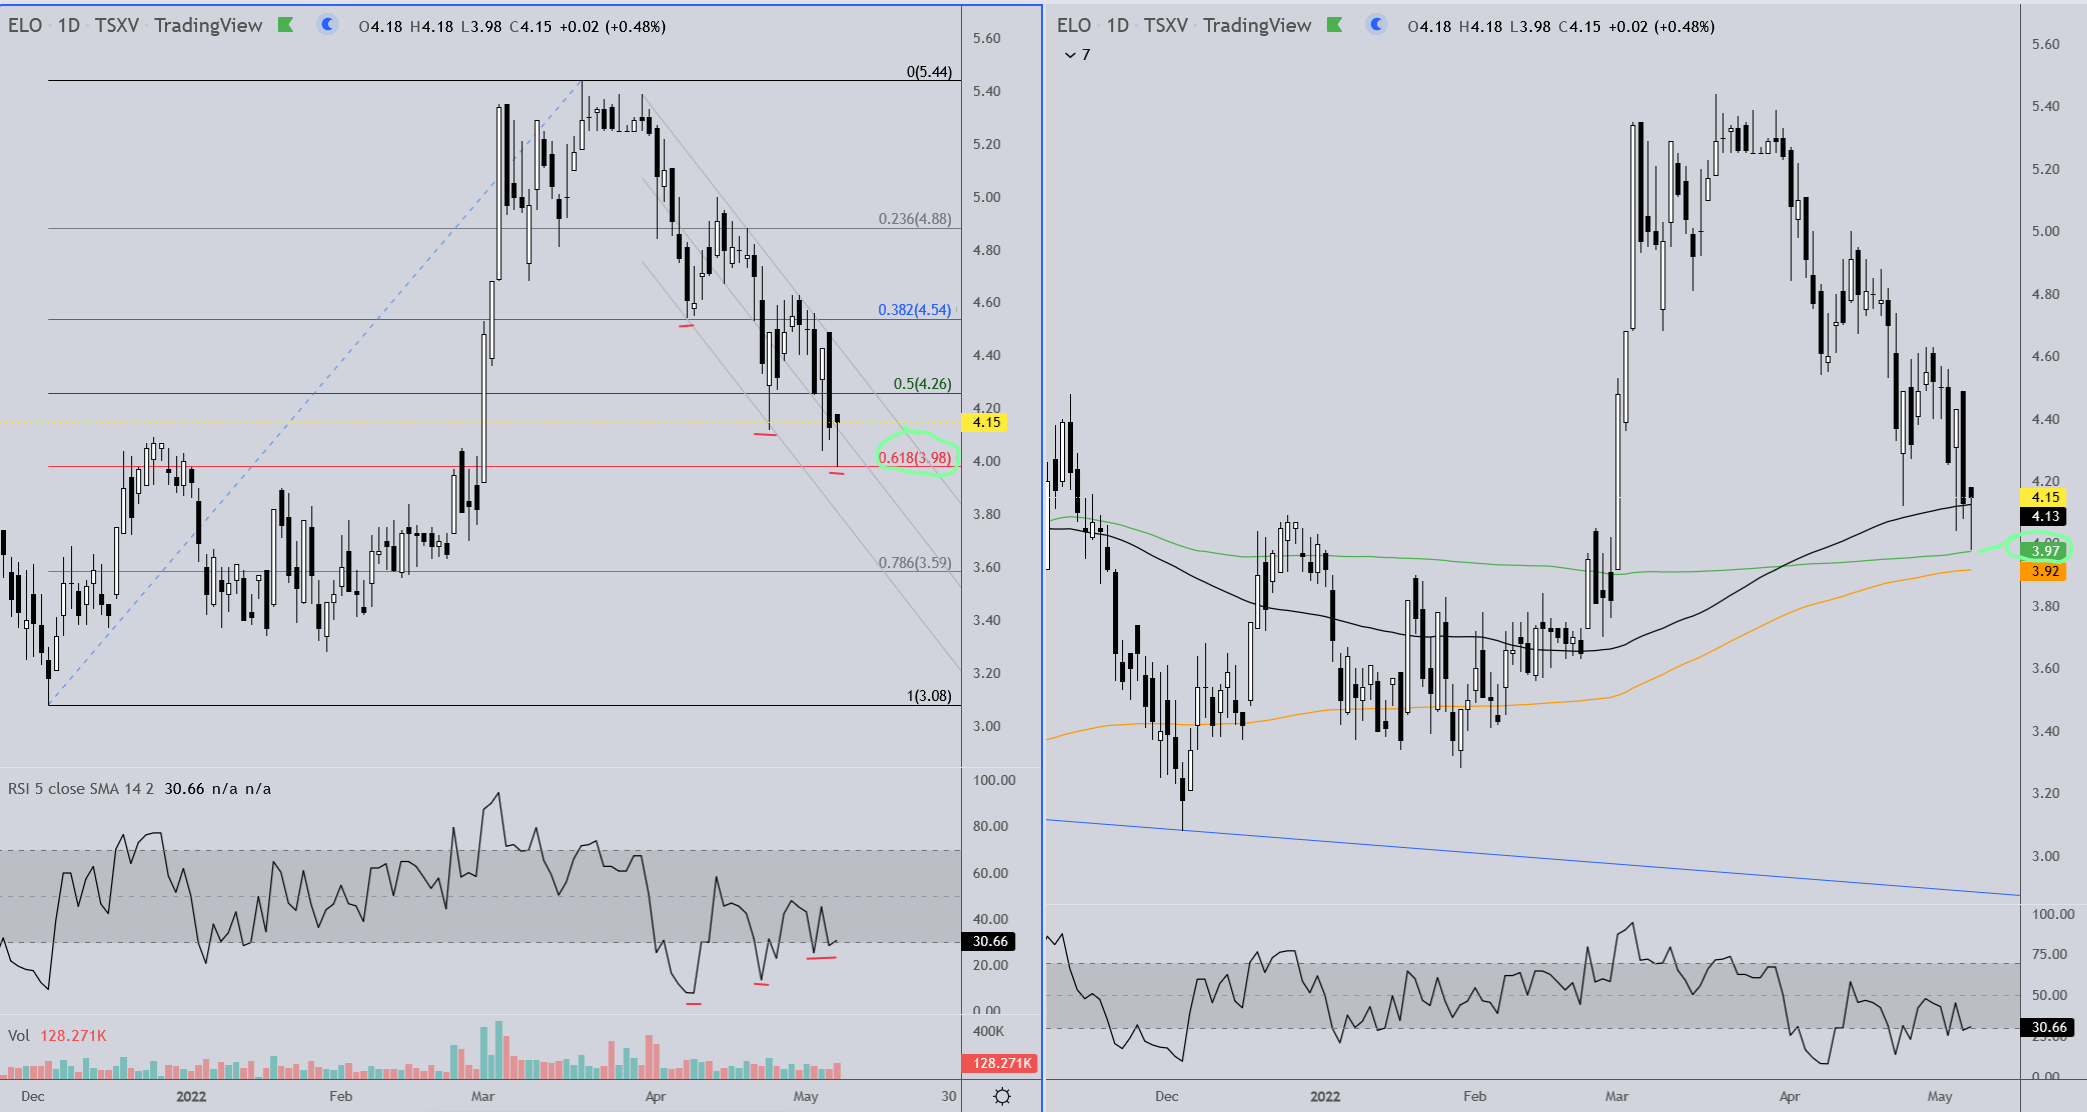
ELO: The two charts here are both daily intervals. The left chart simply has a Fibonacci retracement grid drawn from the last major swing low of 3.08 to the last major swing high of 5.44. The bottom today was a perfect 61.8% retracement. Also, the lows of the downtrend are marked with red dashes that correspond to the dashes on the RSI at the bottom of the chart. Bullish divergence occurs when RSI is hitting higher lows as the stock is hitting lower lows. The right side is simply to show that ELO also bounced off of the green 200DMA. This information along with the bullish candle for today and the higher than avg volume support the argument that we may have seen the bottom of this retracement.
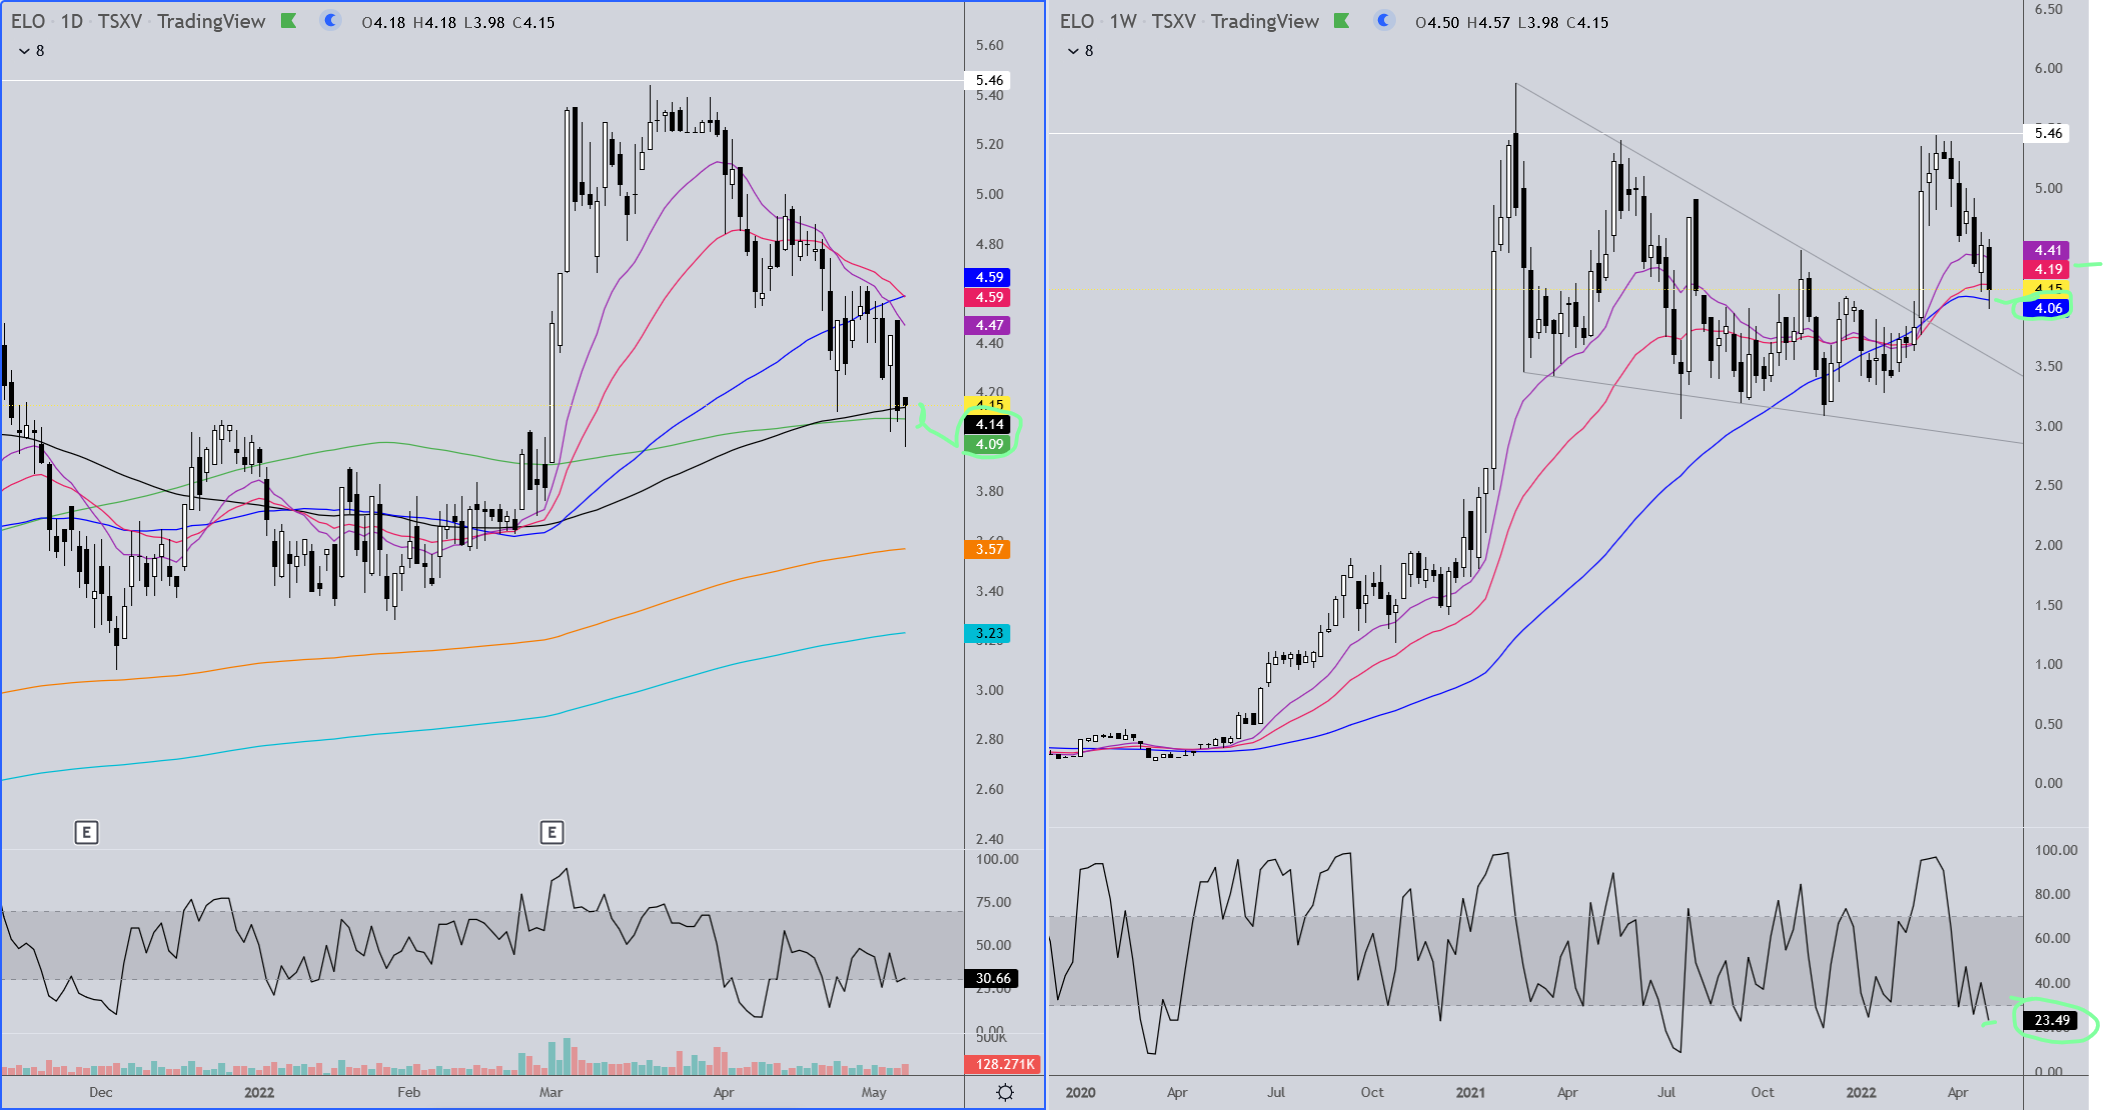
These next two charts are a daily interval on the left and weekly interval on the right. The moving avgs on these charts are not the typical popular MAs and I find them to be more dependable. The green, black and yellow MA’s are most often where support will be found on pullbacks and the fact that the black and green are on top of each other and that the black is sloping upward and above the green is bullish. On the weekly chart, the fact that ELO tested and held the blue MA is bullish. What I don’t like here is that the blue MA is sloping slightly downward and that ELO closed below the red MA at 4.19. Not a huge deal but it does leave open the possibility that the bottom might not be in yet. If ELO should lose the 3.98 low next week it is very likely we will see the share price dip into the 3.70’s, imo.
TR, with the general smashdown in PMs, could you do an update on ELO?
Do you expect it to bounce off and retrace from your triangle low at this point, or will we get a relief rally first?
Here’s what I’m keeping an eye on currently…
On the big daily chart on the left, so far the uptrend line has not been hit, (although there are three potential uptrend lines there and one has been, but it is the least important to me of everything I’m watching for). What are most important for me here are the black and green MA’s at 4.13/4.09. If ELO gets a close back above those it’s a good sign for a reversal. Then we need to get back above the two MA’s above that which I’ll deal with when we get there. As for the weekly interval, top right, a close for the week above 4.05 is good, and above 4.18 is great. Once we get back above that weekly red MA I think we’re good. What I am really liking so far is how the violet MA on the monthly chart so far is kind of the ultimate support. So far ELO has today come within .09 of testing it and we’re currently getting a little bump back up.
4.05 is the key resistance right this moment, then 4.09 and 4.13. We get a close above 4.18 and I would be comfortable saying the bottom is in for ELO.

And as if by magic, no sooner do I post this and BAM!, ELO pops up through the green and black MA’s up to the top of the channel and the violet MA. Now we get to see where the pullback takes us. Going to be an interesting close today.

1 Like
I’m not sure if NFG/NFGC is at its lows yet, but I think it’s close. I bought some 7.23’s today. Basis is 7.30. I’ll put some charts up this weekend and might have time for some tonight/later.
1 Like
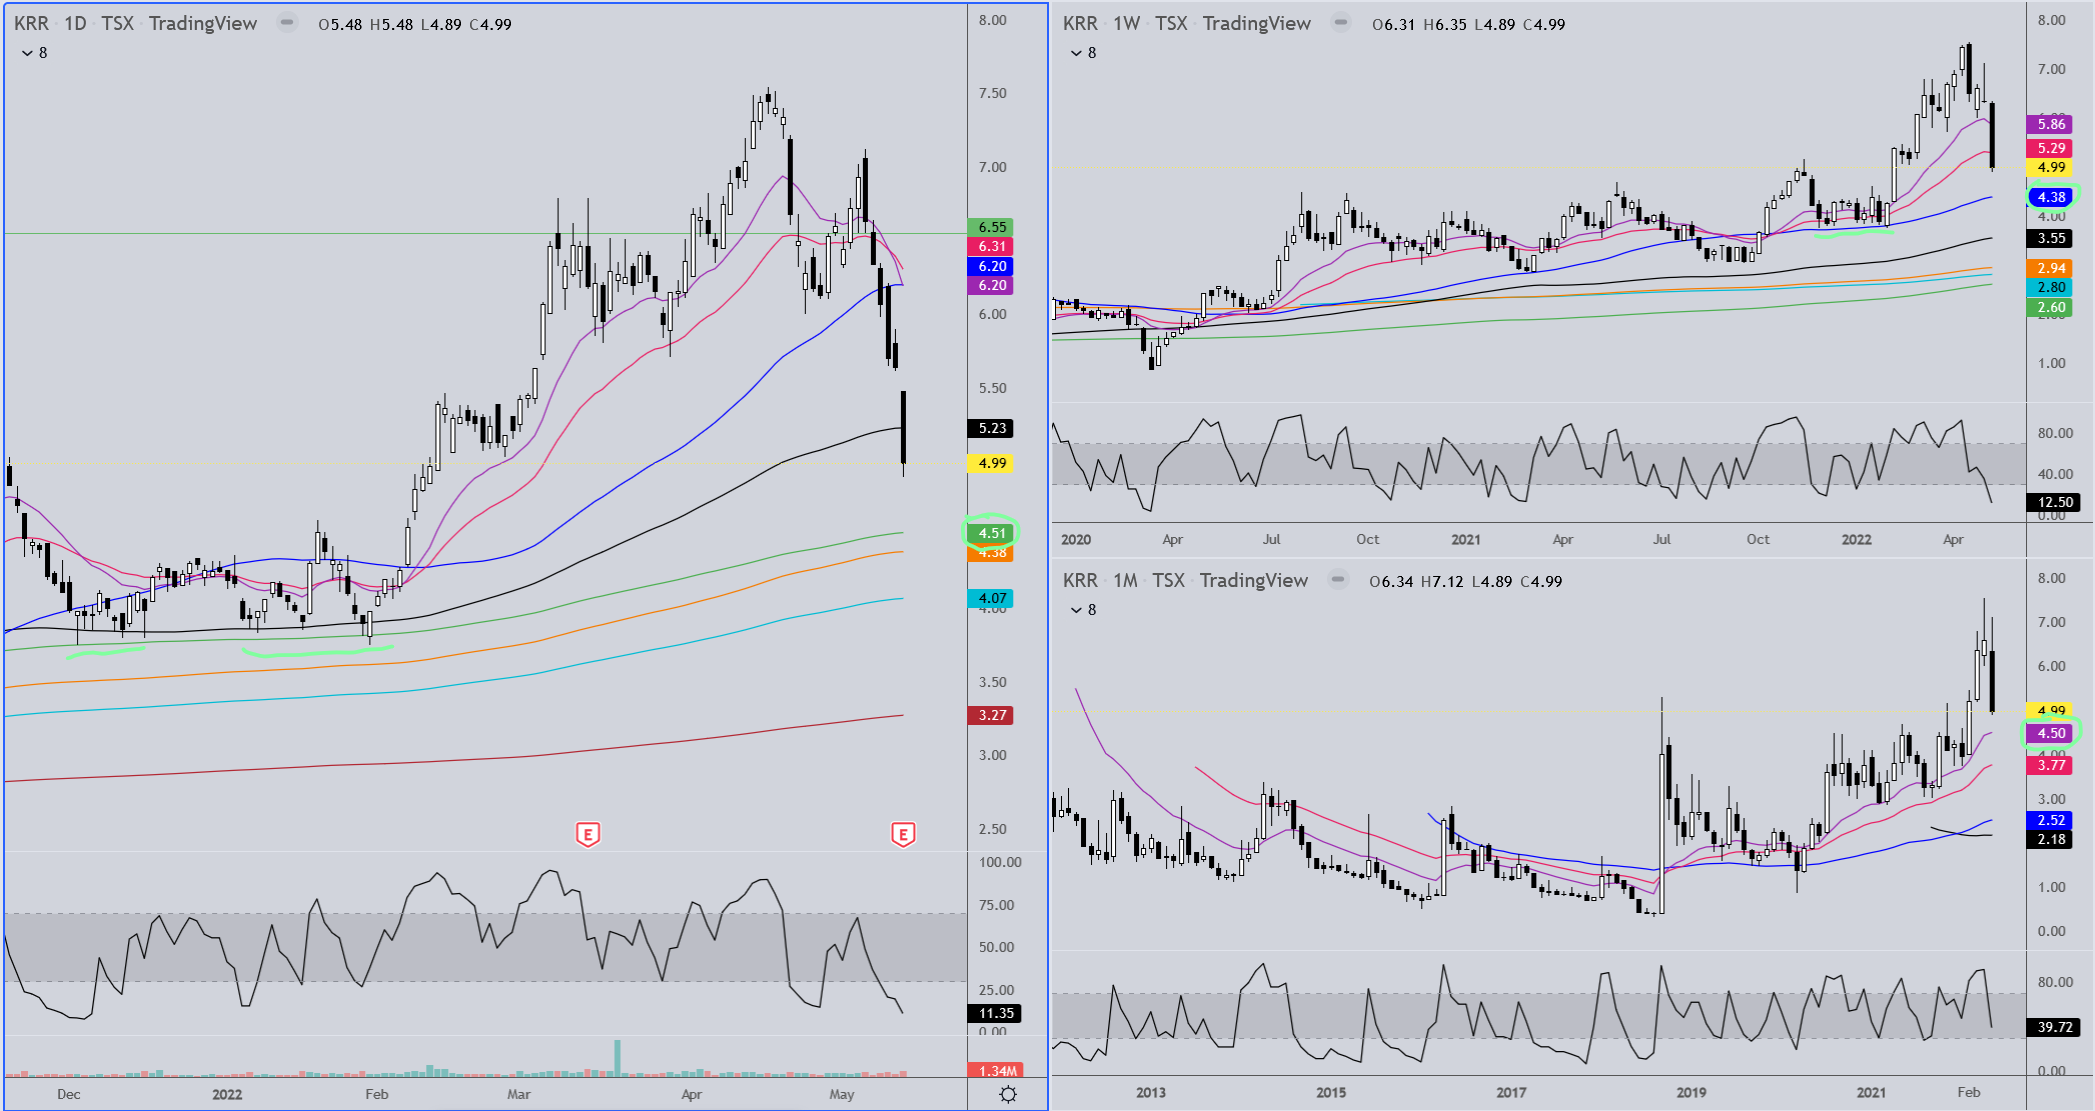
KRR is a dime away from hitting the measured move of the head & shoulders it broke down from. Whether or not that will be the end of the fall is likely at least partially dependent upon what the overall market does. I was looking for targets on gold and silver of 1818 and 20.50 and we’re about there, so I guess we’ll see how that goes.
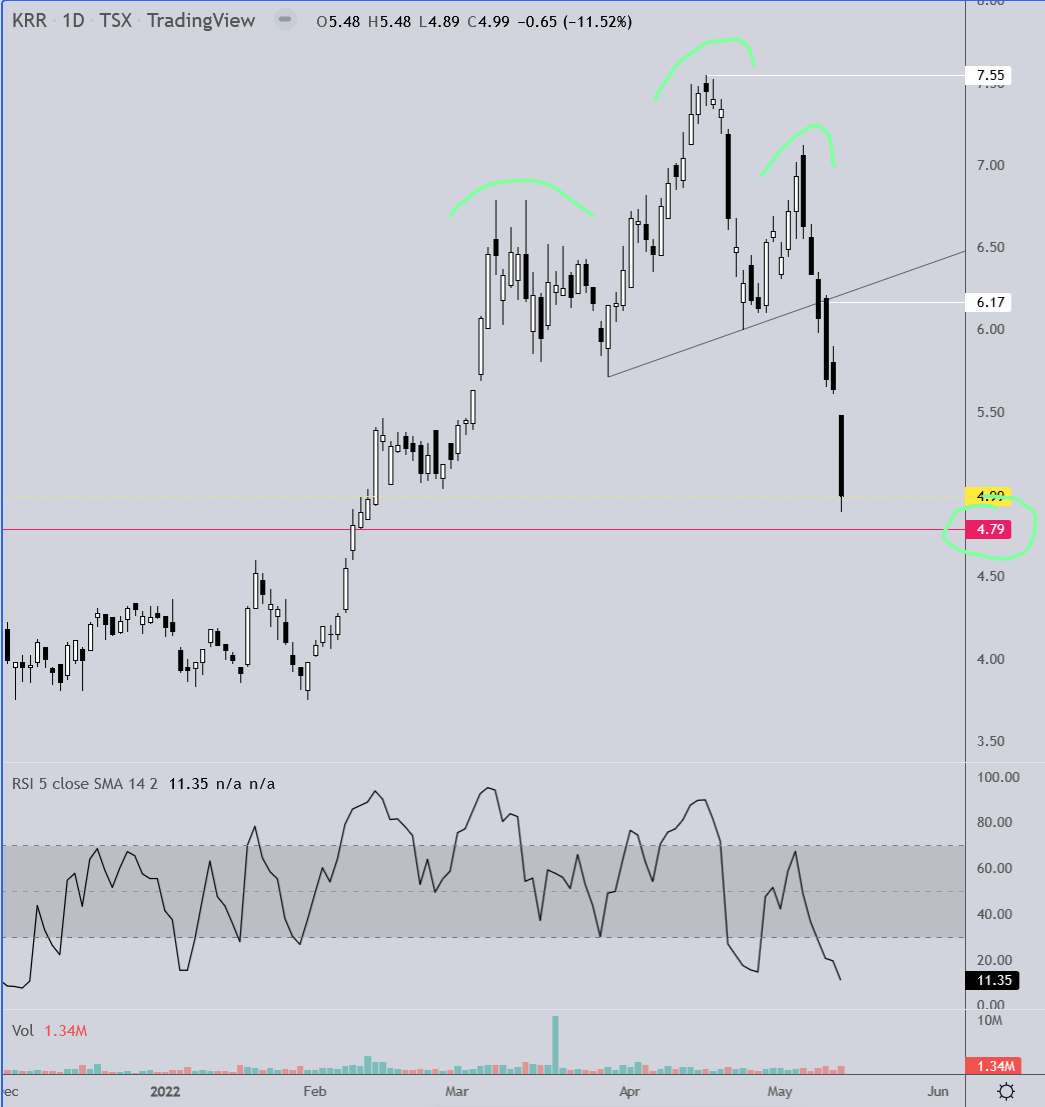
If KRR moves lower there’s a good chance of finding support right around 4.50 - 4.38 based on past MA support.