In order to make the due diligence offered on other threads more easily accessible, I created this forum to post charts for gold, silver and other metals, as well as the stocks discussed on the other threads.
1 Like
Hi Rich,
If you have time would you post some charts on some of the lesser known stocks that have not been widely discussed on the other thread. Here’s a list to start with if any of them look interesting during this PM pullback period, and yes, I have positions in these, so it is not just idle interest:
ASM Avino Silver
WHGOF White Gold Corp
BBBXF Brixton Metals Corp
BYN:CA Banyon Gold Corp
CLHRF Coral Gold Resources
BBB:CA Brixton Metals Corp
IVS:CA Inventus Mining
KNTNF K92 Mining
LOMLF Lion One Metals
SKREF Skeena Resources
OR Osisko Gold Royalty
UGDIF Unigold Inc
SLVRF Silver One Resources
There are quite a few more that have garnered attention on the other thread that I’m sure others would like to see your skills applied. If you just pick a few from the foregoing list it is greatly appreciated. TIA

EZ
1 Like
Thanks TR, any change in your current thoughts on silver would be welcome!
No change yet. It just ran to 21.82 and is pulling back.
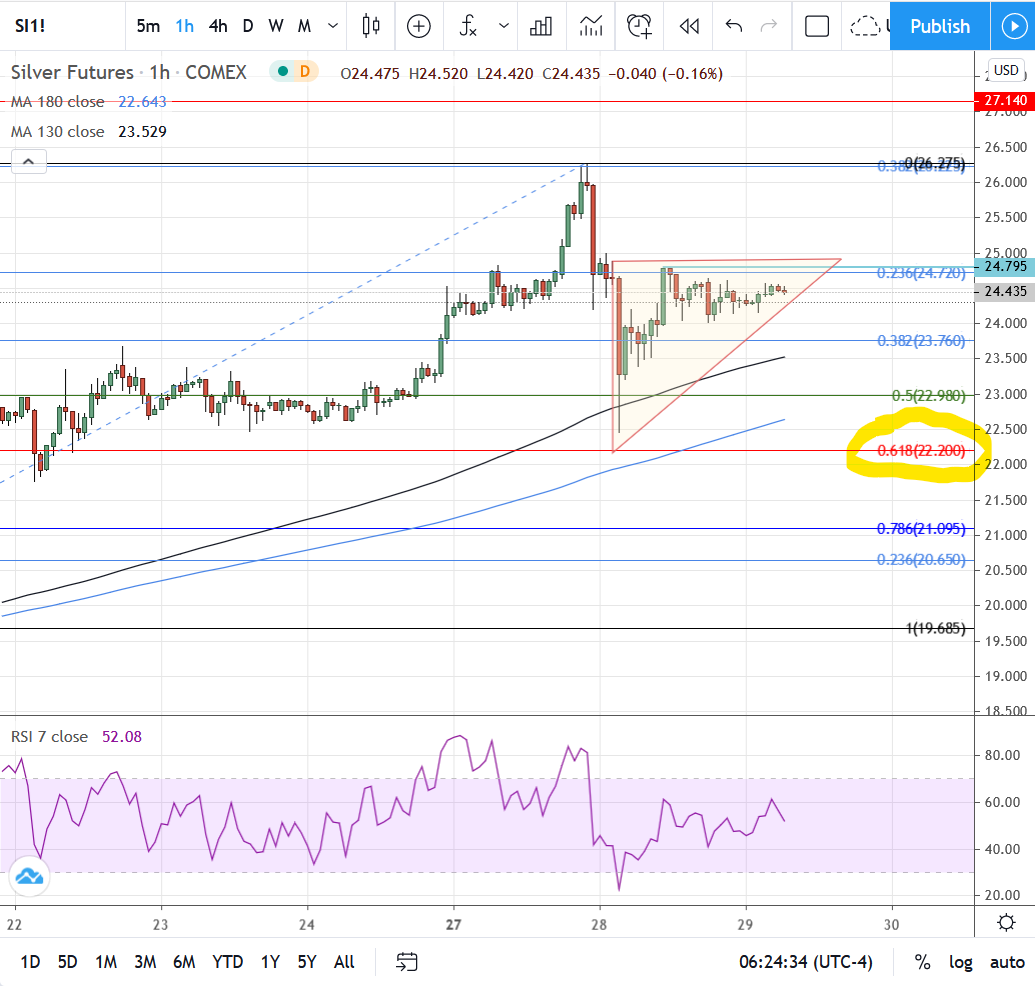
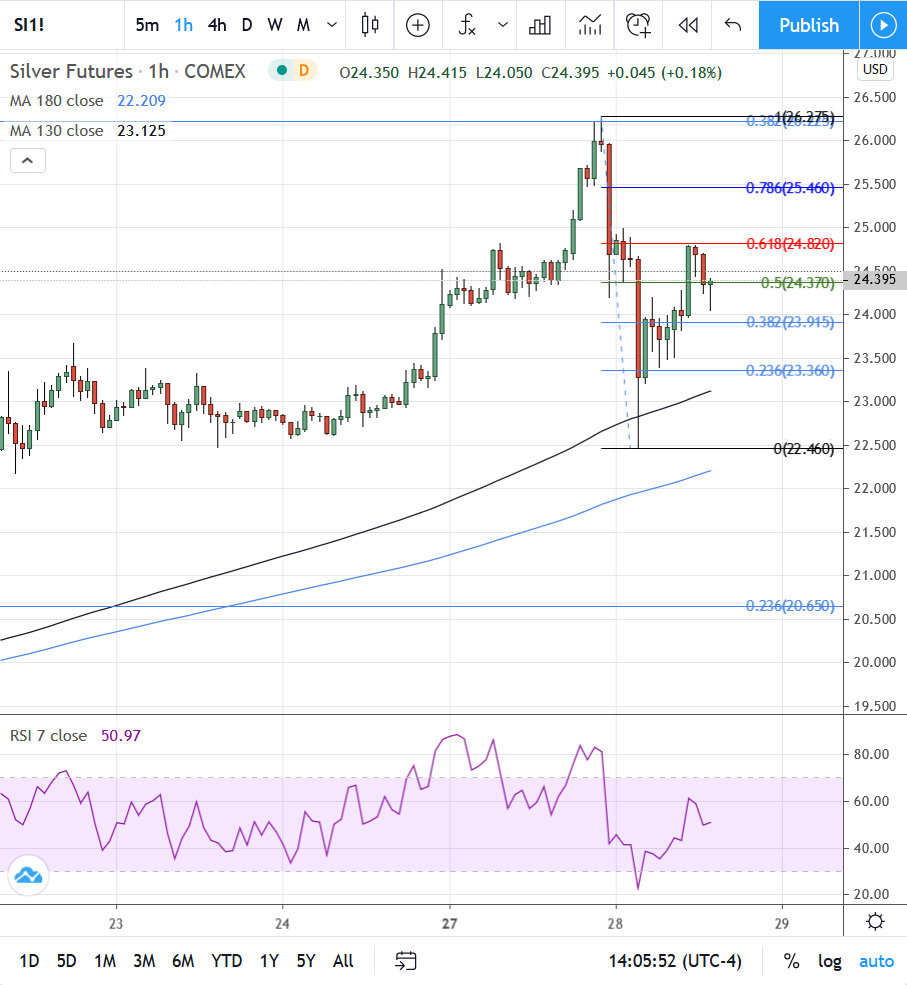
Well Bubba, maybe silver has had all the pullback it’s going to for now!? I’m not sure this morning. The chart is an hourly interval and silver did already retrace almost to the 62% level, held MA support and has been forming another adam & eve bottom which is outlined on the chart. If this formation plays out then a breakout from 24.795 should take silver to around 27.14. Won’t take long to find out if this one is legit. We’ll know by late morning.
2 Likes
Thank you SO much ! I’ll be watching this morning.
And further congratulations are in order for MUX! Maybe I should have been more patient, but I just had better things to do with my money at the time.
1 Like
ASM
First chart is a weekly showing ASM has retraced a tad over 62% of its last major high @ 1.60.
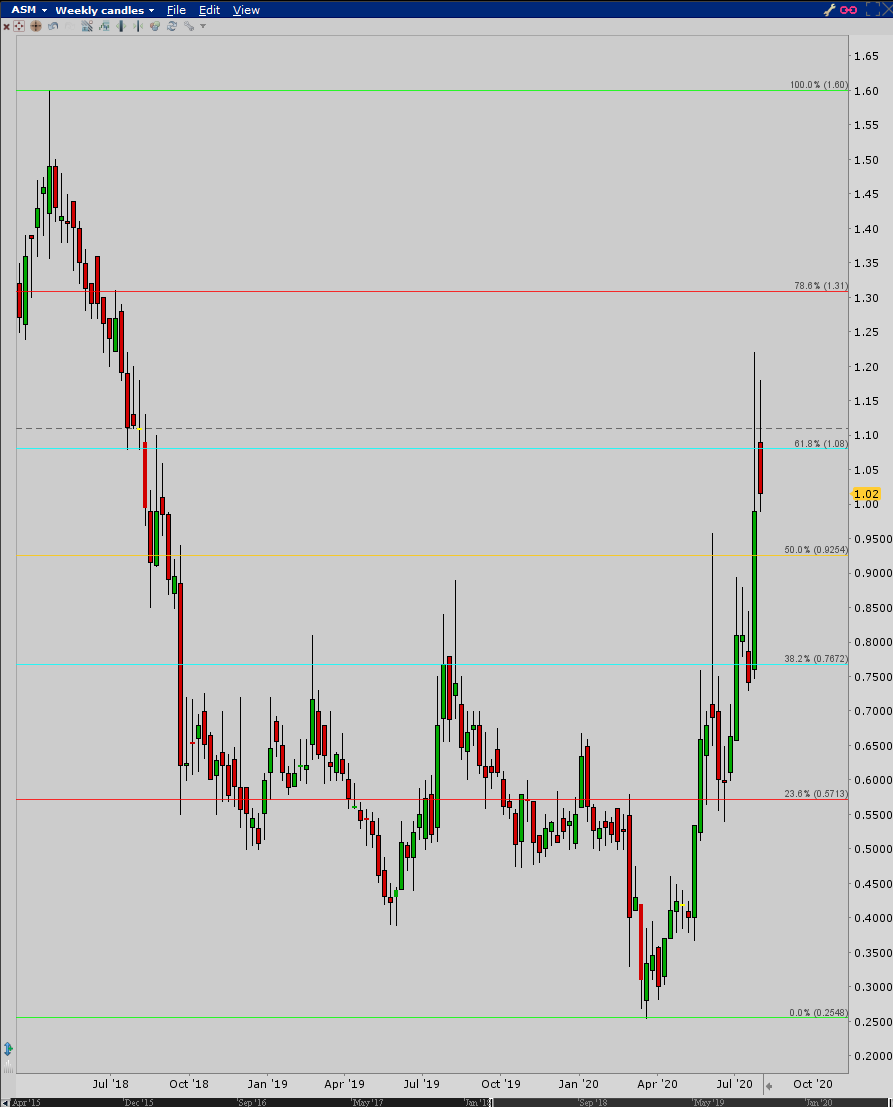
Second chart is for using the Fibs to try to determine support areas for the drop. As usual watch the 50 & 62% areas.

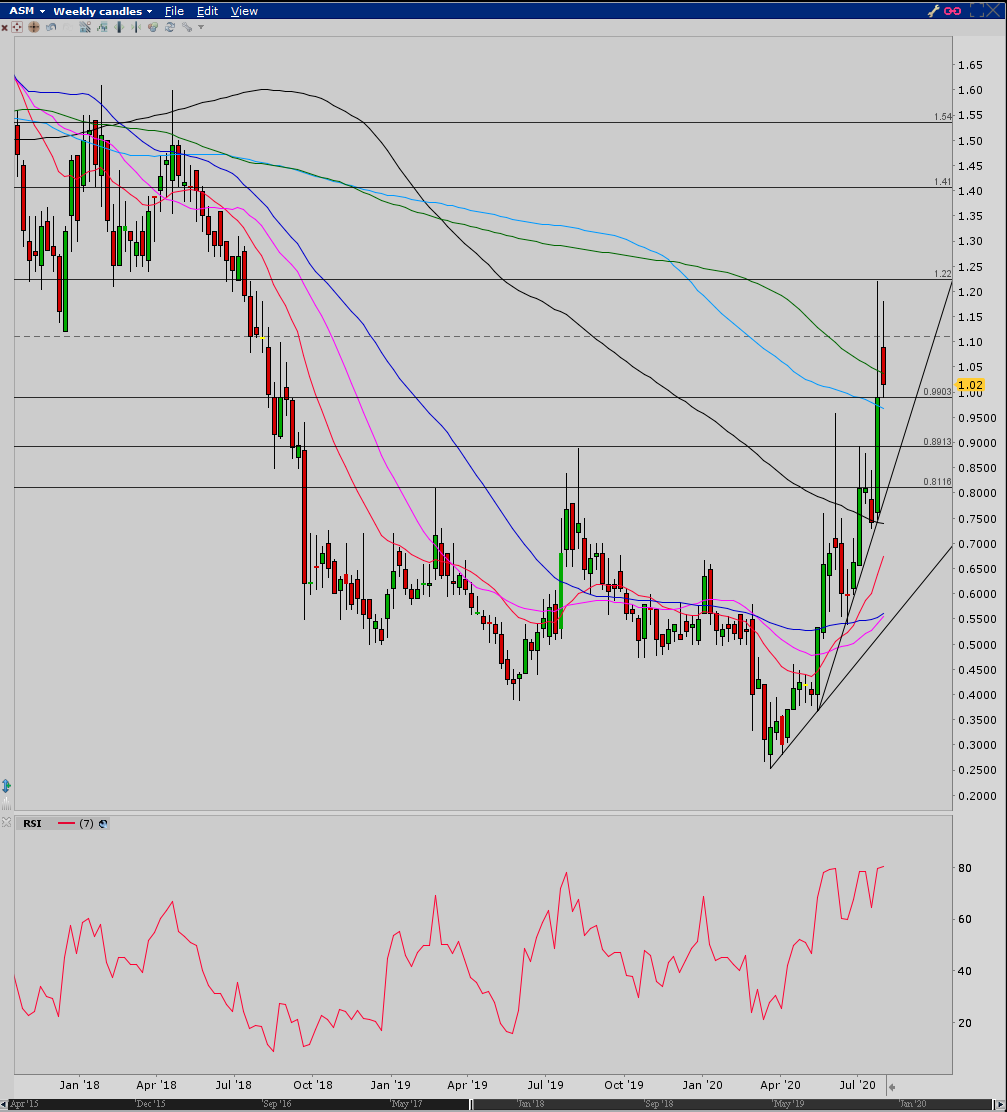
Next up is a weekly interval with some horizontal support/resistance areas drawn and two trend lines to keep an eye on for support. The stock is now dancing with the green 200 weekly MA and heading for the lt blue 180 MA. The 20 EMA, which tends to be the best support during strong uptrend moves, is at around .68 and will move up rapidly. The RSI is in the 80’s so still overbought from that perspective.
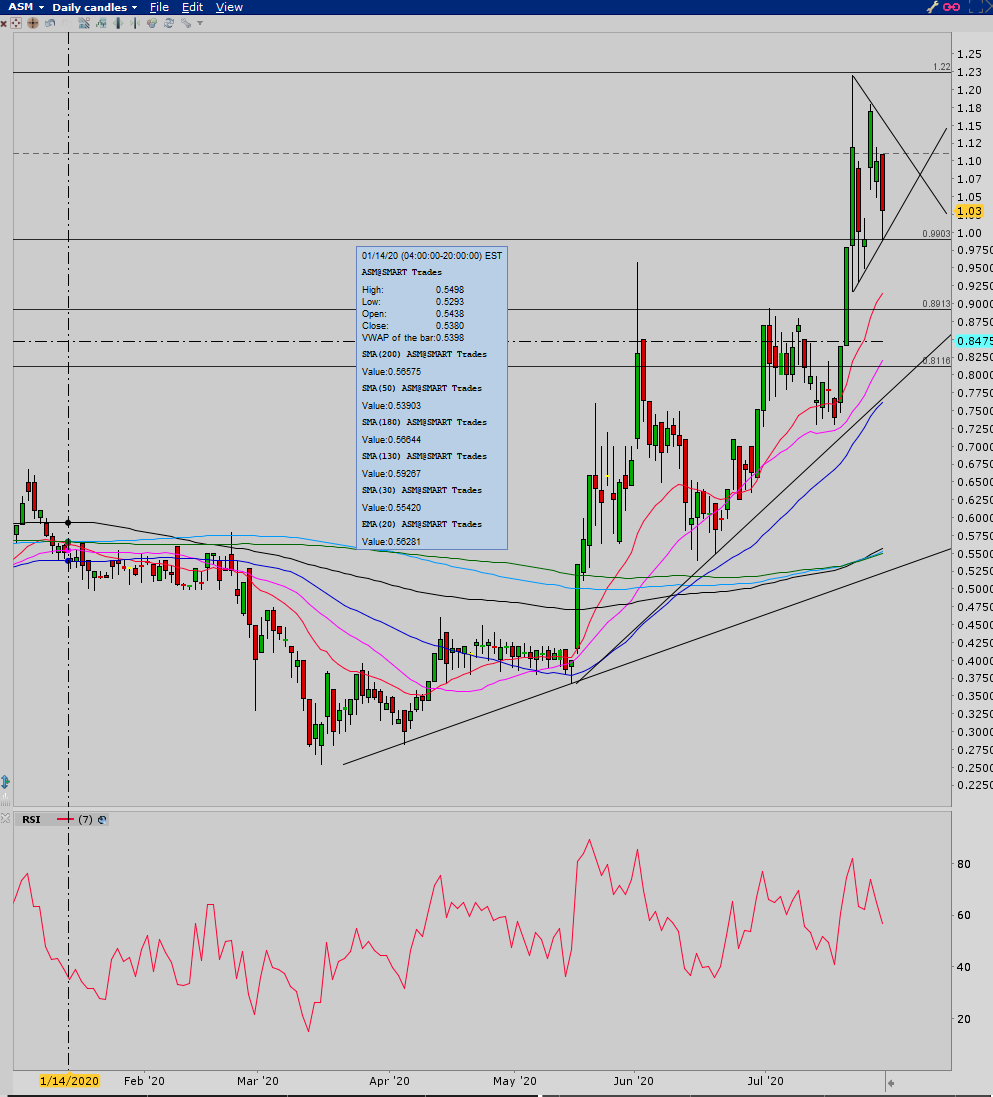
The daily chart currently looks like it could be working out a symmetrical triangle after its move last week. A breakout will take it to around 1.38 and nullify the daily chart with the Fib retracements I posted above. If the triangle doesn’t play out, three MA’s (20 EMA, 30 MA, and 50 MA from highest to lowest, red/pink/blue), are potential support below.
1 Like
Yeah, I figirued silver was going to have a bad day today, but I’m long so wasn’t going to sweat it. Not doing so bad!!! I’m hoping silver hits $30+.
2 Likes
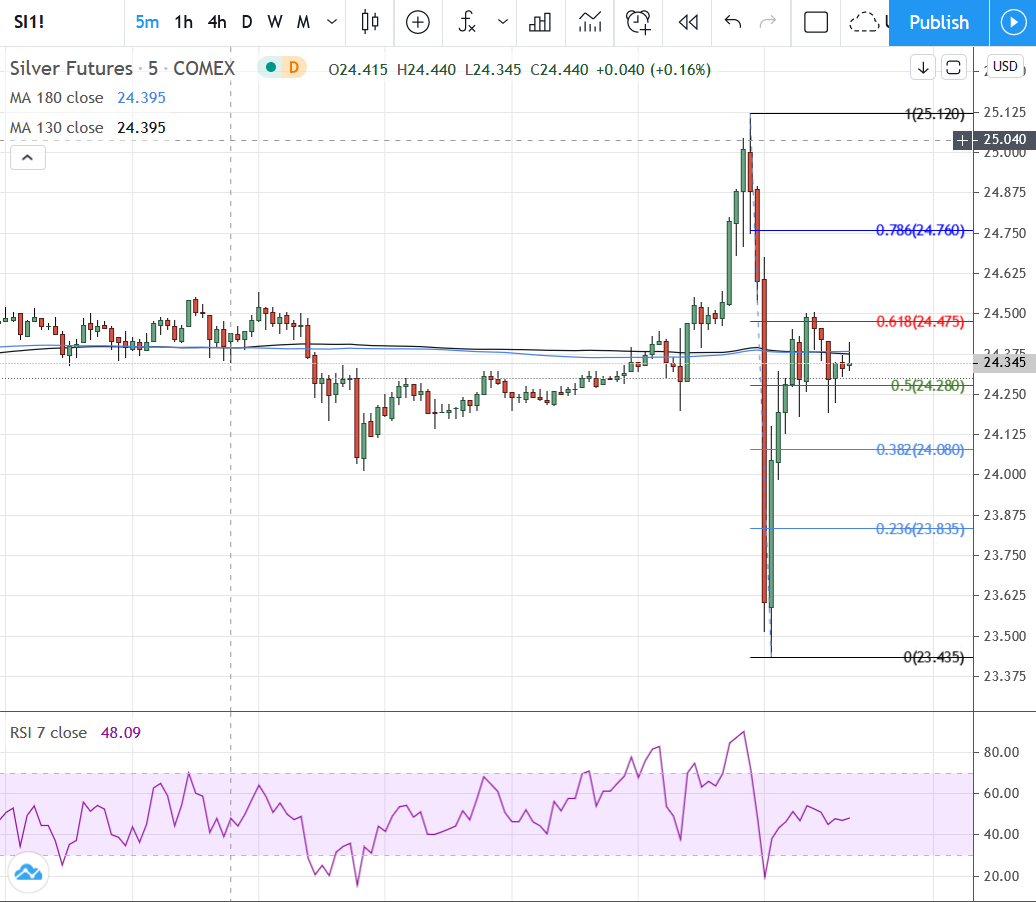
The only excitement for silver today came at 2:30 EST when it had a breakout to 25.12 followed by a hard dump to 23.435 and then a retracement right back to where it all started.
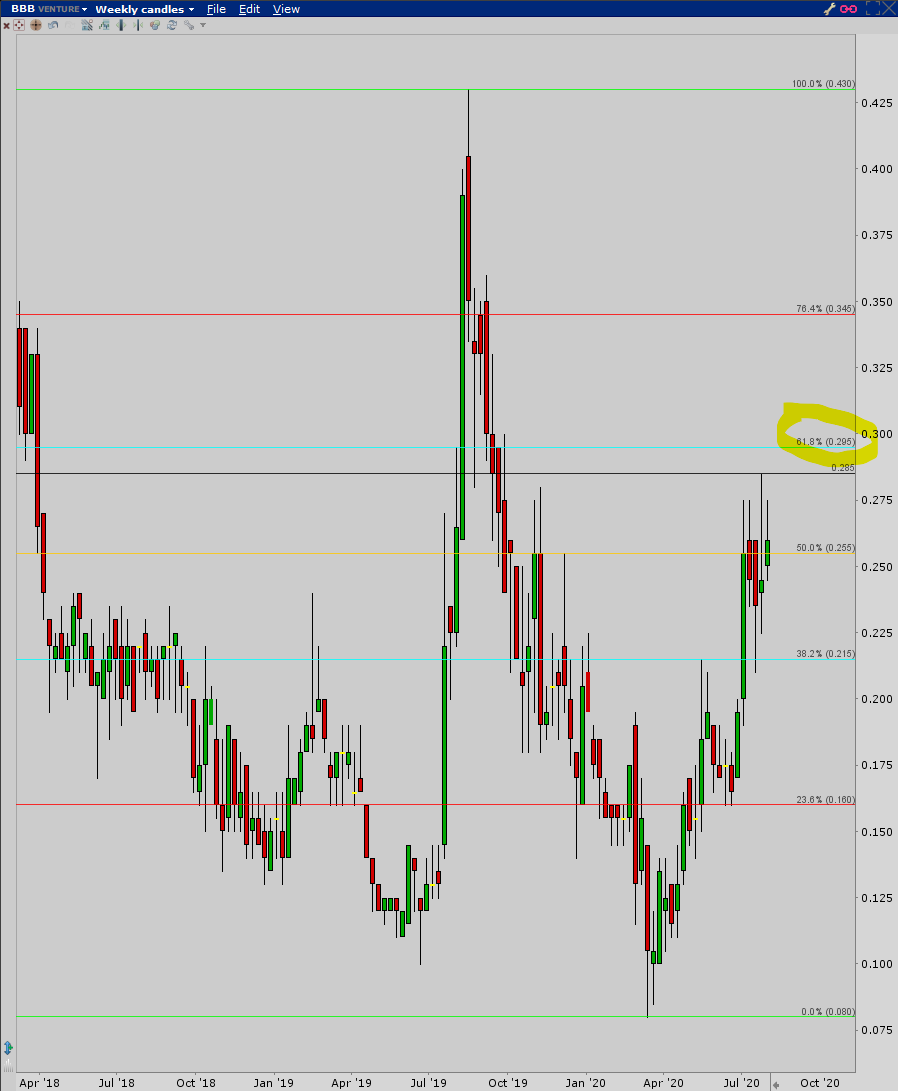
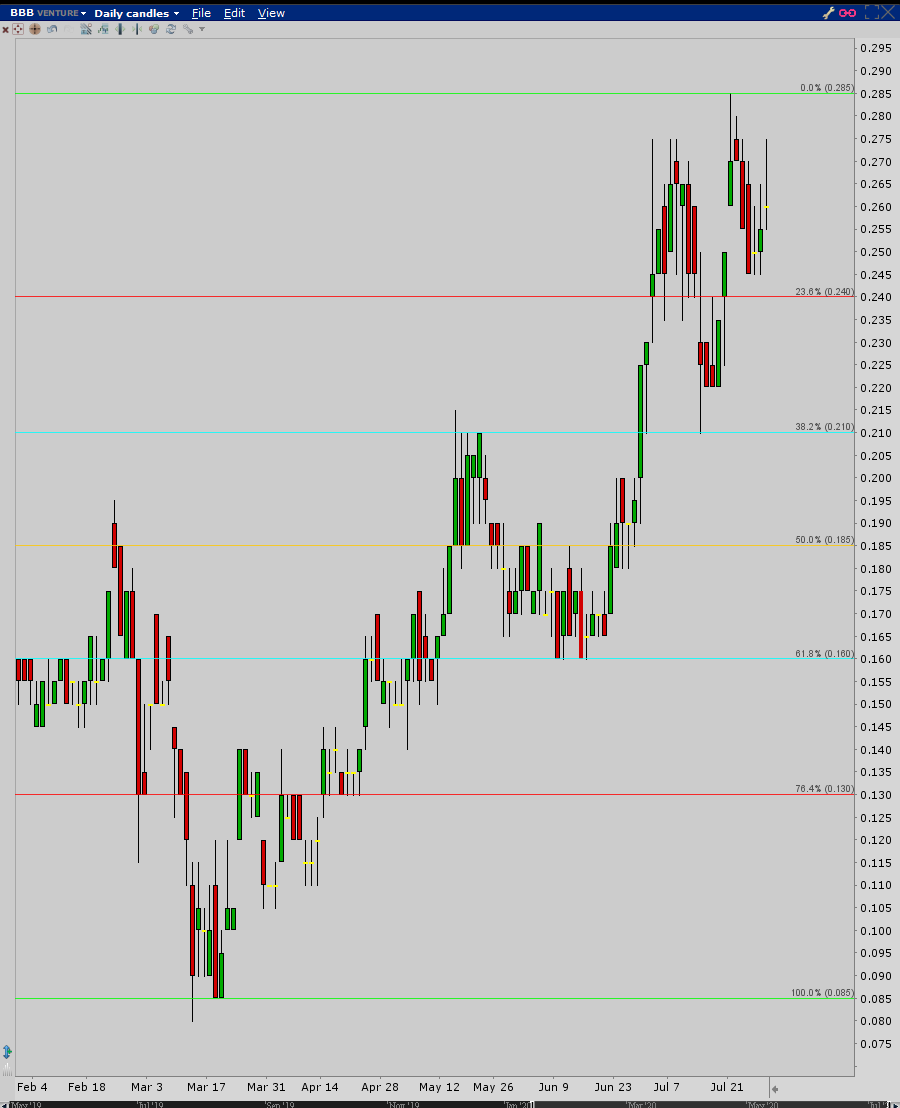
BBB/BBBXF - These charts look exactly the same so I’m going to chart the TSX version.
Another weekly interval 62% retracement (almost). This one missed by a penny. The question is if it is flagging for a push higher or not.
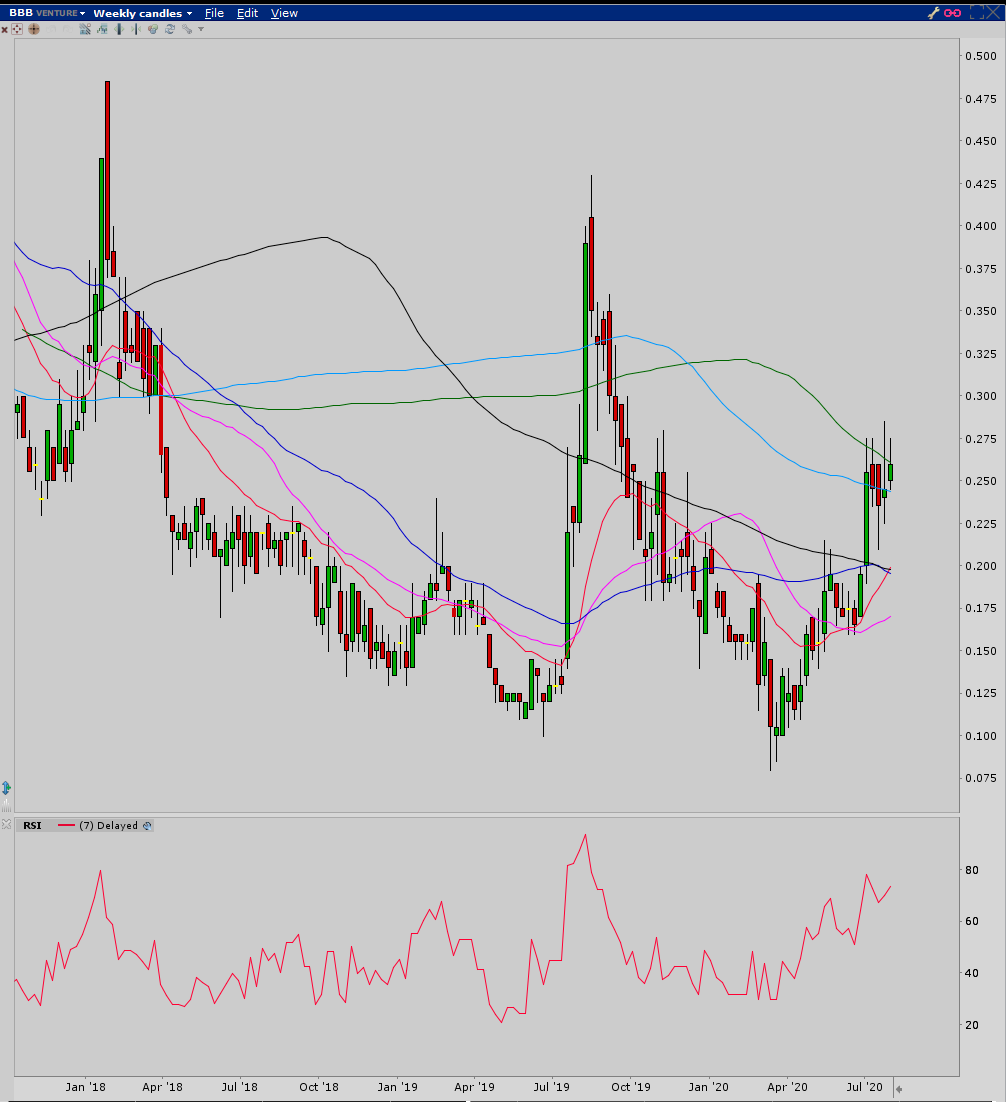
This one has tested the 200 weekly MA for 5 days now and hasn’t closed above it yet. It came close to closing on it today, but not quite. The 180 MA acted as support today, so a little more strength showing in the stock. There is a bit of divergence on the RSI when a new high was hit last week, but there’s two days left this week.
So far on the daily interval the 20 EMA is support on this uptrend. The pink 30 is below, but that tends to work more on the weekly chart, so I would be more inclined to expect a drop to the blue 50 MA if it falls out of the current formation, which unfortunately is a rising (bearish) wedge. Rising wedges don’t always work as bearish formations, but that is the exception and not the rule.
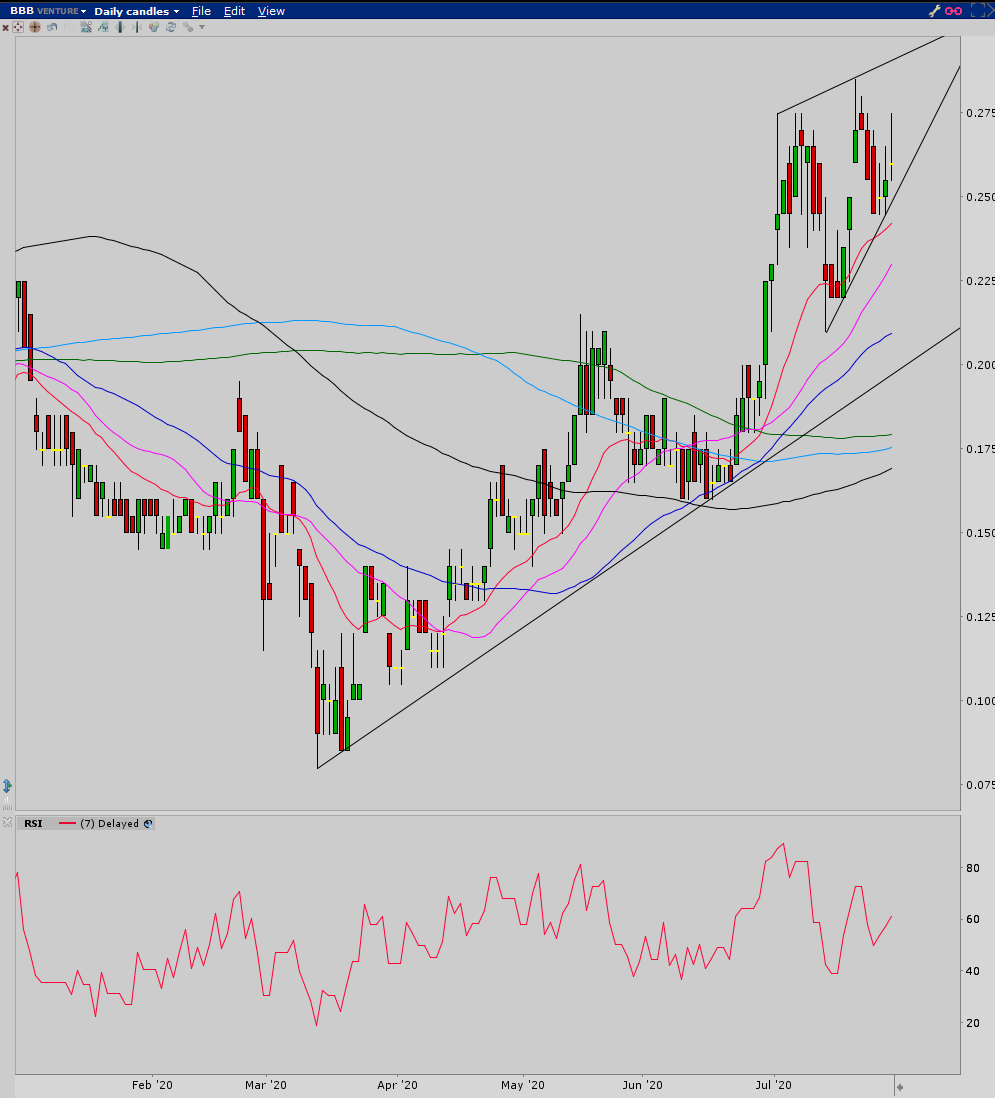
In the event that this does a deeper retracement that involves the entire move the stock has had, you’ll know it because that last dip that found support at .21 will be breached and you’ll end up seeing the 50 and/or 62% retracement levels on this chart tested.
1 Like
BYN
This one doesn’t have a lot of history, at least on my software, so I’m sticking to the daily intervals and shorter. The first daily interval is a Fib retracement covering the breakout point to the high. The stock has already done a 62% retracement, went back to the previous high, revisited the 50% level and rebounded 62% of that drop. Since then it’s been consolidating in a narrow range, so at some point there’s going to be a move one way or another out of that. If there’s another move to .32 then you’ve got a nice ascending triangle, which tends to be a pause before continuing higher. If it plays out that way then your target price is .435.
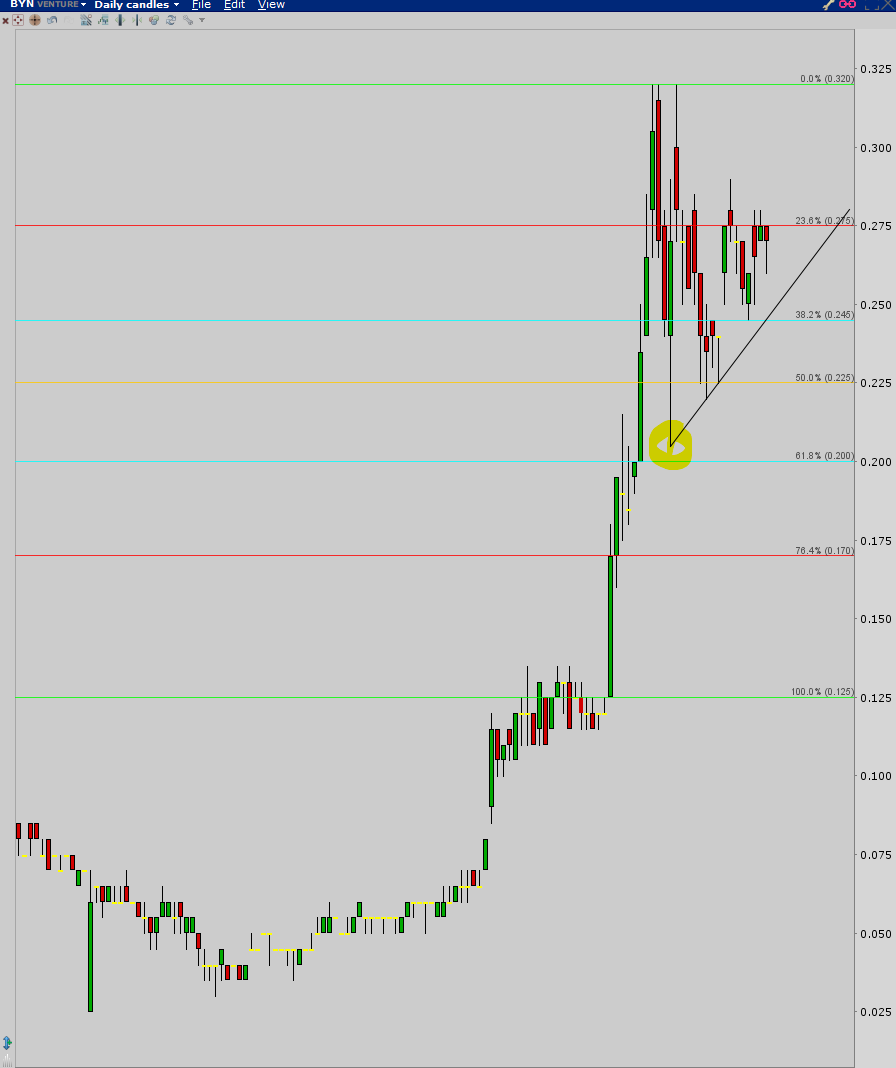
If the ascending triangle doesn’t play out, there aren’t very many horizontal support areas lower. Probably best to use the 50 MA on this chart first.
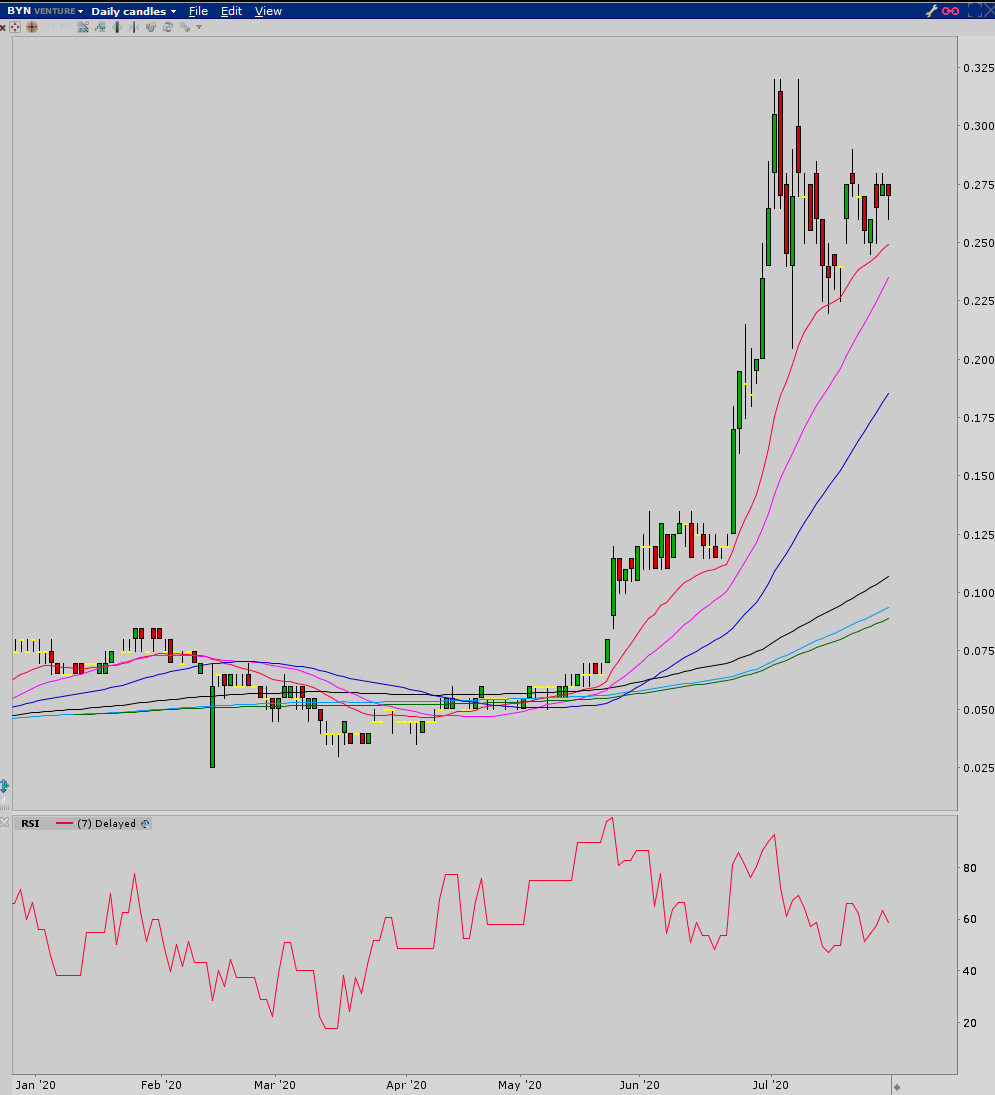
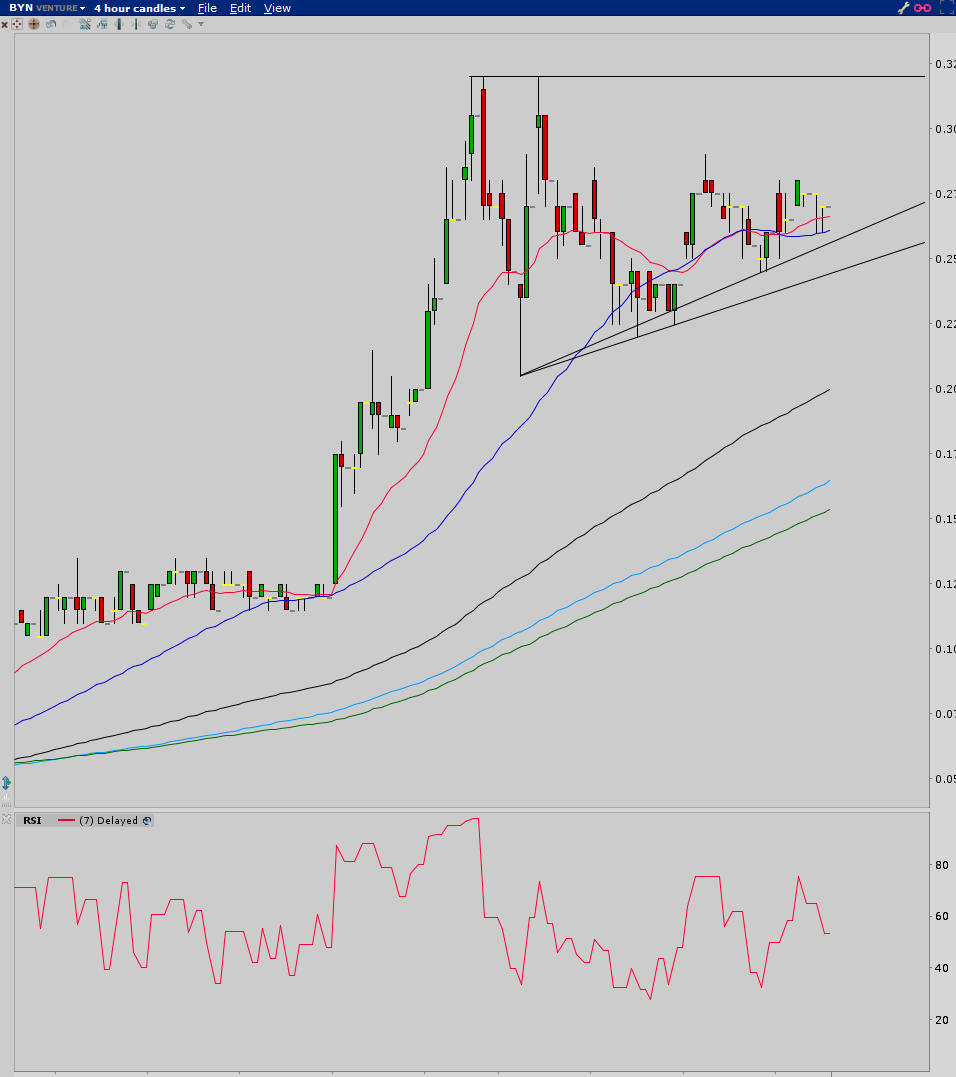
You can also check the 130, 180, and 200 MA’s on the 4 hour interval chart…
I may get to do some more later tonight…
TR,
Thanks for the charts on ASM and BYN.
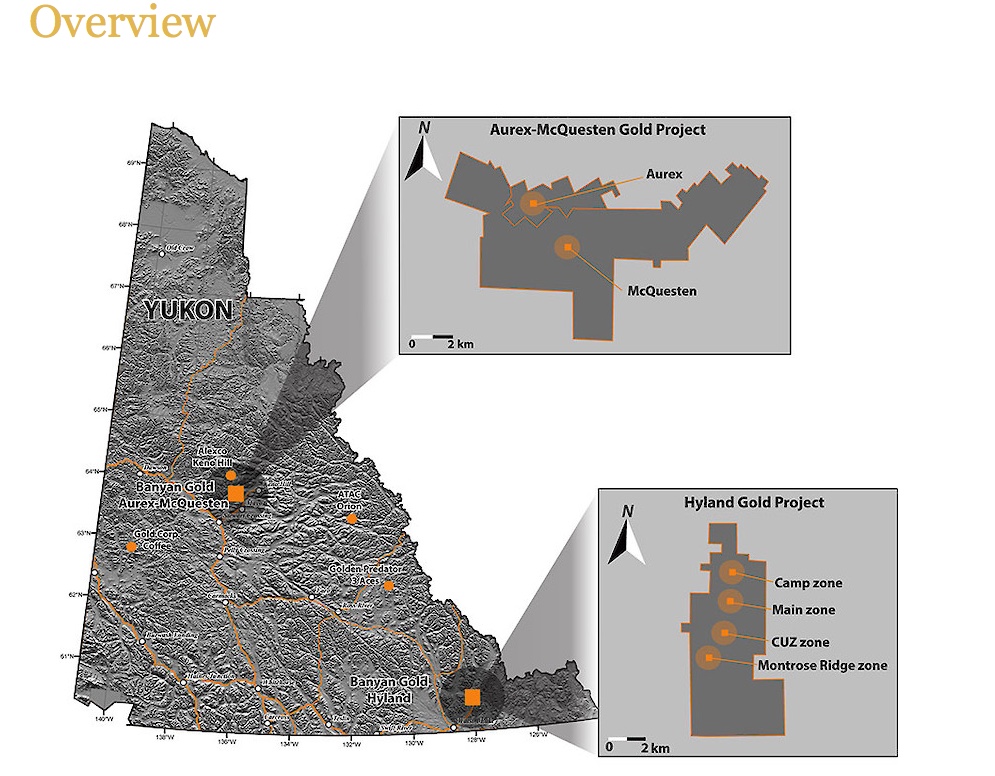
As you noted, there is very little history on Banyan Gold, but I expect this exploration season with new financing may change that.
BANYAN ANNOUNCES CLOSING $4.32 M FIRST TRANCHE OF FINANCING AND INCREASE TO $4.74 M IN TOTAL
VANCOUVER, July 29, 2020, Banyan Gold Corp. (the “Company” or “Banyan”) (TSX-V: BYN) is pleased to announce, subject to approval by TSX-V, that it is closing the first tranche of $4,320,000 of the private placement announced July 8, 2020 (the “Private Placement”) and, due to strong demand, further announces an increase in the total size of the Private Placement to $4,740,000 with the second and final tranche expected to close on or before August 6, 2020.
The Company intends to use the net proceeds from the Private Placement to advance its mineral exploration and development projects and for general corporate purposes. The Phase 2 Exploration Program at AurMac will include additional diamond drilling, geotechnical drilling, metallurgical test work, environmental baseline data collection and community consultation.
The first tranche includes a combination of 12,500,000 Charity Flow Through Shares at $0.28, 2,000,000 Flow Through Shares at $0.25 and 1,600,000 Common Shares at $0.20 (together the “Offering”). The upsized financing of $420,000 will consist of 1,500,000 Charity Flow Through Shares at $0.28 and is expected to close as part of the second and final tranche.
https://www.banyangold.com/news-releases/2020
BANYAN ANNOUNCES 903,945 GOLD OUNCE INITIAL MINERAL RESOURCE ESTIMATE FOR THE AURMAC PROPERTY, YUKON, CANADA
VANCOUVER, May 25, 2020, Banyan Gold Corp. (the “Company” or “Banyan”) (TSX-V: BYN) is pleased to announce an Initial Mineral Resource Estimate in accordance with the Canadian Institute of Mining, Metallurgy and Petroleum (“CIM”) Definition Standards incorporated by reference in National Instrument 43-101 (“NI 43-101”) for the Aurex and McQuesten properties (together, the “AurMac Property”)[1] located in the Mayo Mining district, approximately 56 kilometres northeast from the village of Mayo, Yukon and 356 kilometres north of Whitehorse, Yukon.
The Initial Mineral Resource Estimate comprises a total Inferred Mineral Resource of 903,945 ounces of gold on the near surface, road accessible AurMac Property.
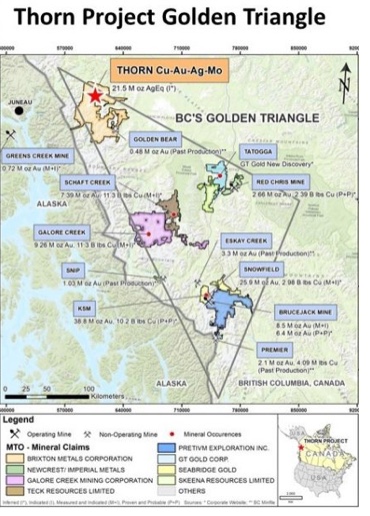
I certainly would like to see Brixton Metals be an exception to the usual rising wedge rule. Here is the link and excerpt from today’s announcement:
BRIXTON METALS SAMPLES 68.8 G/T GOLD AT ITS THORN PROJECT IN THE GOLDEN TRIANGLE AND ANNOUNCES AN UPSIZED AND FULLY SUBSCRIBED $5,500,000 PRIVATE PLACEMENT
July 29, 2020 – Brixton Metals Corporation (TSXV: BBB) (the “Company” or “Brixton”) provides an update on its Thorn Project exploration activities. Ongoing soil geochemical surveys and rock sampling has returned gold values up to 68.8 g/t Au from the West Outlaw target area where preparation for drilling has started.
Due to strong investor demand Brixton is pleased to announce it has increased its offering and is now fully-subscribed on its non-brokered private placement of a combination of units and flow-through shares of the Company for gross proceeds of up to C$5,500,000 (the “Offering“) as further described in its news release dated July 24, 2020.
Since June 2020, Brixton has collected 4,480 soil samples and 763 rock samples across several large-scale copper and gold targets on the Thorn Project. The Company completed 12km of IP geophysical surveys, which is the extension of the 2019 survey and two deep downhole IP geophysical surveys over the Camp Creek Porphyry target. Gold results to date from the Outlaw target are reported here and copper results will be reported in a separate news release upon interpretation of the geophysical and geochemical data and as it becomes available.
So far this season, a total of 972 soils and 39 rocks samples were collected over the Outlaw Target area. Four of the 39 rock samples returned greater than 2 g/t Au and two rock samples returned greater than 10 g/t Au, as 14.5 g/t Au and 68.8 g/t Au respectively. No drilling has been done in the Outlaw West area, which is a 1,000m by 500m gold-in-soil anomaly (see Figure 2 and 3 for soil contour plots).
>
Grabbing my last post of the other forum to see if it will re-post here…
Silver pulled back from its 26.275 high down to 22.46 and has since bounced back to a high of 24.795. The 62% retracement from the low of the drop back to the 26.275 high is 24.82. 24.795 is close enough that silver may continue its pullback now, imo.
I’m watching for a pullback to around 22.81 on the silver futures contract. If that level is reached and looks to move lower I’ll update. The 62% retracement level is at $22 even.

1 Like
Here’s what Silver looks like this morning on the hourly chart. Yesterday the highlighted formation was looking a lot like an adam & eve bottom with a target of 27.14. Today it’s looking like an adam & eve top with the target of the breakdown from 22.46 being 18.645. Maybe they’ll cancel each other out and something else will happen.
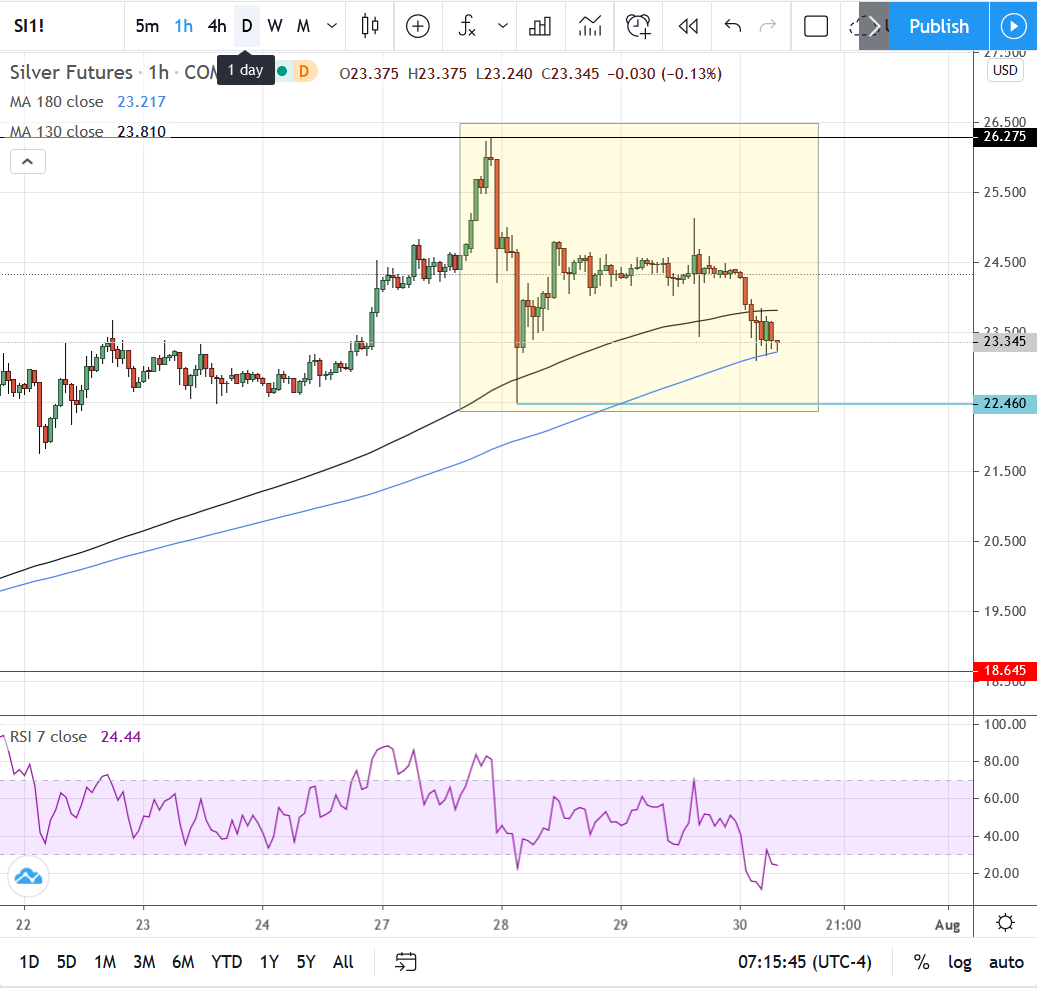
Silver looks very oversold on the RSI, so maybe it just bounces off the hourly 180 MA it’s been riding on the above chart for the last 5 hours, or maybe it holds the trend line in the chart below. There is also support to be found on either of the MA’s below.
1 Like
I missed this one and don’t have a position! It is next to the Blackrock claims in Nevada. It appears to be tightly held. I’d buy on any sustained pullback. Summa Silver Corp. has a well developed website worth visting, FWIW.
Summa Silver Corp. Announces $8,000,000 Private Placement Financing, Including a Lead Investment by Eric Sprott
Jul 21, 2020 | News Releases
Summa Silver Corp. (“Summa” or the “Company”) (CSE:SSVR) is pleased to announce a non-brokered private placement financing of Units of the Company (the “Units”) at a price of $1.00 per Unit (the “Offering”) for gross proceeds of $8,000,000. Participation in the Offering is expected to include a lead order of $5,000,000 from Mr. Eric Sprott.
Each Unit will be comprised of one common share of the Company (a “Common Share”) and one-half of one Common Share purchase warrant (each whole warrant, a “Warrant”). Each full Warrant shall be exercisable to acquire one Common Share (a “Warrant Share”) at a price of $1.75 per Warrant Share for a period of 24 months from the closing of the Offering. If the closing price of the Common Shares is at a price equal to or greater than $3.00 for a period of ten consecutive trading days, Summa will have the right to accelerate the expiry date of the warrants by giving notice, via a news release, to the holders of the Warrants that the Warrants will expire on the date that is 30 days after the issuance of said news release.
Galen McNamara, CEO of the Company, stated:
“This financing represents another landmark for Summa Silver and we very much appreciate the strong and continued support from Mr. Sprott. Once this financing closes, we will be in a robust financial position with over CAD $12 million on hand. We look forward to the assay results from the on-going drill program on the eastern side of the re-emerging high-grade Tonopah silver district of central Nevada. We now anticipate being able to aggressively expand the on-going drill program and will look to add additional drills on site in the near future.”
About Summa Silver Corp
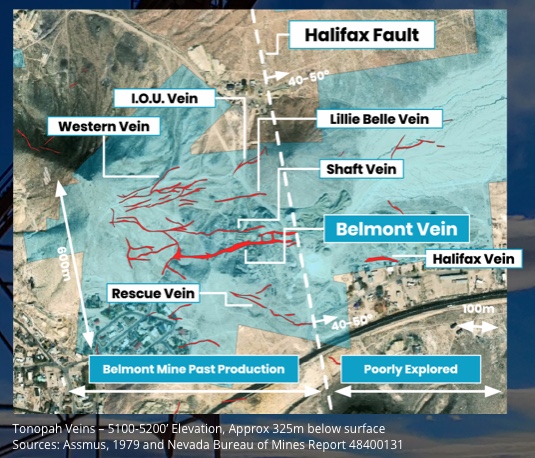
Summa Silver Corp is a Canadian junior mineral exploration company. The Company is focused on the Hughes Property located in central Nevada, which is host to the high-grade historically producing Belmont Mine, one of the most prolific silver producers in the United States between 1903 and 1929. The mine has remained inactive since commercial production ceased in 1929 due to heavily depressed metal prices and little to no modern exploration work has ever been completed.
Summa Silver Mobilizes Drills to the Hughes Property; Files NI 43-101 Technical Report
Jun 30, 2020 | News Releases
Summa Silver Corp. (“Summa Silver” or the “Company”) (CSE: SSVR)(Frankfurt: 48X) is pleased to announce that mobilization of drilling equipment to the Hughes Property is in progress. Additionally, the Company has filed an independent Technical Report for the Hughes Property on SEDAR.
Drill Program Update:
Drill Mobilization Underway: The Company is currently mobilizing one reverse-circulation drilling rig and one core drilling rig to the Hughes Property.
Drilling Imminent: The summer drill program will consist of a minimum of 7,500 m of drilling in approximately 15 holes (see news release dated June 25, 2020).
First Modern-Day Exploration: The first drill holes will test the immediate area of the Company’s historically producing Belmont Mine, which is reported to have produced 36.7M ounces of high-grade silver and 428,000 ounces of gold, but has never been systematically explored.
Multiple Targets per Hole are Planned: The stacked nature of the veins in the Belmont Mine area means that many of the planned holes will test multiple potentially mineralized structures.
With the recently completed $5M financing, the Company is fully financed for this first round of modern-day exploration on the project.
SSVR has only been trading since mid-March. Nothing really to show on the charts yet other than so far the 130 MA on the hourly was support for a pullback.
That was easy…
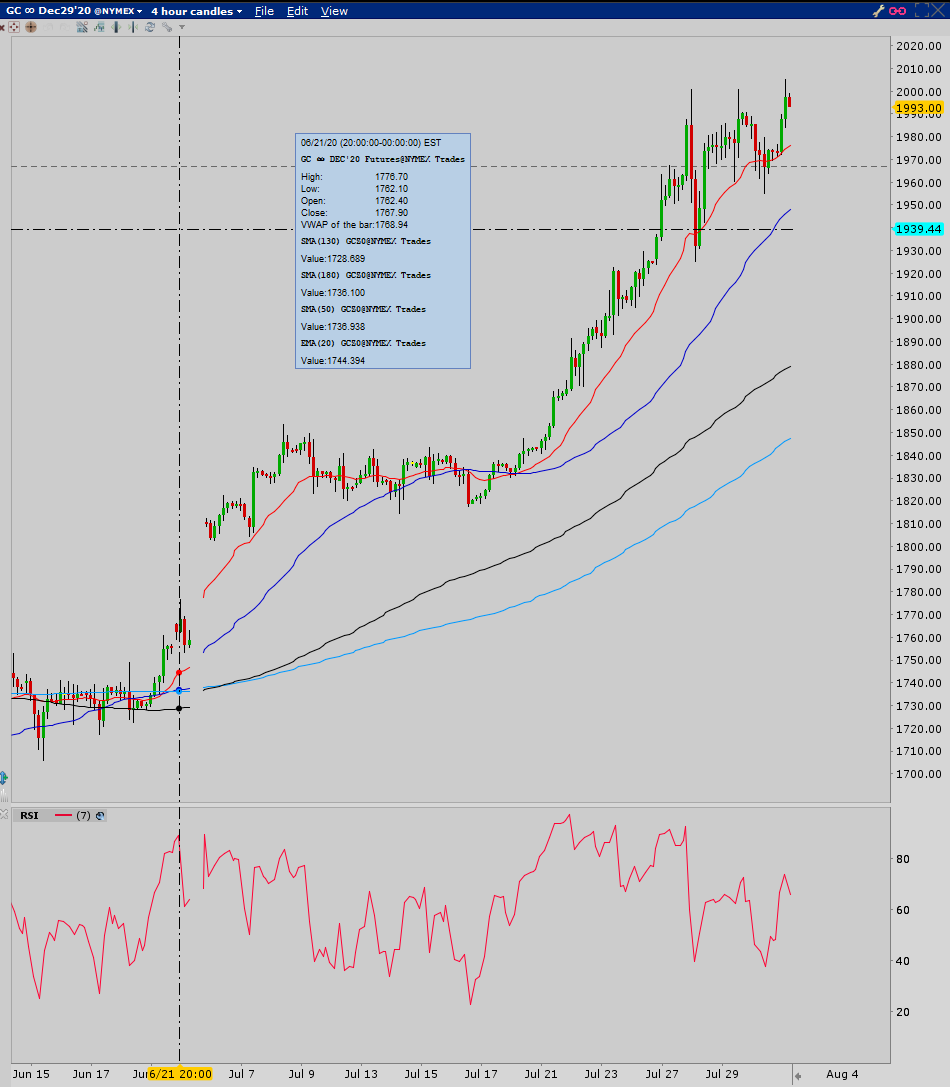
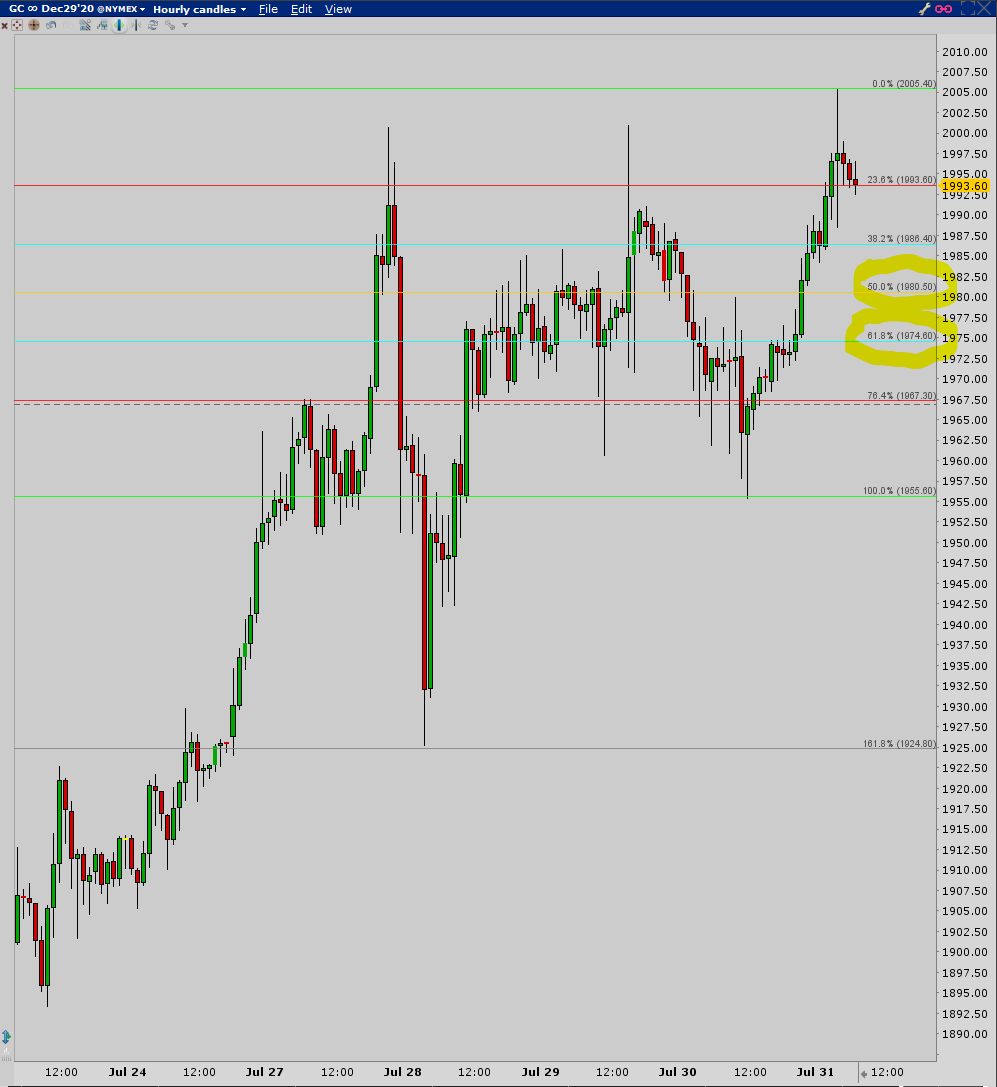
Gold futures broke the 2000 mark last night to $2005.40. So far it’s pretty much riding the 20 EMA on the 4 hour chart all the way up. There is RSI divergence on the price spikes, so some sort of retracement is coming from here. Watch the 50 and 62% retracements on the second chart.
3 Likes
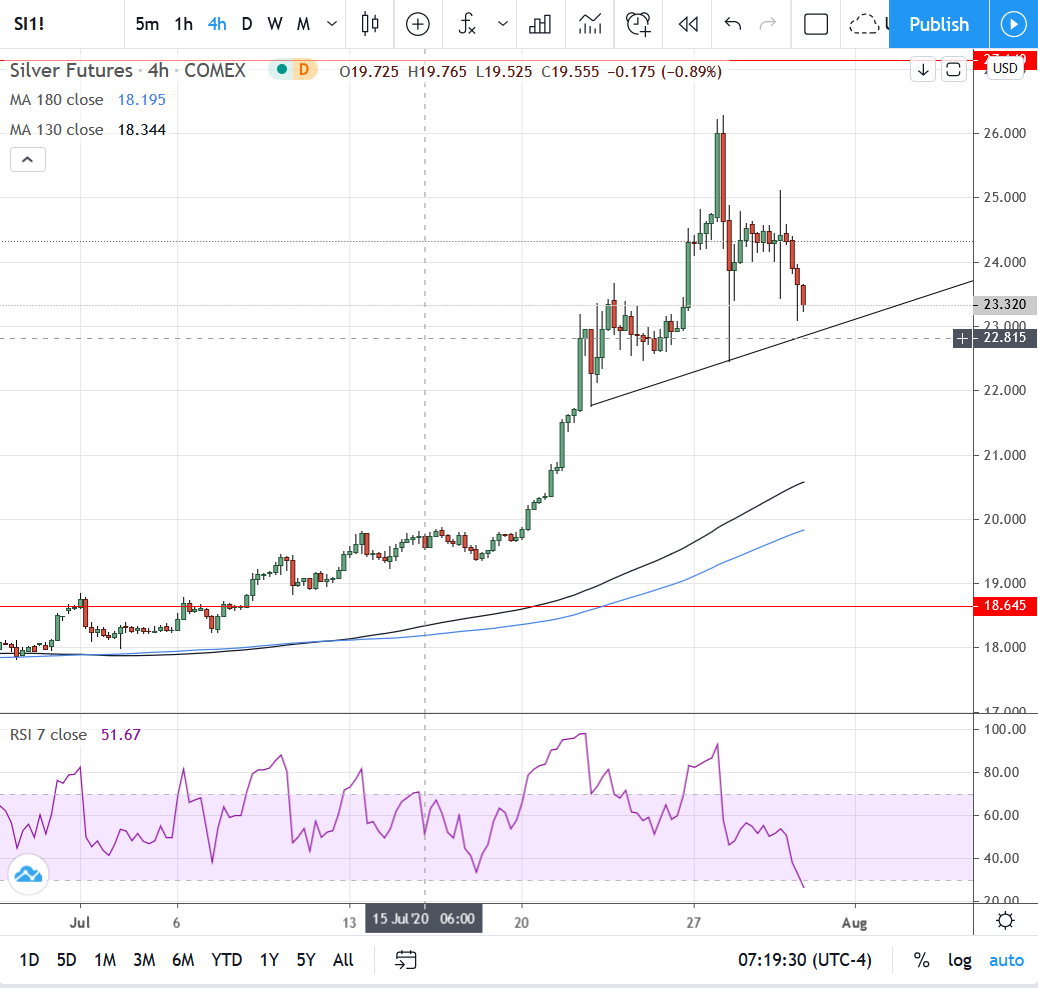
Silver, on the other hand, has been a little more mellow in its climb, instead preferring the 50 MA on the 4 hour interval chart for its ultimate support on pullbacks.

The daily chart is the least sloppy way to draw some sort of triangle as long as I ignore all that wick action. The shorter the time interval the more difficult it is to draw, so here’s the neat version…
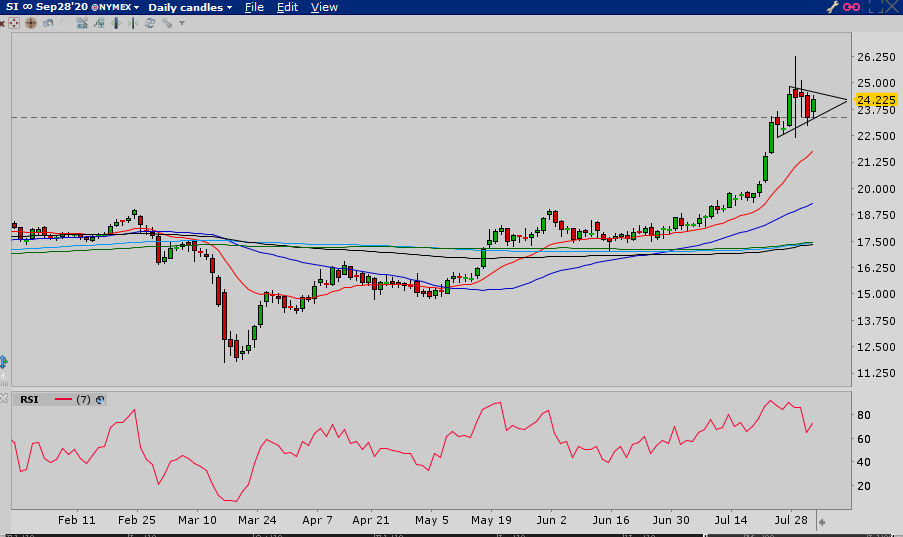
Now back to our regularly scheduled programming…
2 Likes