Sorry I wasn’t able to get all these done during the pullback. I blame gold and silver. After so many years of sitting on their ass, they’ve suddenly become impatient. Lots of charts on this one…
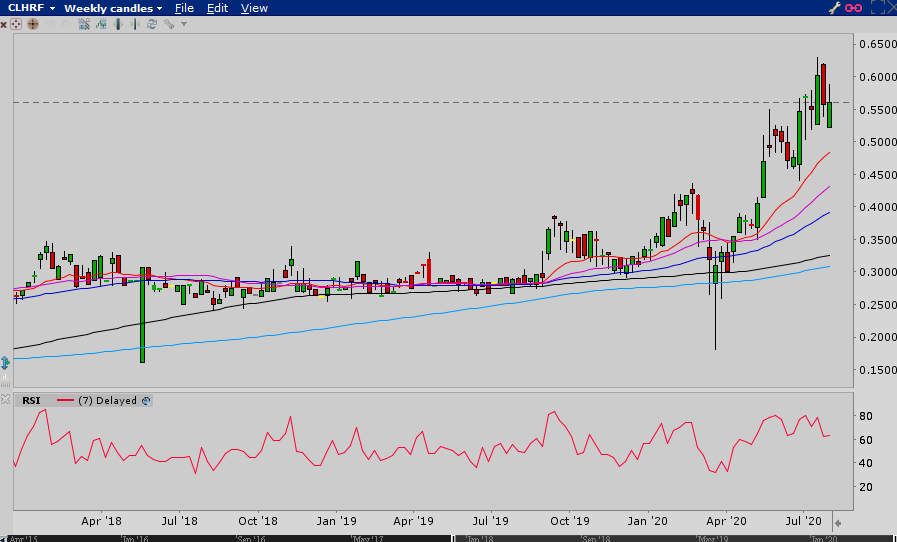
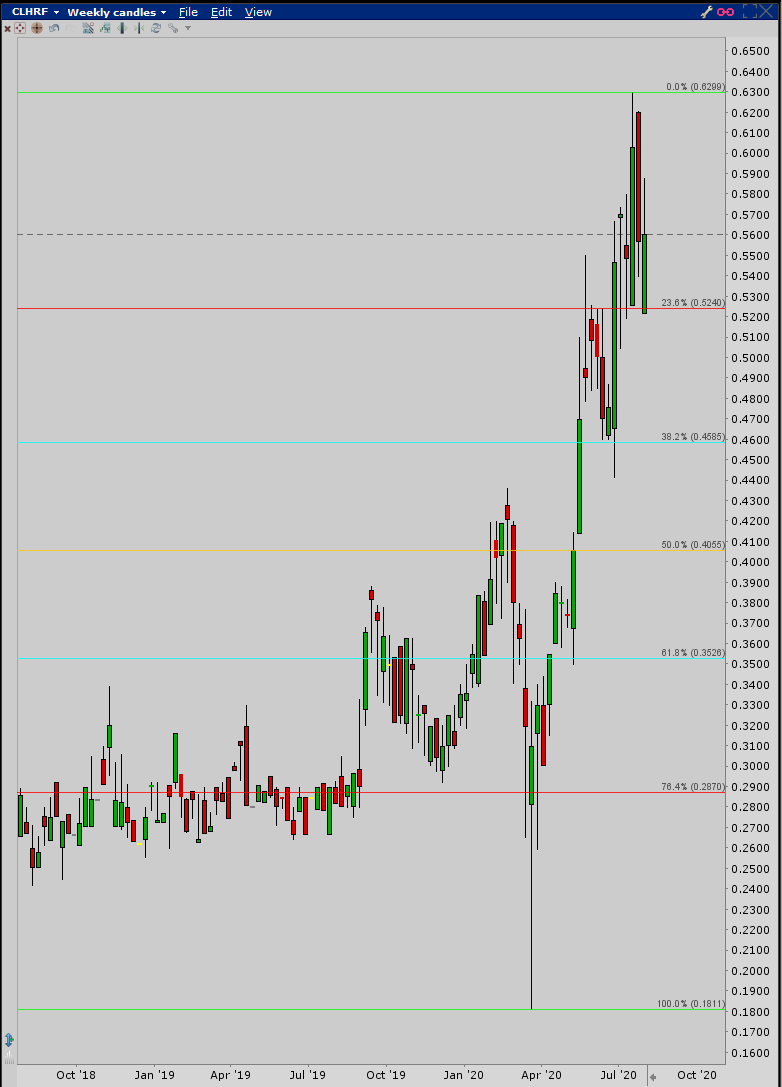
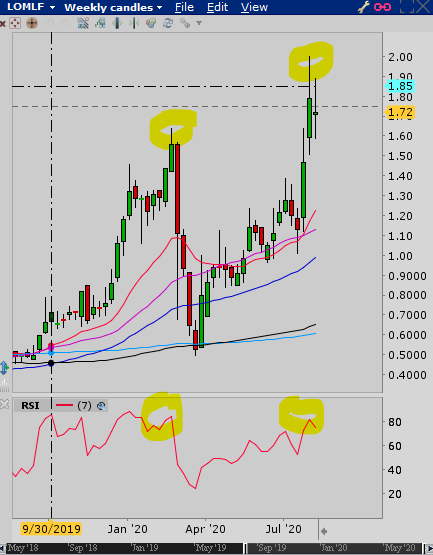
The weekly shows a nice recovery from the balonavirus, pulling back to the 30 MA before launching to new highs. The 20 EMA was support for the previous pullback from almost .55 to a tad below .45. There’s a bit of divergence on the RSI over the last two highs. Possibly more of a pullback coming.
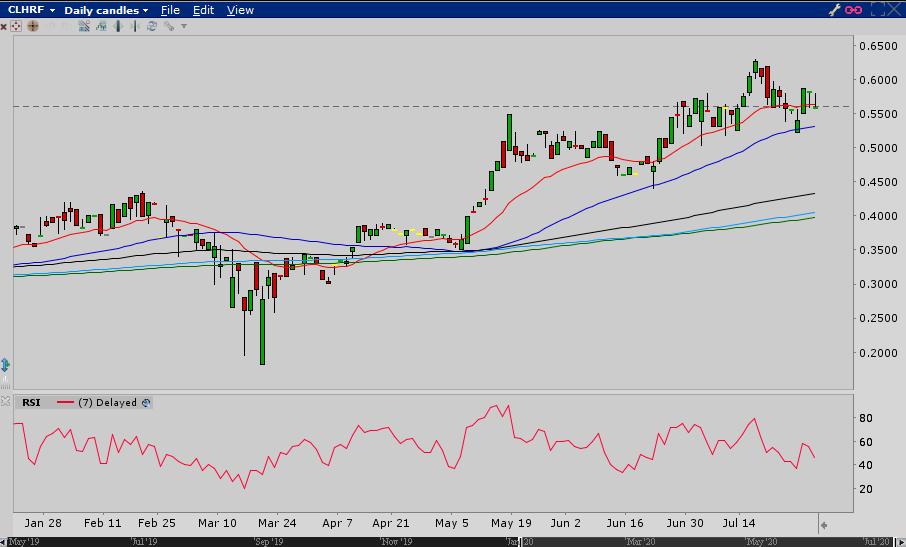
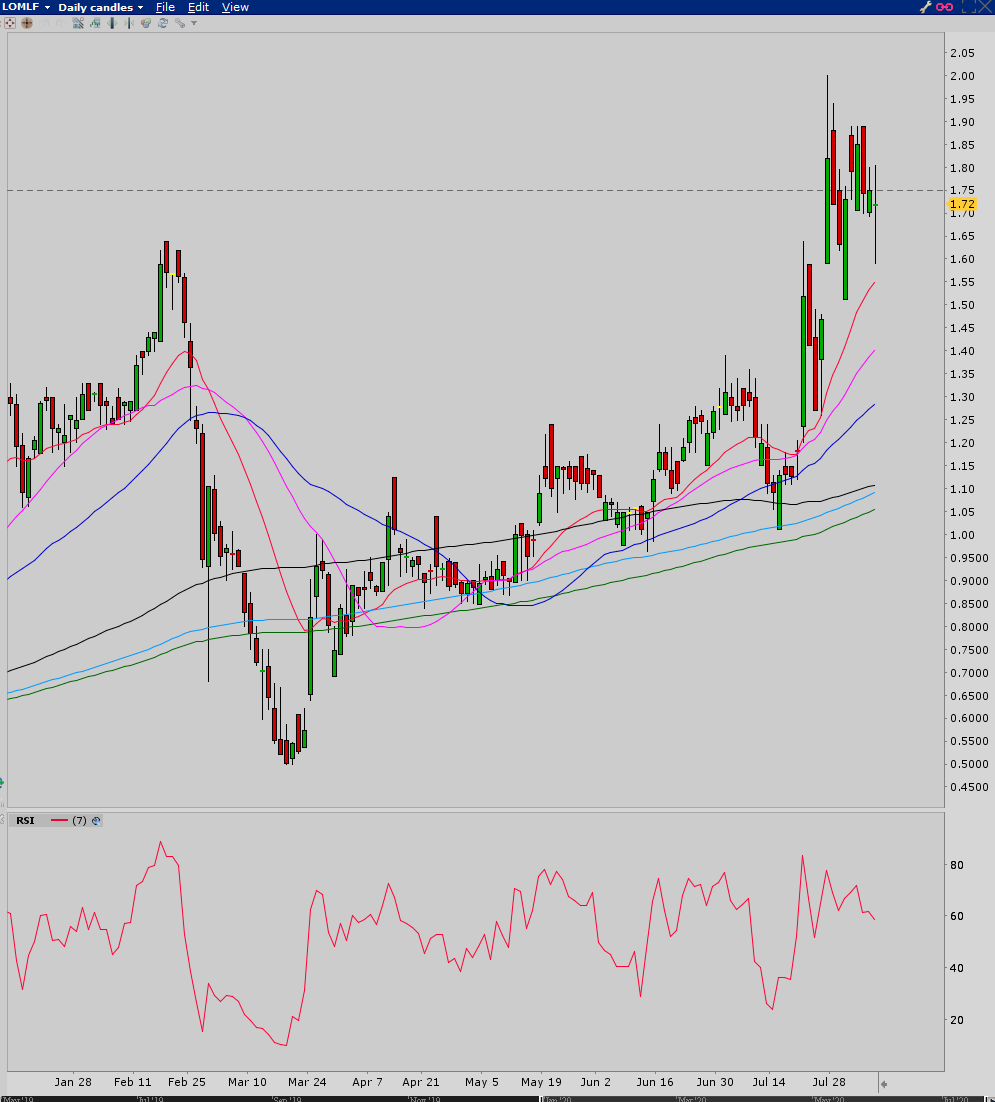
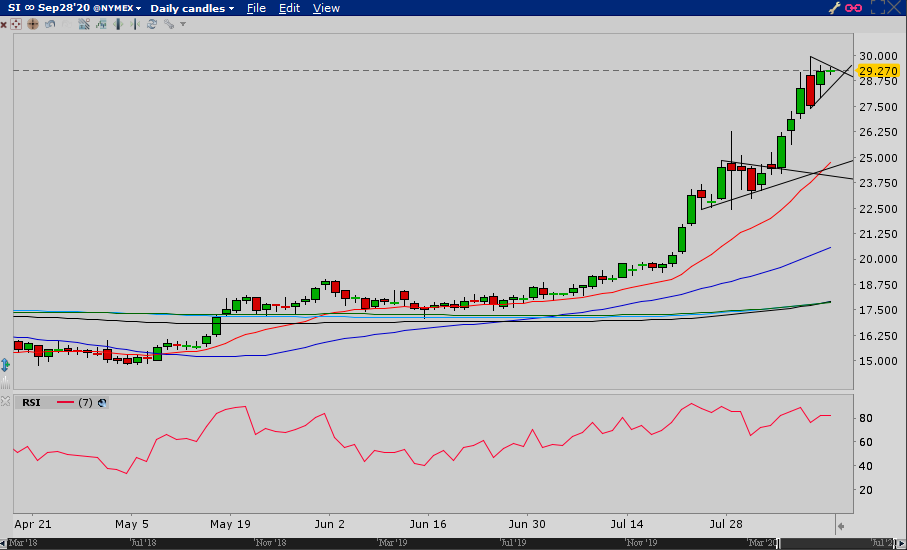
The daily interval shows the blue 50 MA is the fav so far on pullbacks. If you look at the RSI where the high was hit around May 19, and then look at the RSI when a slightly new high was hit in early July, then the next high just after July 14, the RSI readings get lower. Divergence. I’m thinking the 50 MA might not hold support on the next pullback.
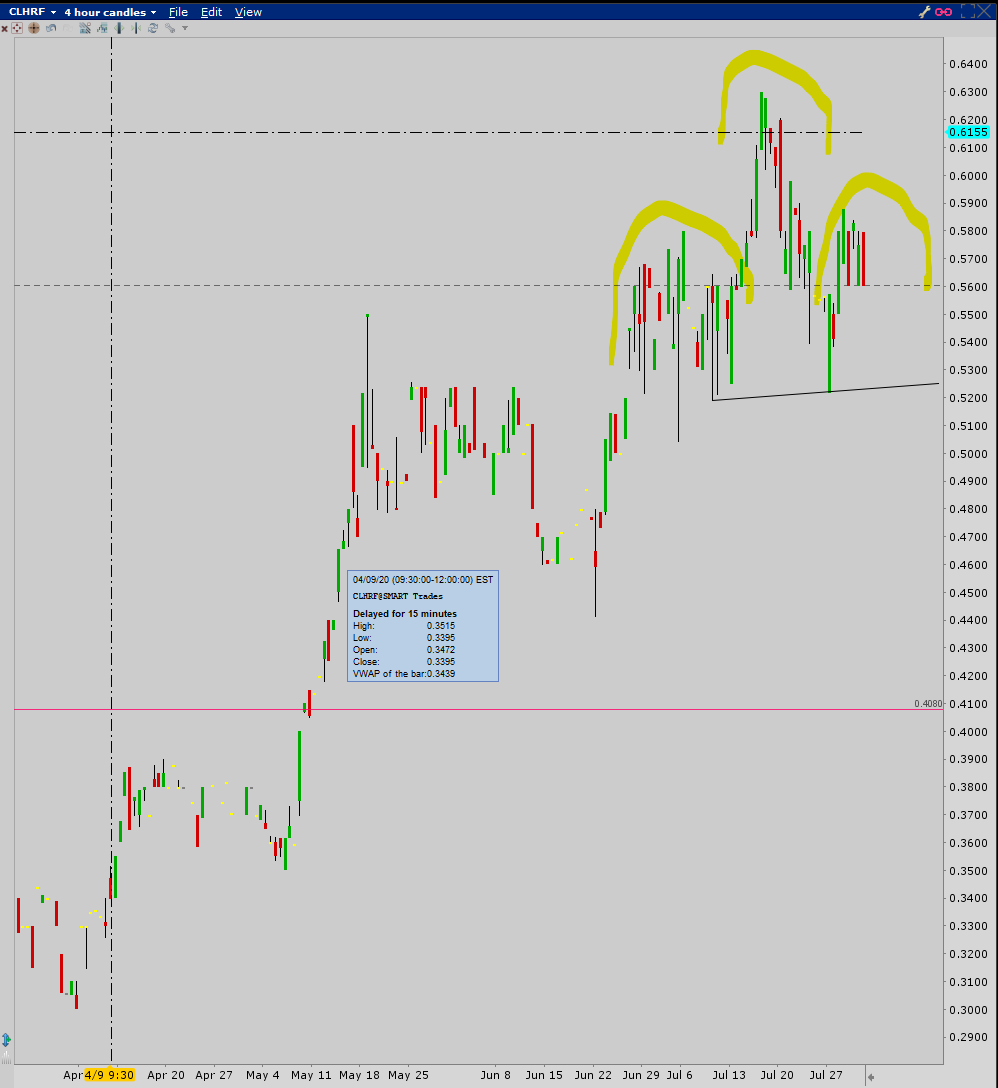
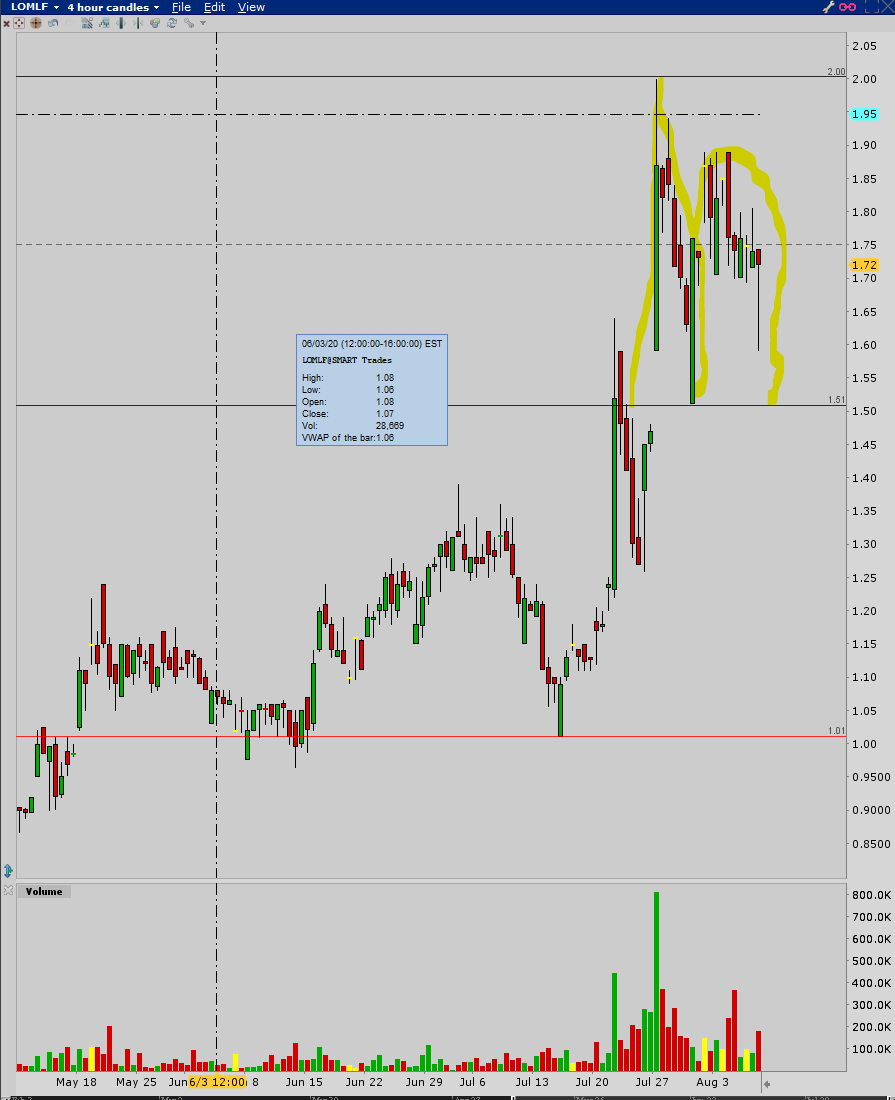
The highlighter arcs on the 4 hour interval chart show that about 90% of a head & shoulders top has been formed. If it plays out the breakdown will occur a tad below .53 with a target price of precisely .4082, give or take a few thousandths of a penny.
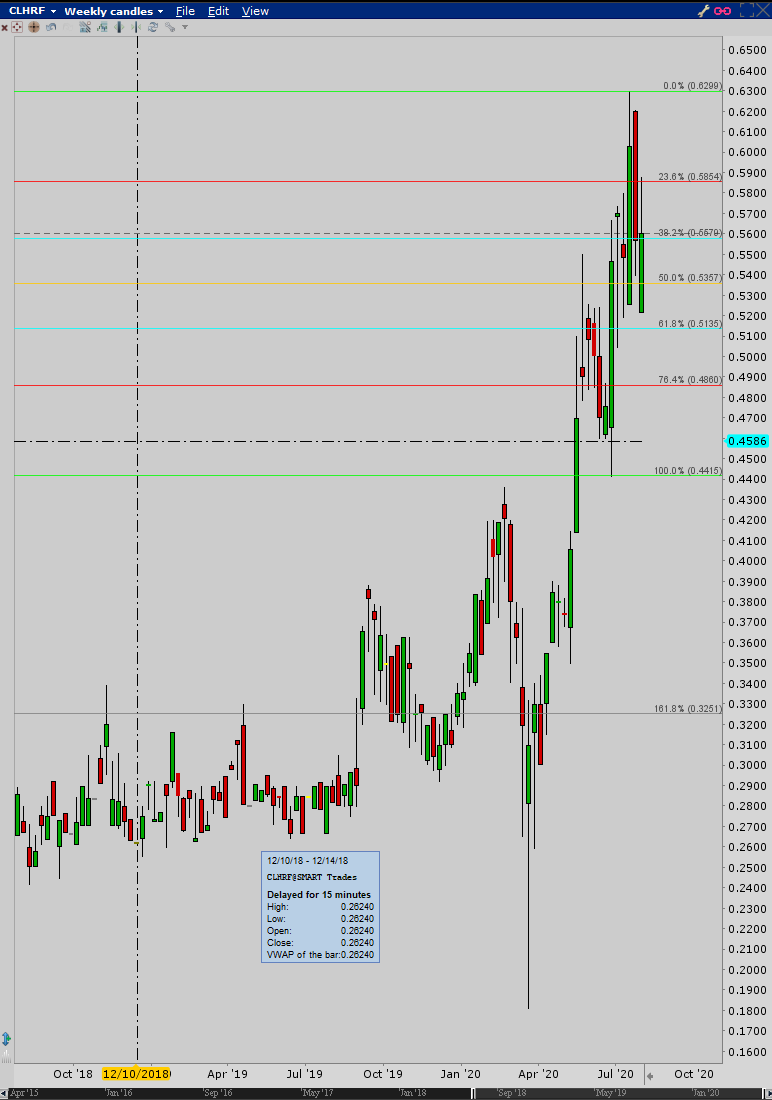
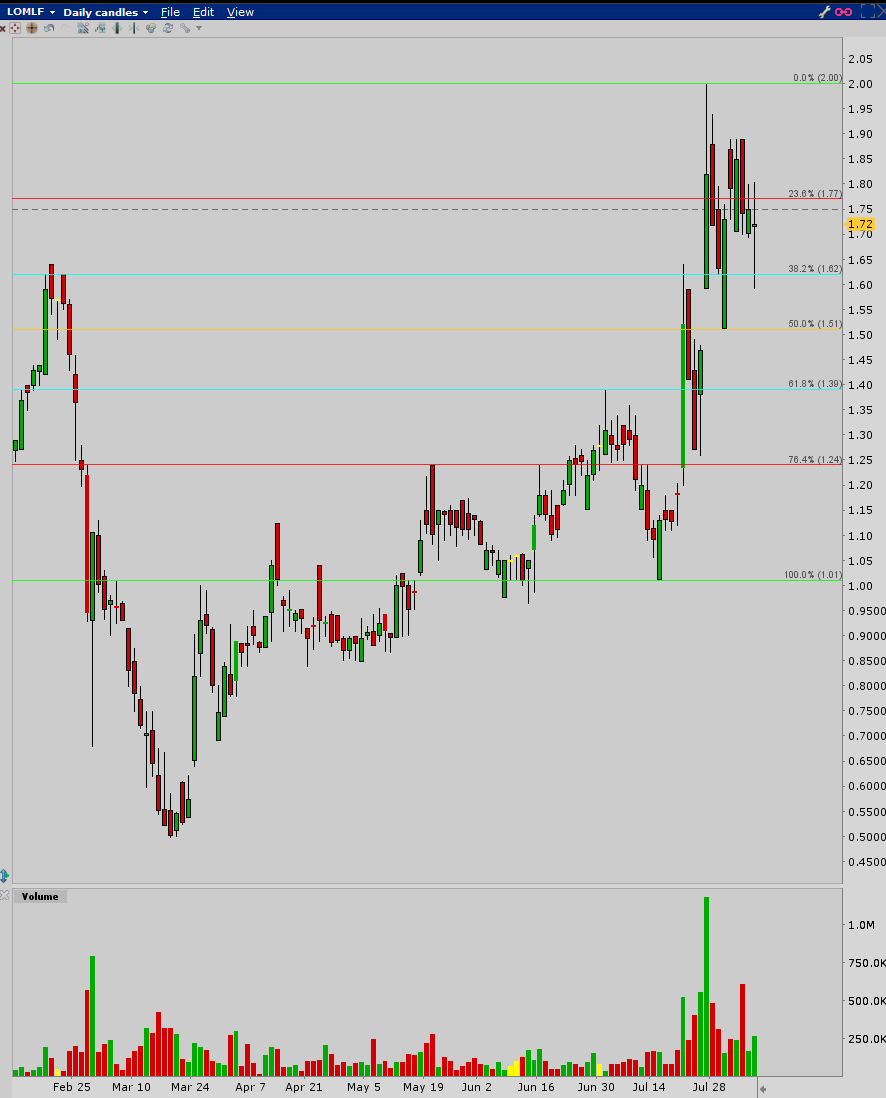
Also, just for fun, I drew two Fib retracement charts. The first one covers the range of the last pullback low to the .63 high and shows a more bullish outlook where the 62% level was just about hit and the stock may possibly consolidate or head higher from here. The second one is a less happy view, unless you’re looking for opportunities to buy shares between .4055 and .3526, give or take a few thousandths of a penny. (For some odd reason I’m enjoying writing and mouthing that word “thousandths” this morning. Probably need more fiber or protein or something). Anyway…
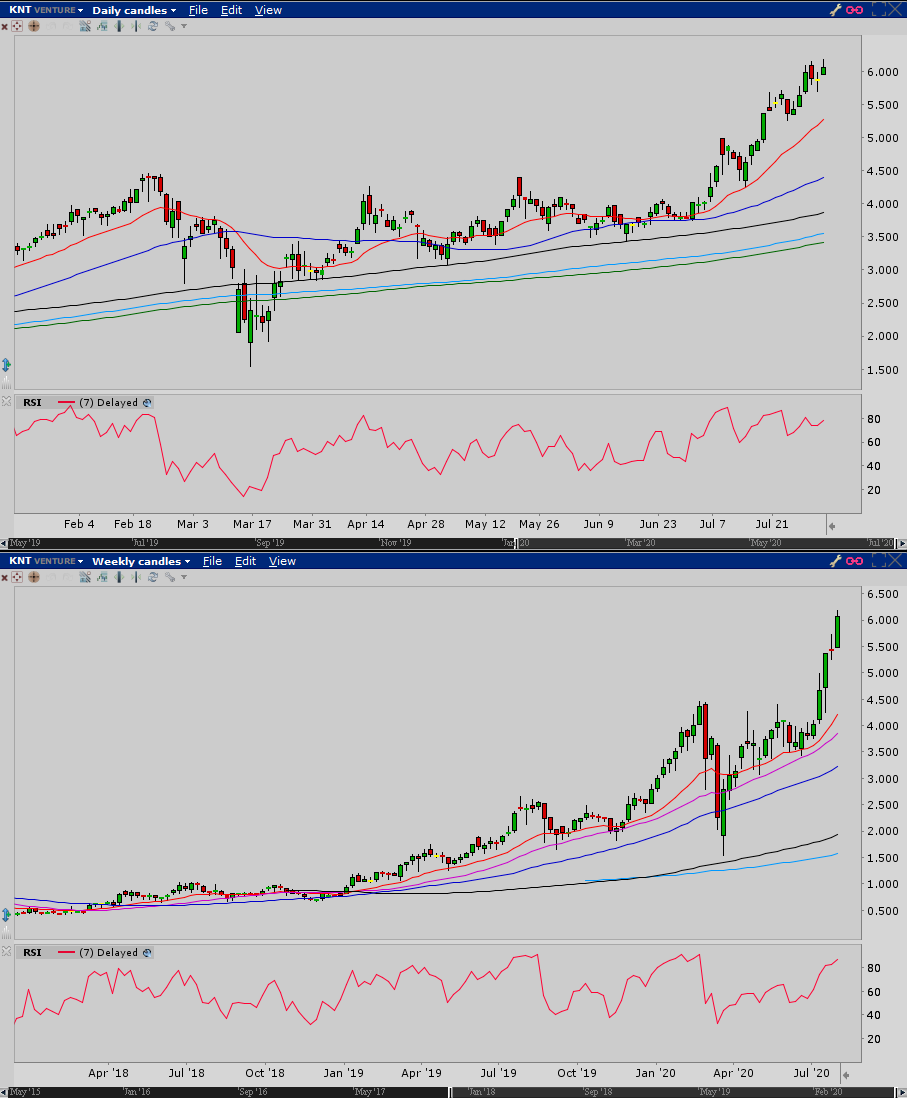
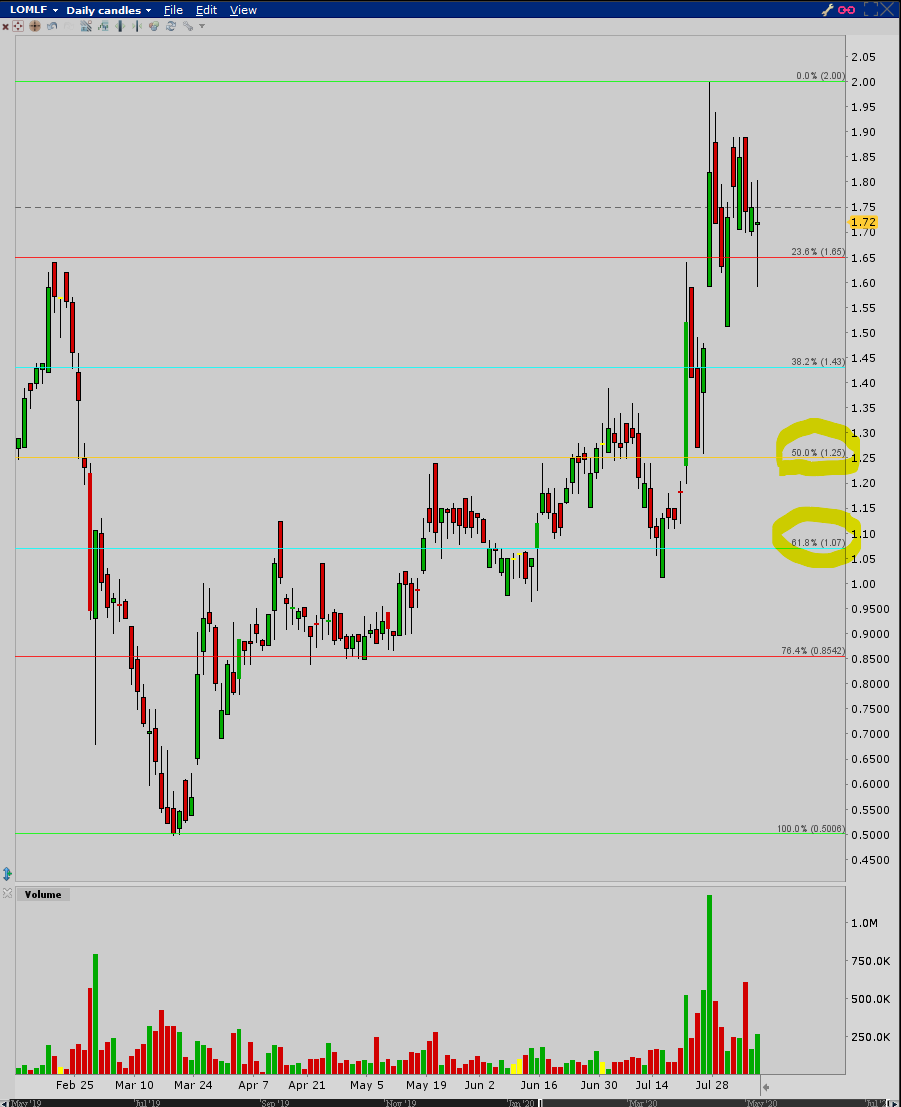
Daily interval is on the top, weekly on the bottom. Like many stocks, the Balonavirus drop and ensuing bounce created the “adam” portion of an adam & eve bottom formation. This stock didn’t break out after the completion of the first “eve”, but instead made a second one and then broke out. I’ll clarify it on the last chart. So far during the breakout the red 20 EMA on the daily chart has been support, and that has been even more the case on the 4 hour interval chart but due to time constraints I’m not posting it. This stock has had a nice run, but RSI on both charts are very much in overbought territory. So when does the pullback come and how far will it go?
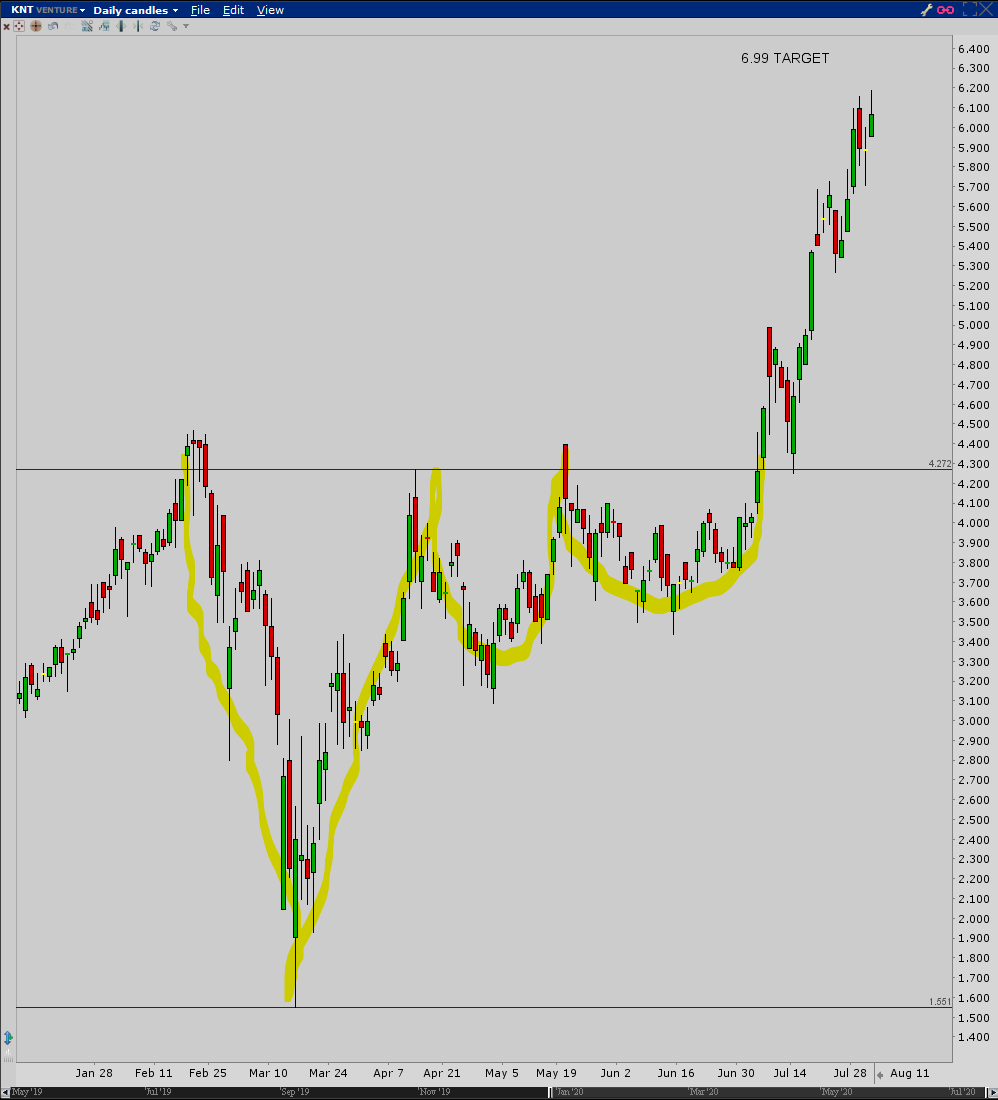
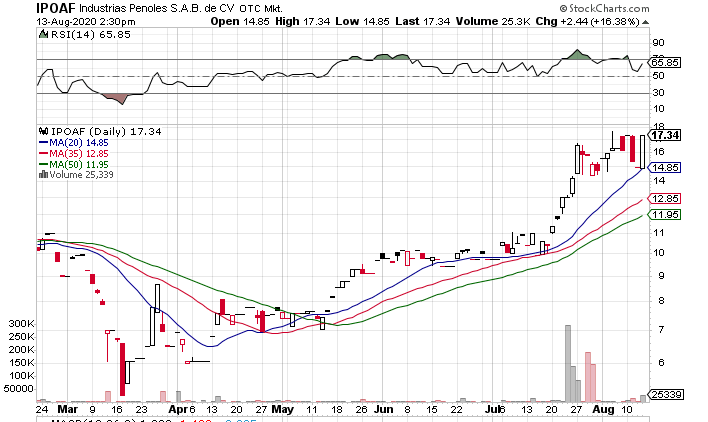
The Adam & Eve & Eve is sloppily highlighted on the daily interval chart below. Both Eves were teases with false breakouts after each had completed its formation. The first went right into making the next, and the second did a false breakout and pullback to close at the breakout point one day, then actually continued the breakout the next day…then pulled back to the breakout point 6 days later and probably shook a lot of longs out before following through and doing what it is supposed to. It currently appears to be making another flag, which could break higher tomorrow or do a slightly deeper pullback before heading to new highs. The target price of this move, IF it plays out fully, is 6.99. If I were long this stock, (I’m not), I would watch it carefully from here on in and make sure I feel confident that it is going to make the complete run to the target price. Sometimes they overshoot and sometimes they sell off before going the distance. Regardless of where it goes from here, when the inevitable deeper retracement ensues, I would first revert to the 4 hour interval chart and watch for support at the 20 EMA, the 50 MA, the 130 and then the 180 MA’s. Along with that, I would run a Fibonacci retracement grid from where ever you end up verifying the high to be to the last major low that occurred on a pullback during the uptrend, which is at 4.25. You should see it clearly on the daily chart as it’s the only pullback that occurred on this run that actually touched the 20 EMA. If the stock is going to new highs after 6.99 or whatever top it hits, you’ll get a pullback to the 50% or 62% retracement and it will probably line up with one of the previously mentioned MA’s. Watch for an RSI reading of 30 or below on the daily chart once that occurs and, as long as this stock is going to continue its uptrend to new highs, a bottom will be made and the uptrend continuation will, well, continue!
I don’t have my other charts open yet, but the RSI is showing obvious bearish divergence here. Watch for a retracement at least to the trend line on this chart, but I’ll post some of my other charts to get a better idea of where it could go, or at least what I would like to see.
The weekly interval is showing bearish divergence on the RSI. Those long wicks on the last two candles so far are saying there is profit taking going on, although the last candle isn’t done until tomorrow eve. There could be a push higher from here that sends the RSI higher and no more divergence, but for now be wary.
Assuming a correction is coming, the 20 EMA was the last MA support on the daily time frame. I wouldn’t pay much attention to the pink 30 MA on this chart, so the blue 50 MA sits below at about 1.30. The 130, 180, and 200 are grouped up tight between 1.15 and 1.05, but there is a chance the price drops a bit lower if a drop does come…
It’s probably difficult to see even with the highlighting, but after 20 years I see formations everywhere. There is an inverted adam & eve top on this 4 hour chart. If it plays out to fruition the target is to $1.01. Doesn’t mean it’s going to happen, but it’s there so I’m sharing it.
Whether the above formation plays out or not, if there is a correction there are two levels of Fib retracement to keep an eye on. The first is from the high to the last major low before the “steeper” price rise. The second is the entire range of the move from the recent high down to the last major low. In both cases, keep an eye on the 50% and 62% retracement levels for signs of a reversal back up.
I haven’t looked at the silver chart since the last time I posted them. I’m glad CHG just posted something about it because that made me go back and look and I noticed a couple things that may indicate where the correction might occur.
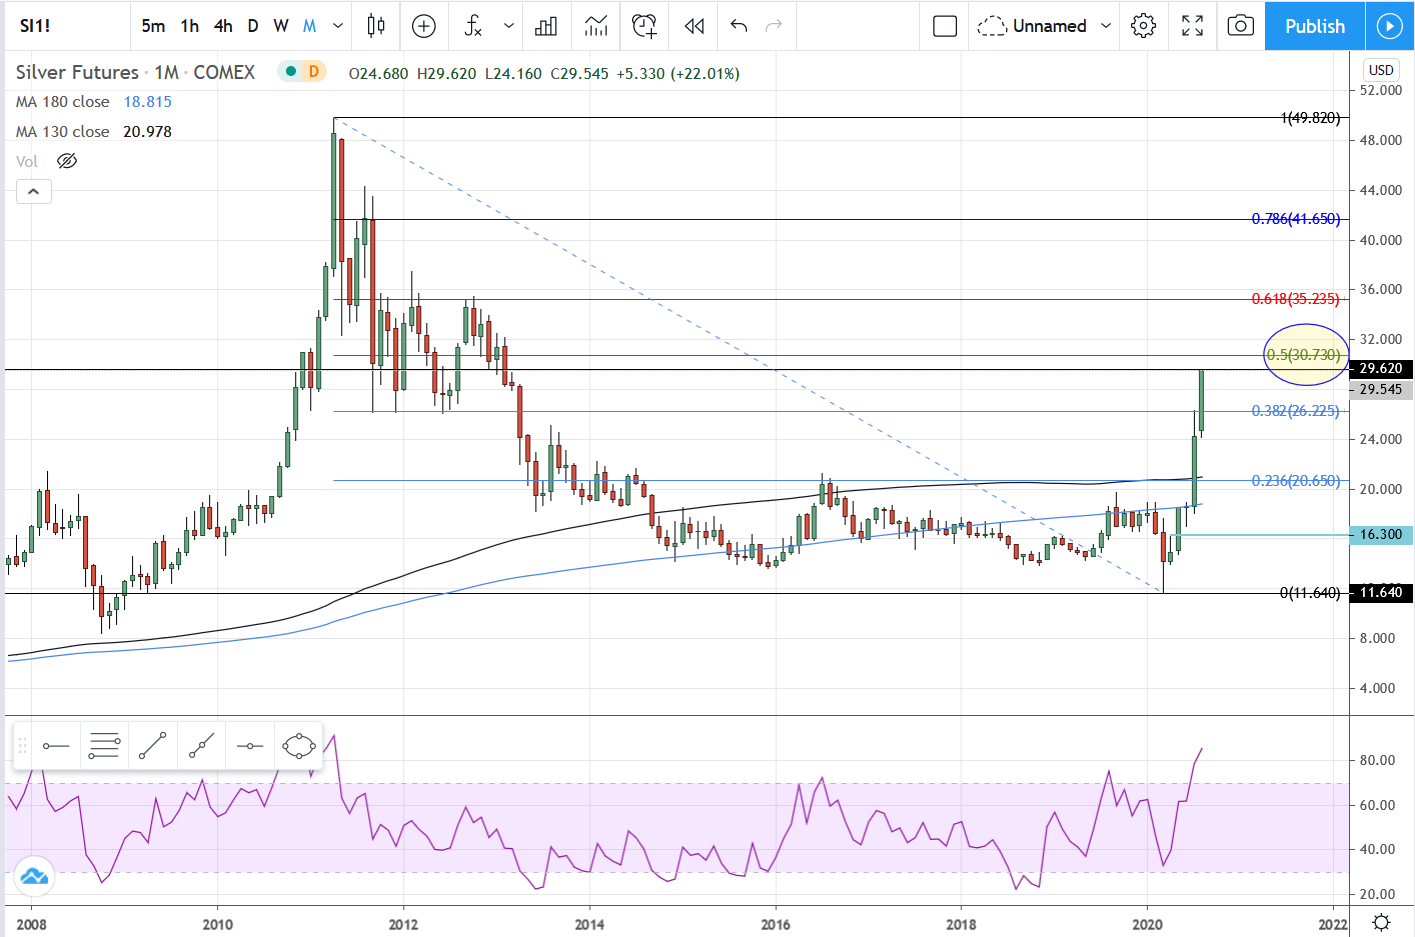
The first chart is the monthly interval which I have posted before. At the time of this post SI has hit a high of 29.62. As you can see on this chart, the 50% retracement of the 49.82 high from 2011 is near, at 30.73.
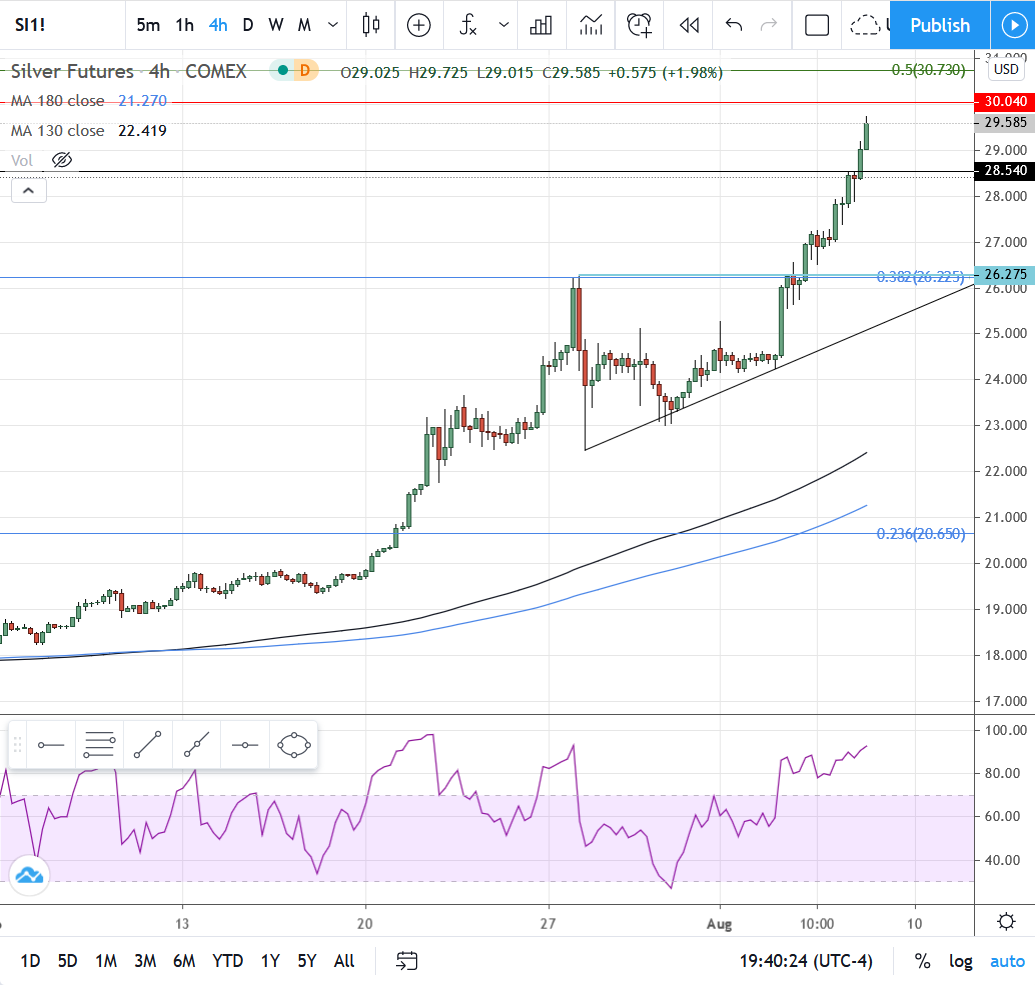
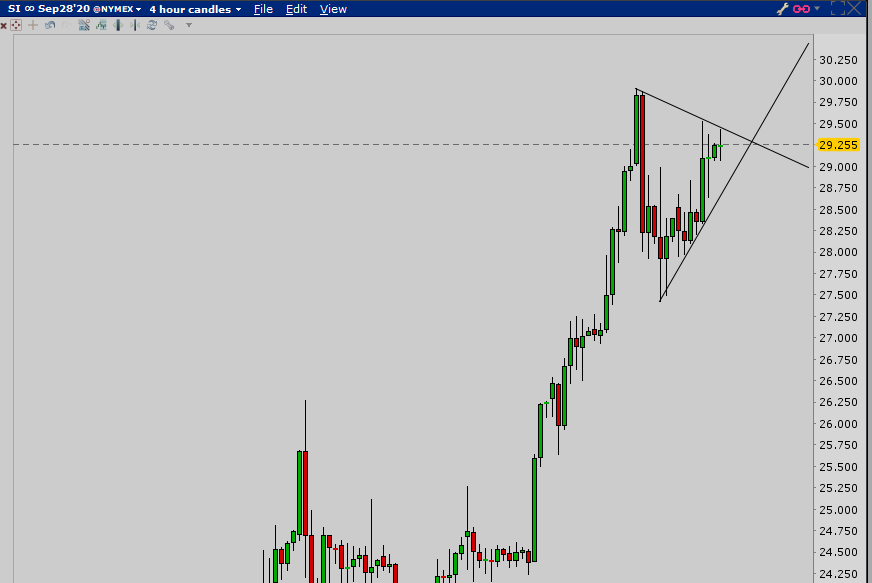
Since that 50% retracement level would be a ridiculously obvious place for a correction to occur, (not that it can’t/won’t happen), I have another place to watch that is less obvious. As it turns out, the consolidation that silver was in since 7/27 made what appears to be a little inverted head and shoulders, but also an ascending triangle. The target price of this triangle is indicated on the chart at $30.04. At the rate silver is climbing tonight, this could be hit soon, so we’ll see if that will be it before a correction or if it’s actually going to shoot for the big 50% retrace.
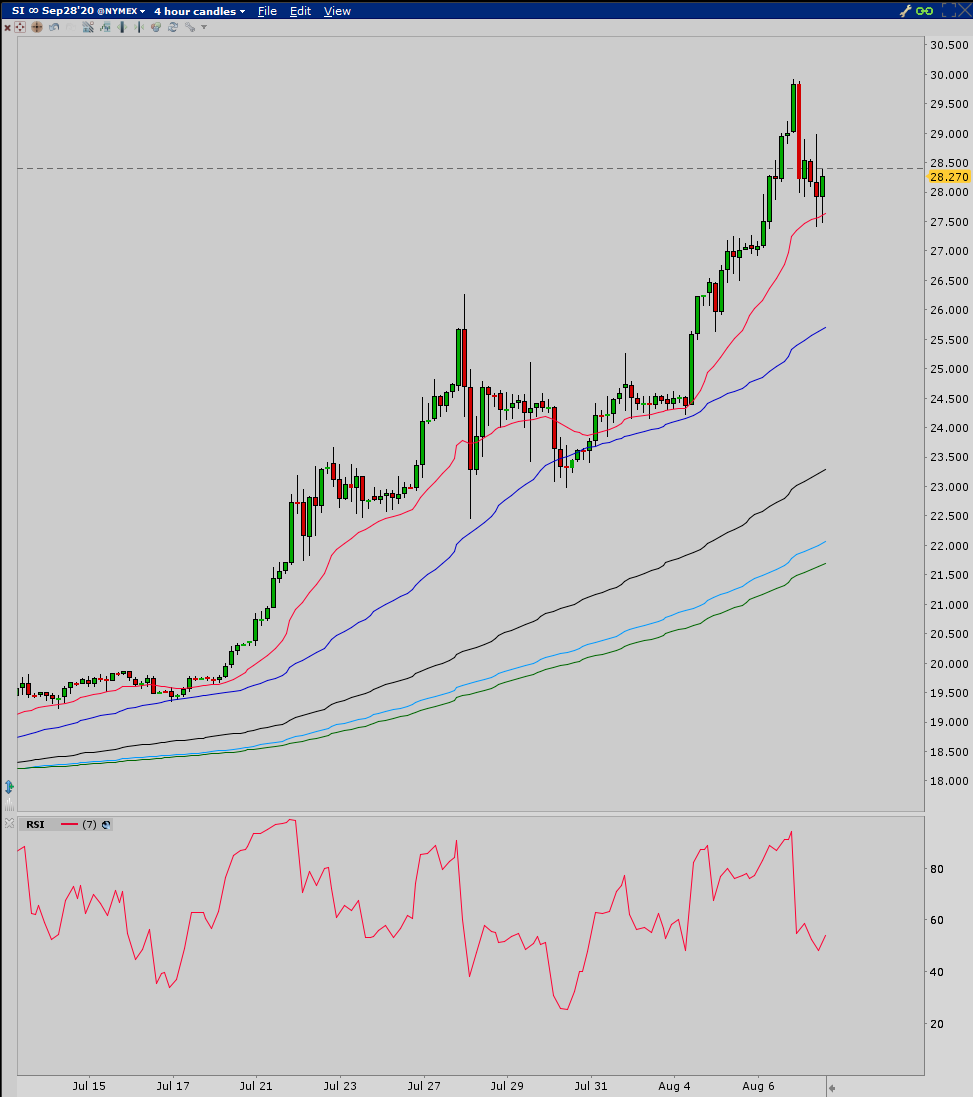
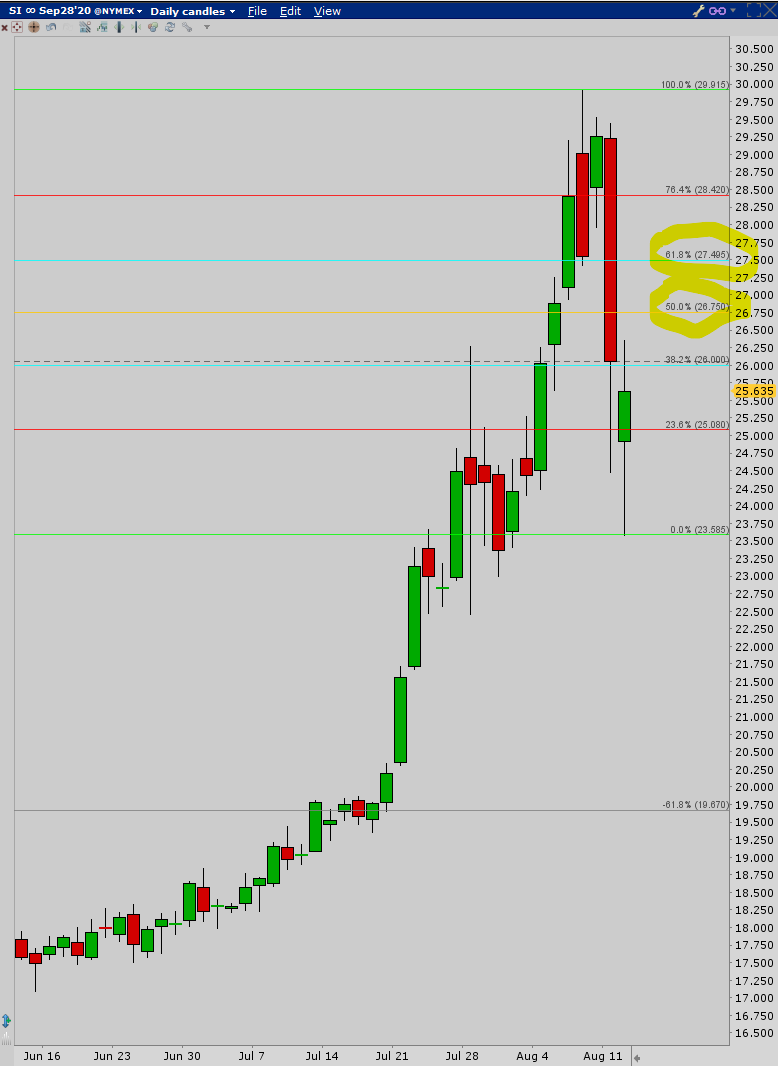
Silver futures came within .125 cents of hitting the target of the ascending triangle discussed on the above post then started its decline. The following chart is a 4 hour interval. Whenever anything is in a strong up or down trend, the red 20 EMA is a very dependable area of support for any pullback. When a little more wiggle room is desired during consolidations or slightly deeper pullbacks, the blue 50 MA is often the backup to the 20 EMA. So far silver has only pulled back to test the 20 EMA and is thus far looking like it wants to make a new high. (Notice the downward sloping channel that formed after the big red candle coming off the highs. I just commented about that in the Other Mining Stocks forum, but I’ll pull it over here and copy it after I post this).
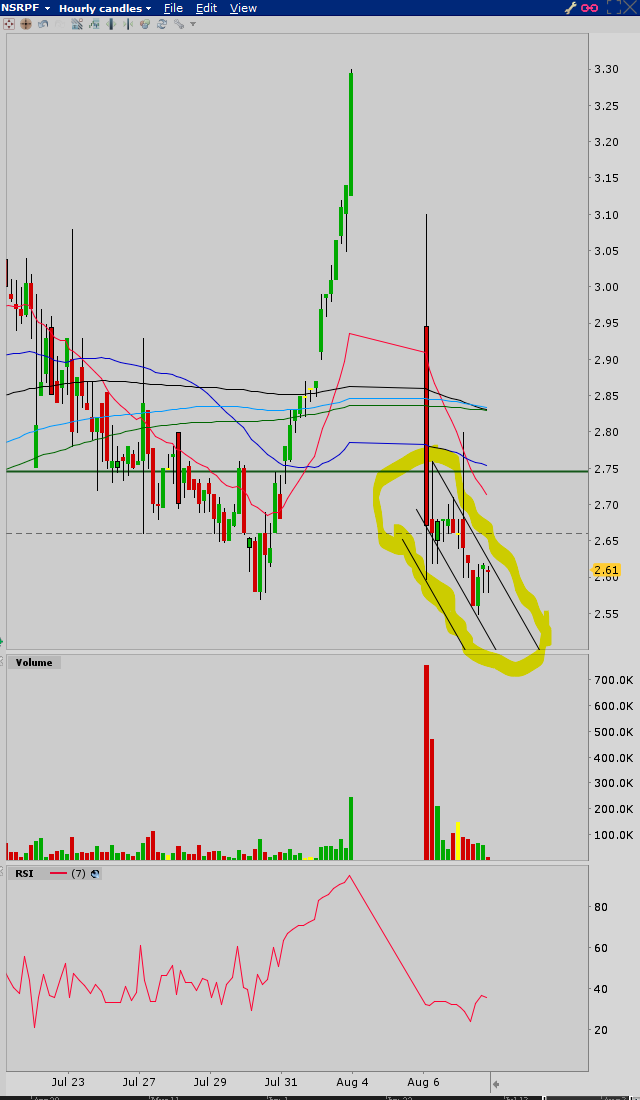
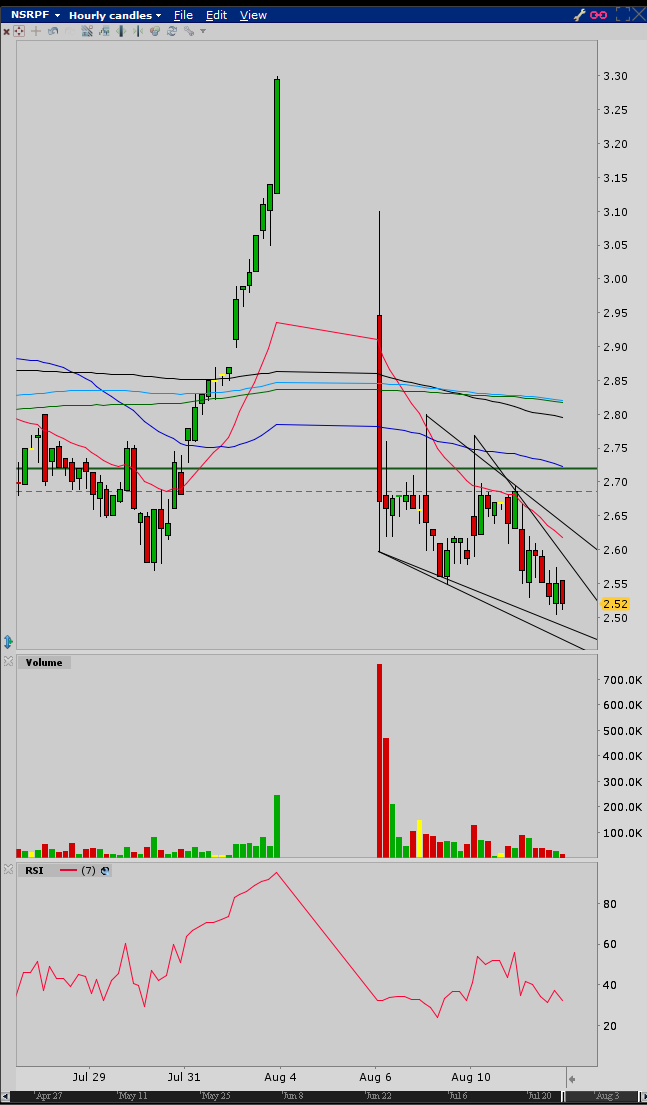
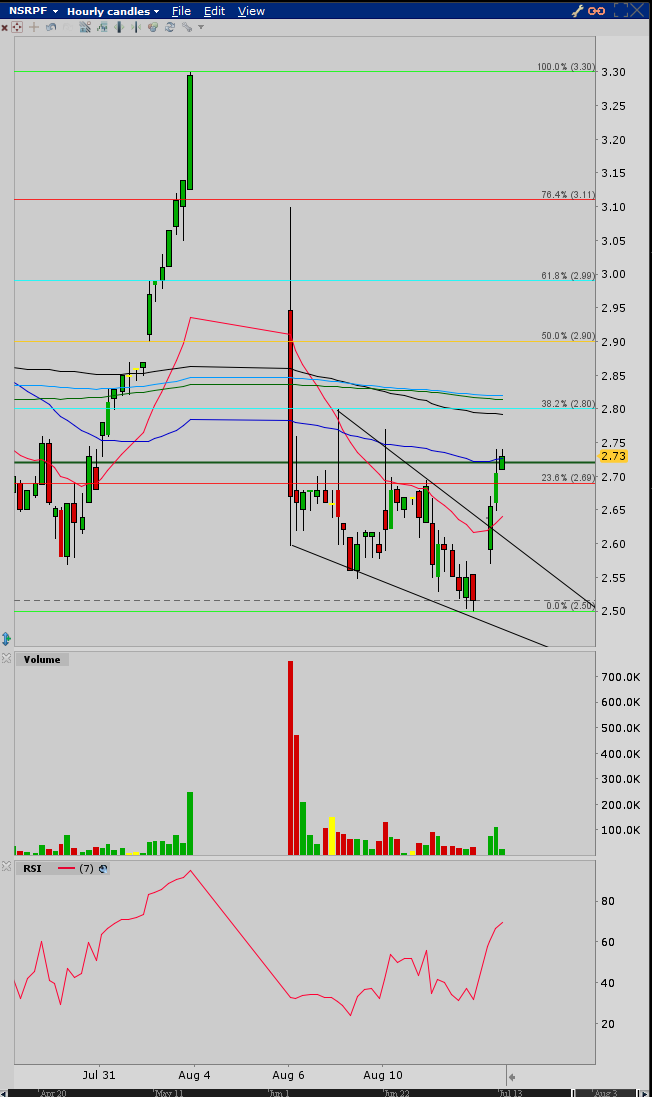
In regards to NSRPF so far, for anyone who uses charts and has some basic understanding of charting lingo, if you look at an hourly interval chart and the trading that has occurred since the end of the halt yesterday, the first candle is a big red one with what looked like a bear flag forming by the end of yesterday’s trading. But, because of today’s trading so far, that bear flag is no longer a bear flag. It’s the beginning of a downward moving channel. Over the past two or so years I have noticed that at the end of trend moves, be they up or down, these channels sometimes form at the end of the trends and they often mark the start of what turns out to be a reversal of the trend. As usual there is no guarantee that’s what this is, but it’s something to pay attention to. If it is one of these end of trend channels we’ll see price break up out of the channel and start what in this case would be a continuation of the uptrend.
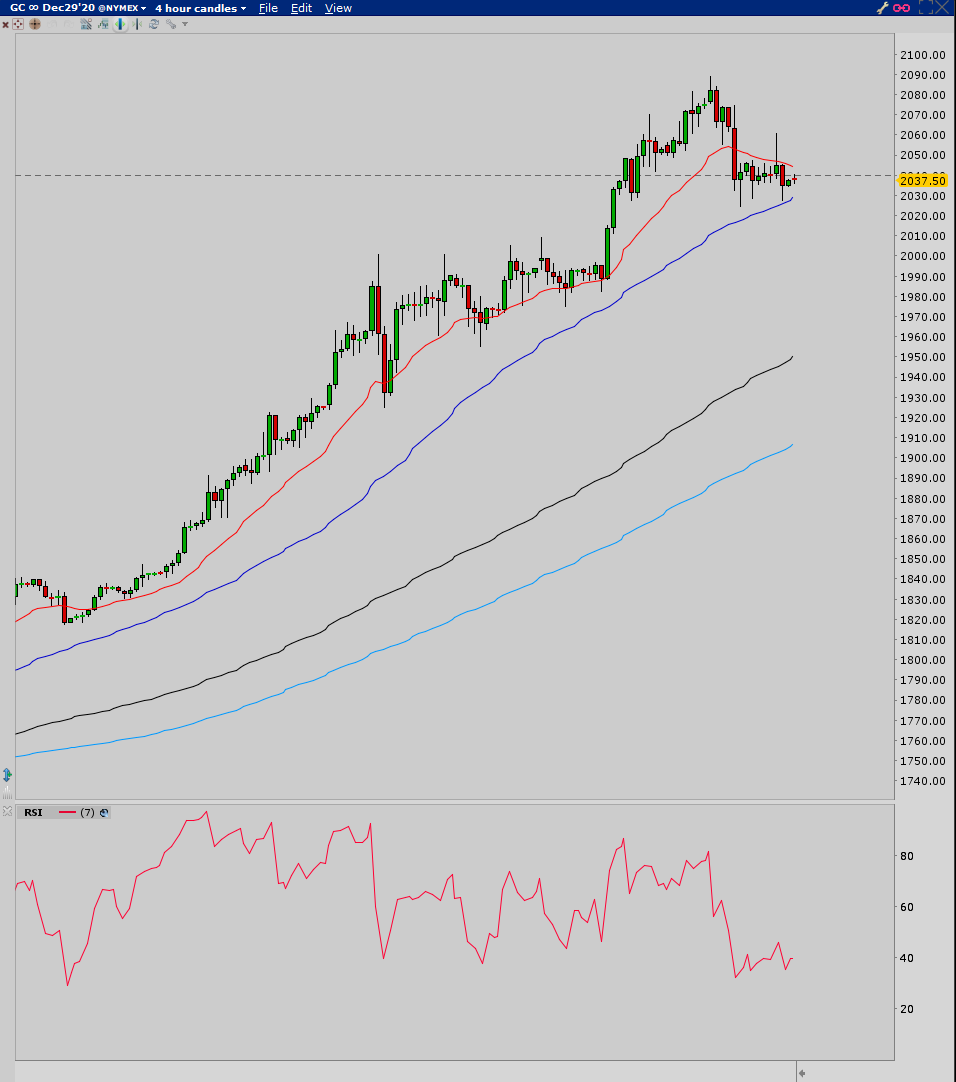
Here’s the 4 hour interval Gold futures chart. It broke down below the 20 EMA and has so far sort of tested the 50 MA, but hasn’t actually touched it, which itself is indicative of the strength of this uptrend. Now we wait to see if gold finds resistance under the 20 EMA or pushes back up through it and continues higher.
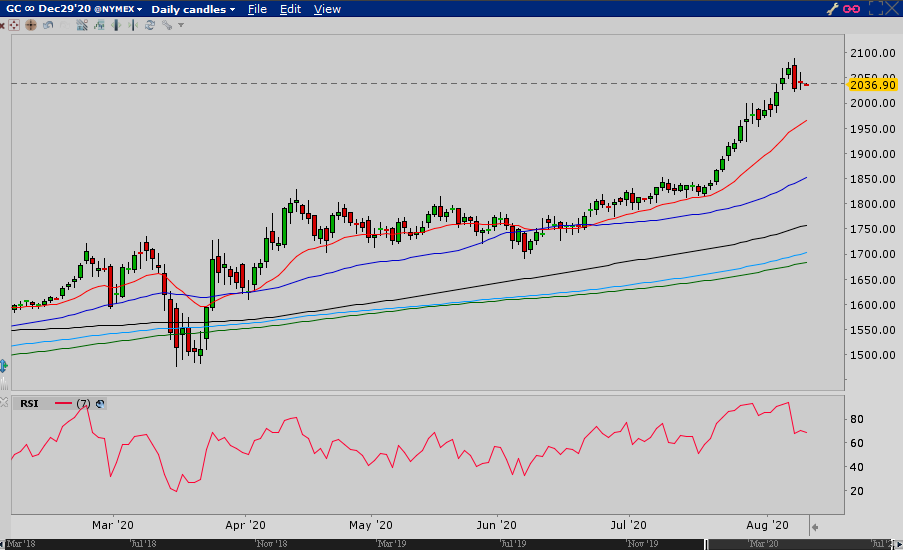
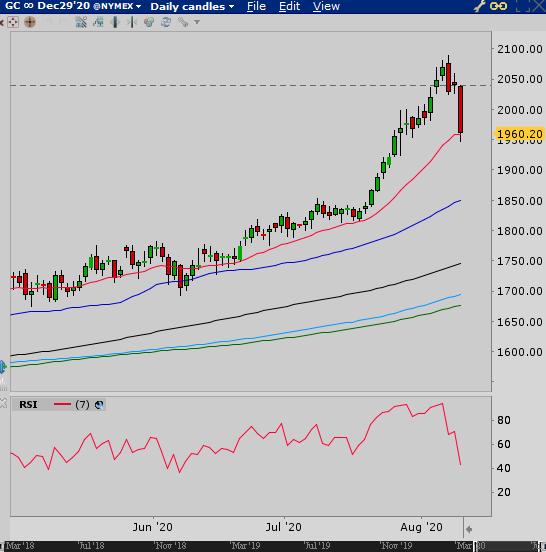
Nothing too exciting or complicated to offer tonight. The first is the daily interval. We had an “inside day” today, meaning trading occurred within the range of the previous day’s (Friday) trading range. The RSI is a tad below 70, so my bias is toward more of a correction before we move higher.
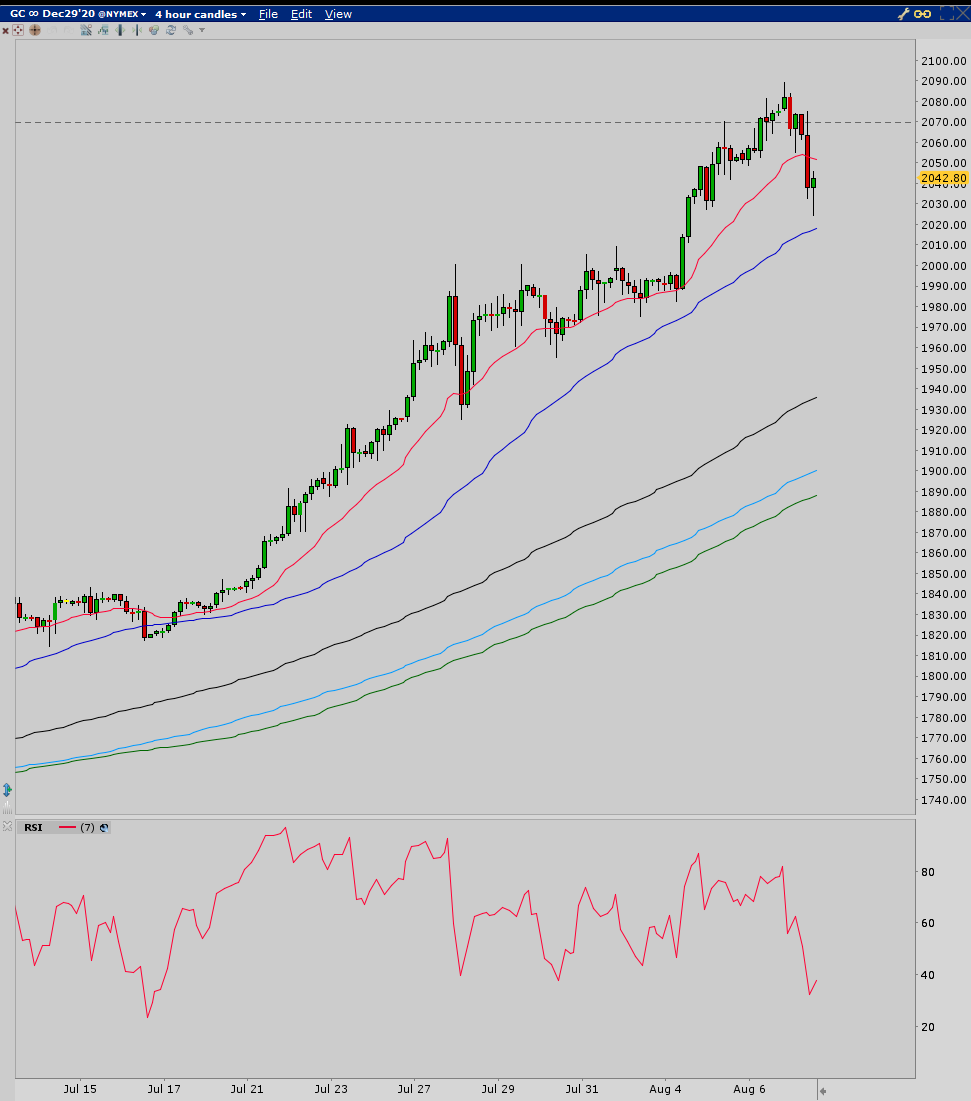
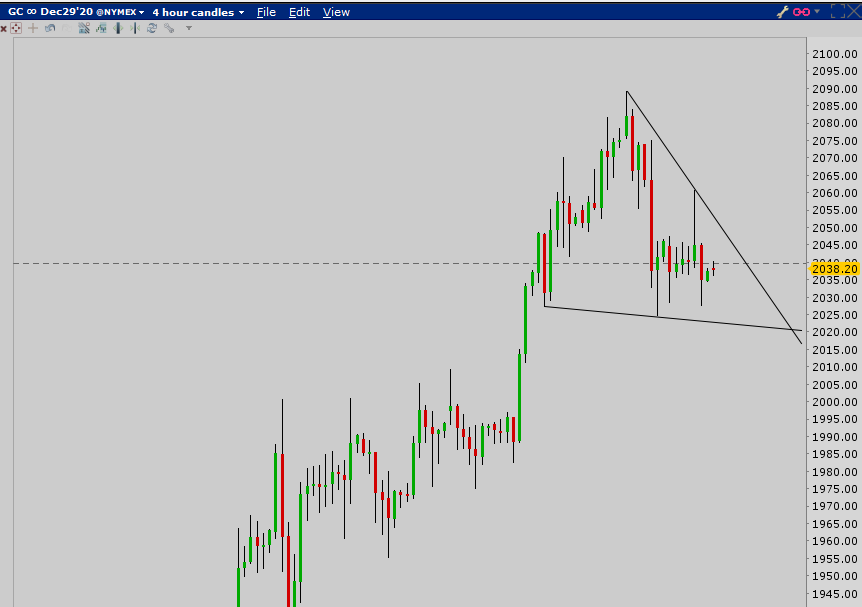
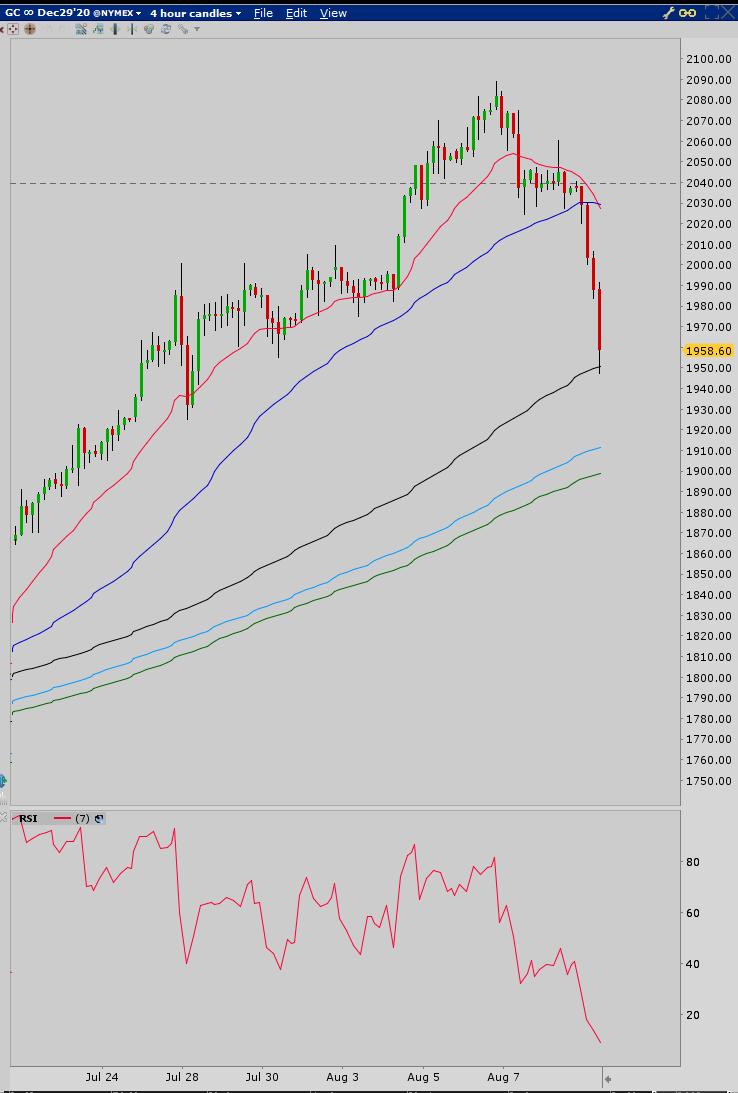
Next is the 4 hour interval chart. We have a drop from the highs that took us under the 20 EMA and almost touching the 50 MA. Since then gold has consolidated in about a $35 range, looking like a bear flag between the 50 MA and the 20 EMA, and it may be a bear flag. But, there is also potentially a falling wedge (bullish), which I’ll post on the chart after this one. Providing the falling wedge is illegitimate, and if the 50 MA loses support, we may be heading below the 2000 level for a test of the 130 MA (black), currently at about 1953 but rising pretty rapidly. Too soon to tell right now though, and there are other support areas to hit before this 130 MA.
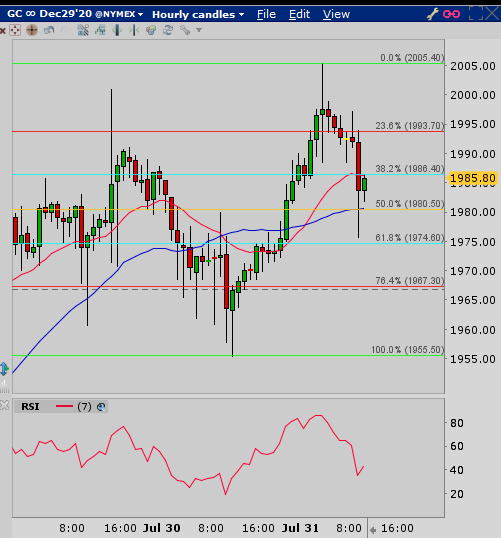
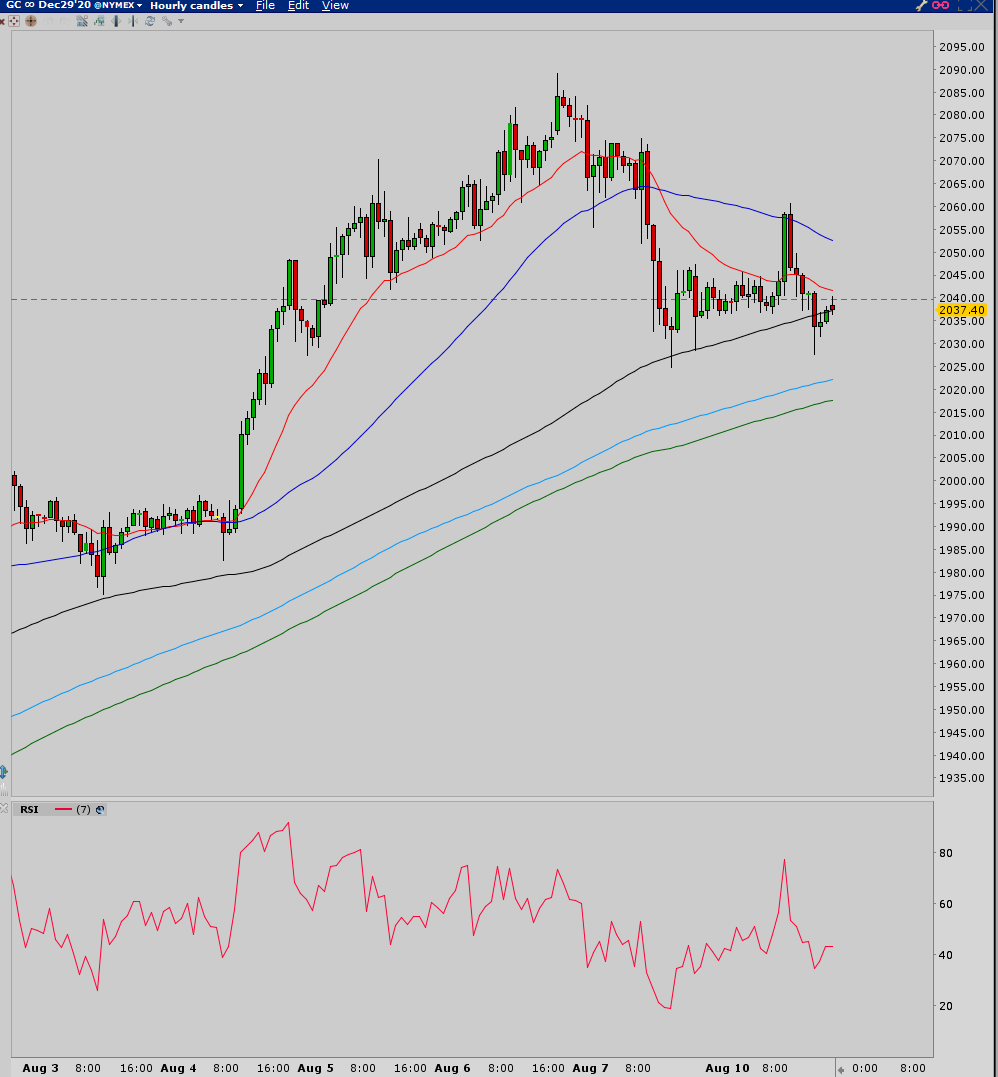
The hourly interval gets a little more interesting. First, starting from the left at each new high hit, check out the RSI reading corresponding to the high. There are 4 new highs hit with RSI divergence on each of them. Usually the third time is the charm, but this time it was the fourth. You can make money shorting each of those highs when you see the RSI divergence, but keep an eye on the 20 EMA. That will be your exit point until you at least have a candle close below it, but even then you have to watch for fake-outs. Once gold hit that final high, you finally got a long red candle that closed below the 20 EMA and then a bear flag forming on the 50 MA. The hour before the breakdown below the 50 MA was at first a bear trap, recovering a decline to new lows and closing not only above the 50 MA, but the 20 EMA as well. Then comes the bull trap, taking out hopeful longs on a big red reversal candle and a continuation lower for the next three hours. They managed to piss off everyone in those few hours. So the flush goes down to the 130 MA and consolidates, looking like a bear flag. Instead of dropping it goes up and tests the 50 MA and then loses that entire move in the next 2 hours. Today the break below the 130 MA occurred and a small bear flag has formed. The very last candle managed to close above the 130 MA, so the way traders are likely getting jerked around lately, that little bear flag will probably break higher. I’m glad I’m not trading on this time frame! Anyhow, now we wait to see if the little bear flag is a fakeout or if gold is going to break through the rest of the MA support on this chart and test the lower levels on the bigger charts. My hunch is gold will eventually correct more deeply, and probably jerk a lot of traders around while going there.
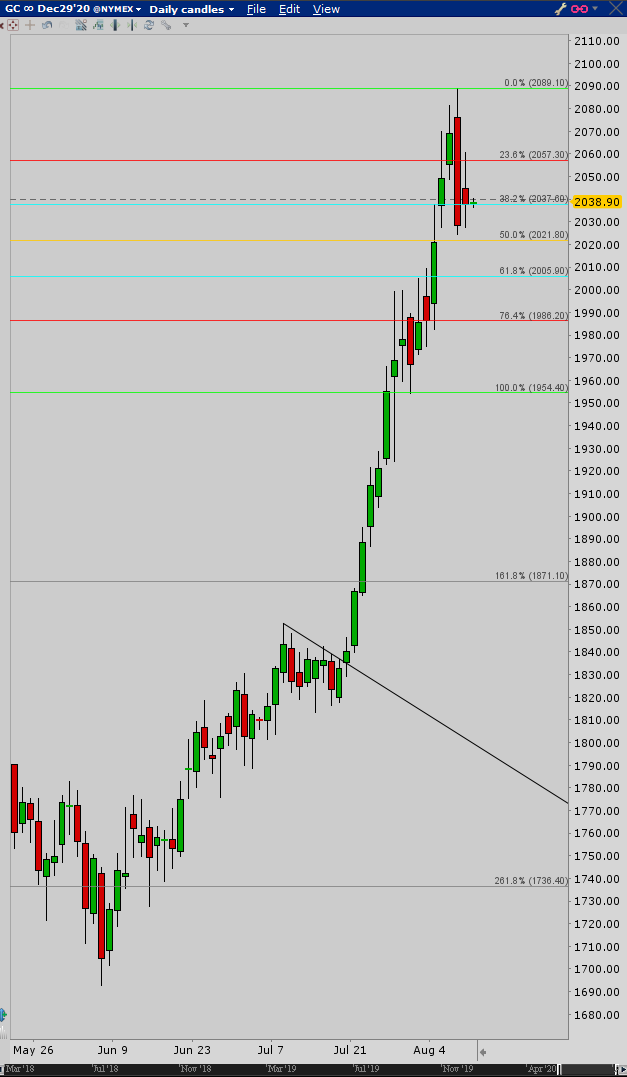
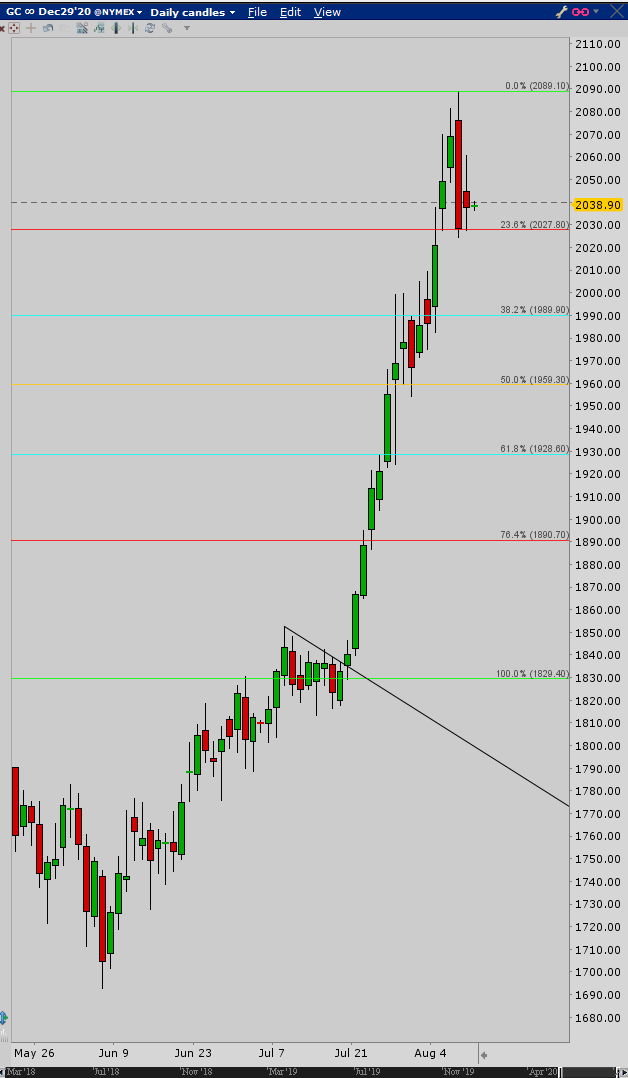
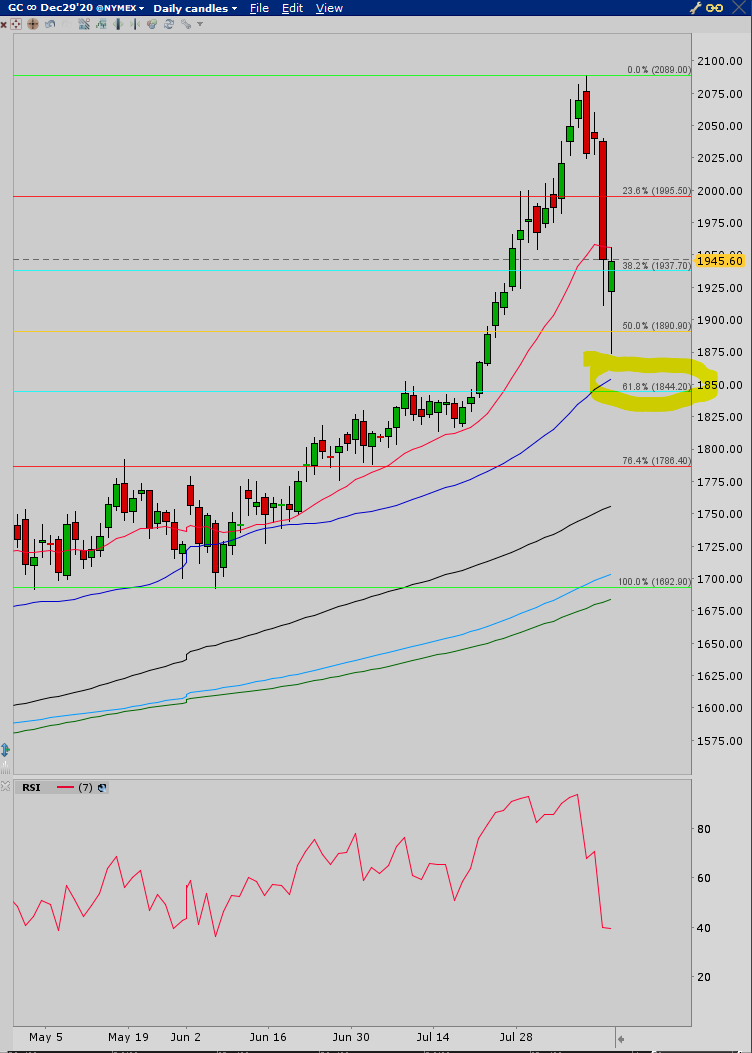
The next two charts are Fibonacci retracement levels to watch for support. The first one covers the range from the recent high to the last major low which occurred during a consolidation before hitting the recent high. The second Fib grid covers the range from the recent high down to where the breakout occurred after gold hit the target of an inverted head & shoulders bottom and consolidated in the form of a bull flag. As usual, keep an eye on the 50 and 62% retracment levels for support areas on each chart. It’s likely the correction will bottom at one of those 4 areas, imo.
On the daily interval, (as well as the weekly), silver is technically overbought, but I don’t think silver cares about the RSI reading right now. It’s in a symmetrical triangle just under $30. A breakout higher should have it hitting around 31.90, which will likely be too close to $32 to not hit it.
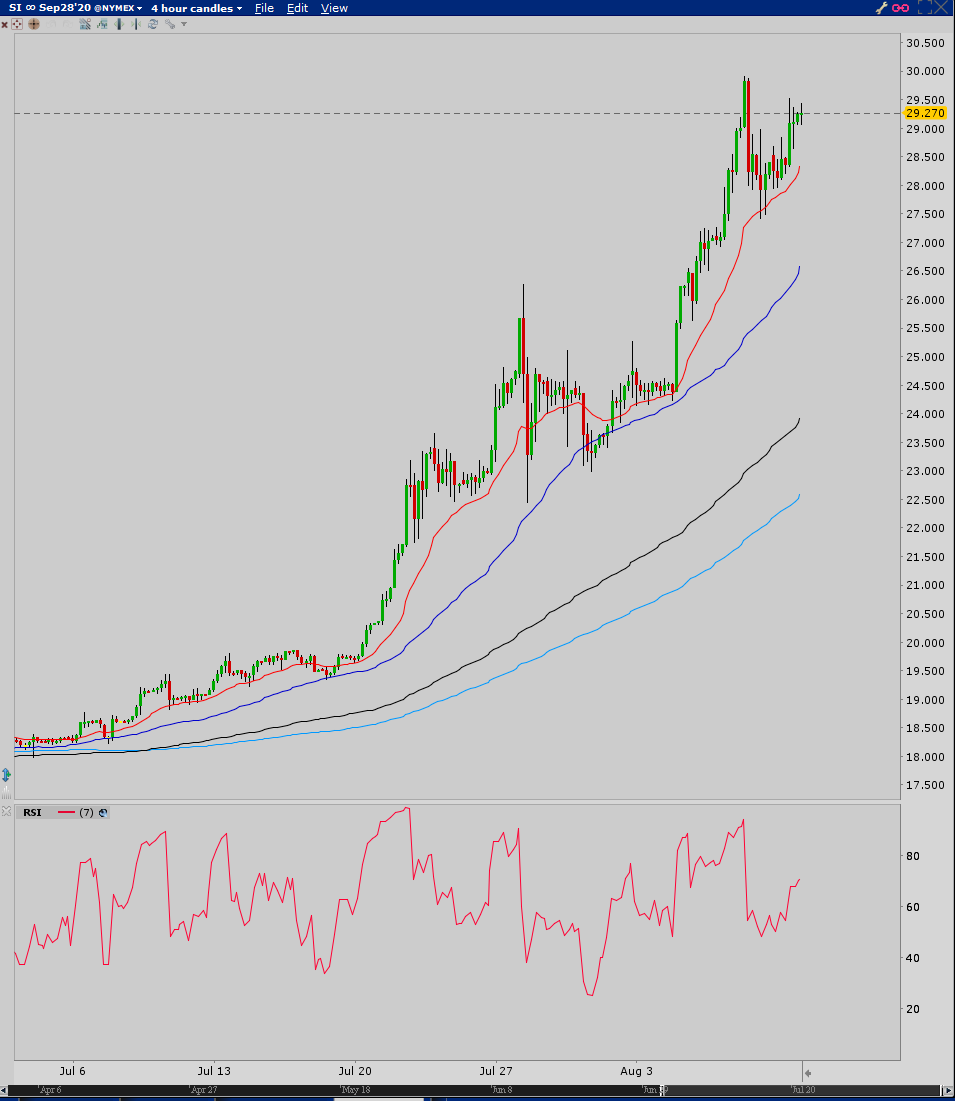
On the 4 hour interval chart you can see how strong silver’s rise has been. Longs had a little scare for a while between $23 and $23.75, but other than that the 20 EMA and 50 MA have held like champs since the rise began accelerating around $18.50. At this time it looks to me like silver is likely to see $32 before a deeper correction begins.
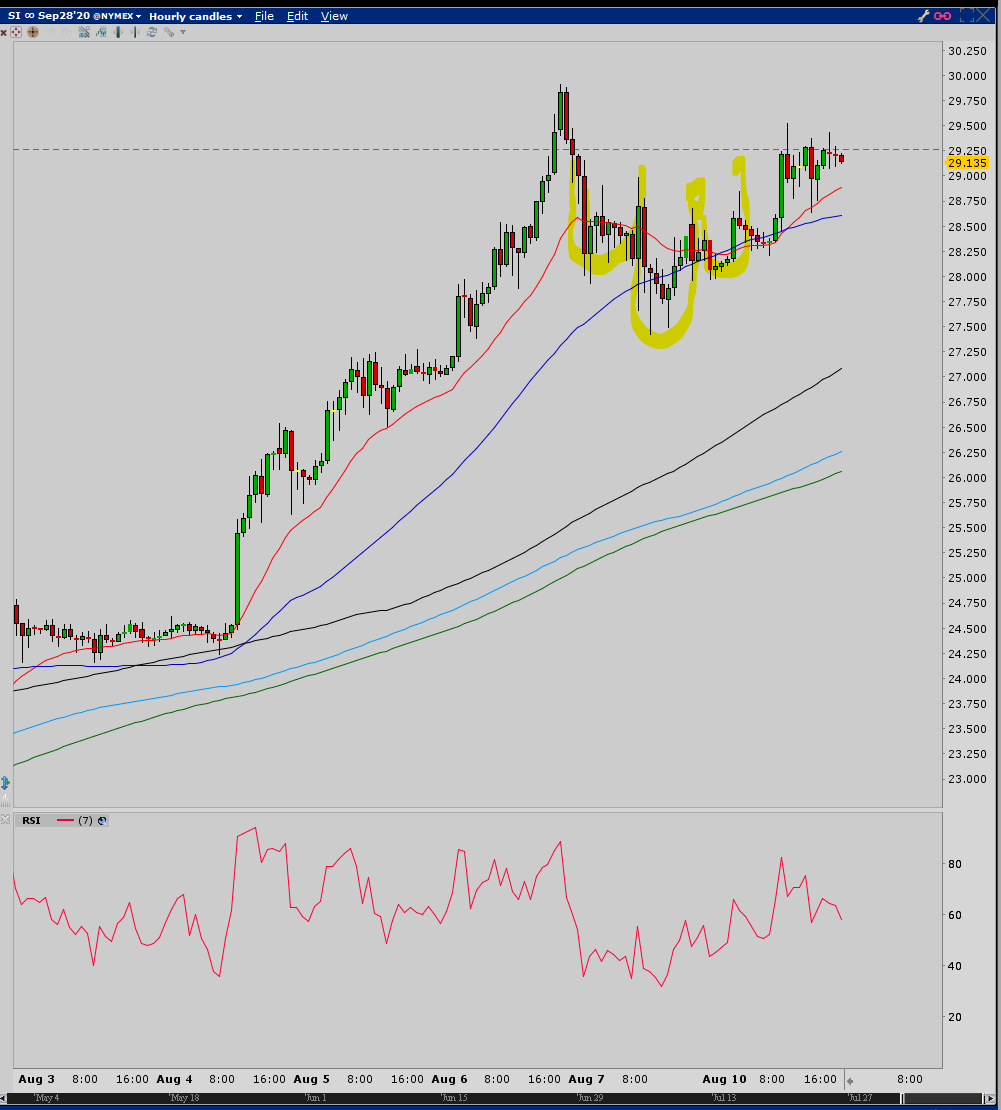
The hourly interval looks a lot like the 4 hour chart, but the MA’s don’t work as nicely as support on dips. I highlighted an inverted head and shoulders bottom that formed after the drop from the highs. Now it appears to be consolidating in a sloppy flag before breaking to new highs.
So, either that’s the end of the correction or the next stop is to around 1920, and if that isn’t it then around 1860 (50 MA on the daily chart). We’ll have to see what develops from here.
An observation on the NSRPF hourly interval chart. I mentioned before that, since the resumption of trading from the halt, the stock has been forming a descending/falling wedge, which is usually bullish. It could still go a little lower than today’s lows, but the way this is forming I’m expecting a nice break higher when it is ready. The breakout could happen any time but, depending on which of the lines I drew proves to be more accurate, it could still be a few days or even into next week. Beware false breakdowns, which I would call a buying opportunity, before reversing and breaking higher. I should also offer that the whole thing could morph into something other than a wedge over time or turn into nothing but a consolidation. I’ll update as needed.
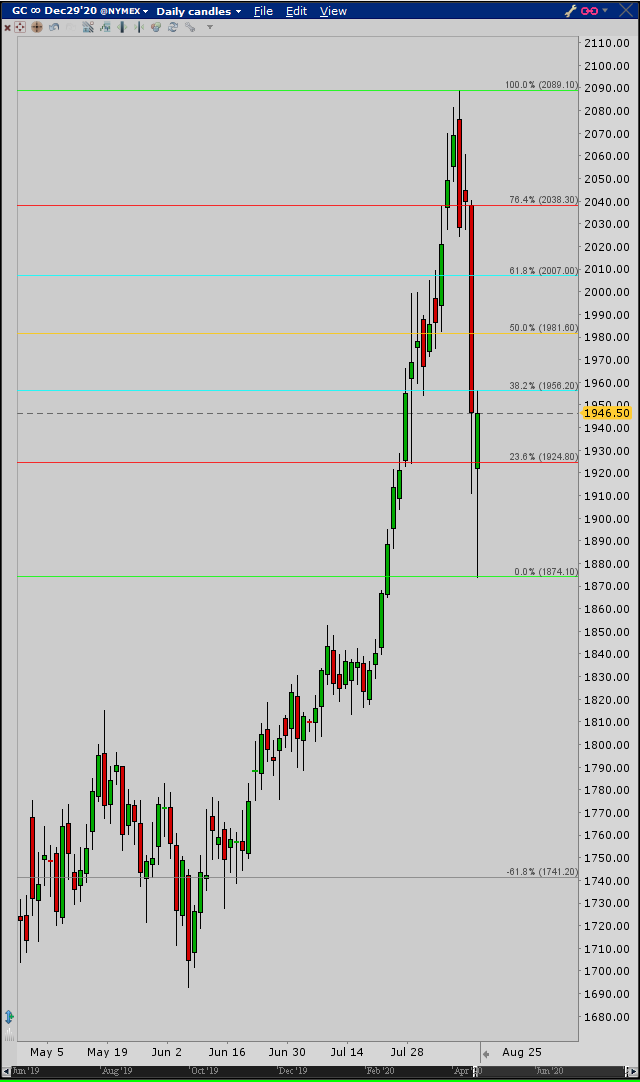
The second to last candle, the big red one, is yesterday’s trading. Gold dumped almost 50% of its rise from the last major low of 1692.80 in early June. When today’s trading began last night it continued lower to about half way between the 50 and 62% retracement levels. The bounce occurred about $20 off from the 50 MA. RSI is now a tad below 40. I don’t know if more selling pressure will come back to take us to the 62% level or not. So far resistance on the bounce has occurred at the 20EMA.
If gold continues higher and breaks through the 20EMA on the previous chart, the Fib levels on this chart will likely be areas of resistance, especially the 50 and 62% levels.
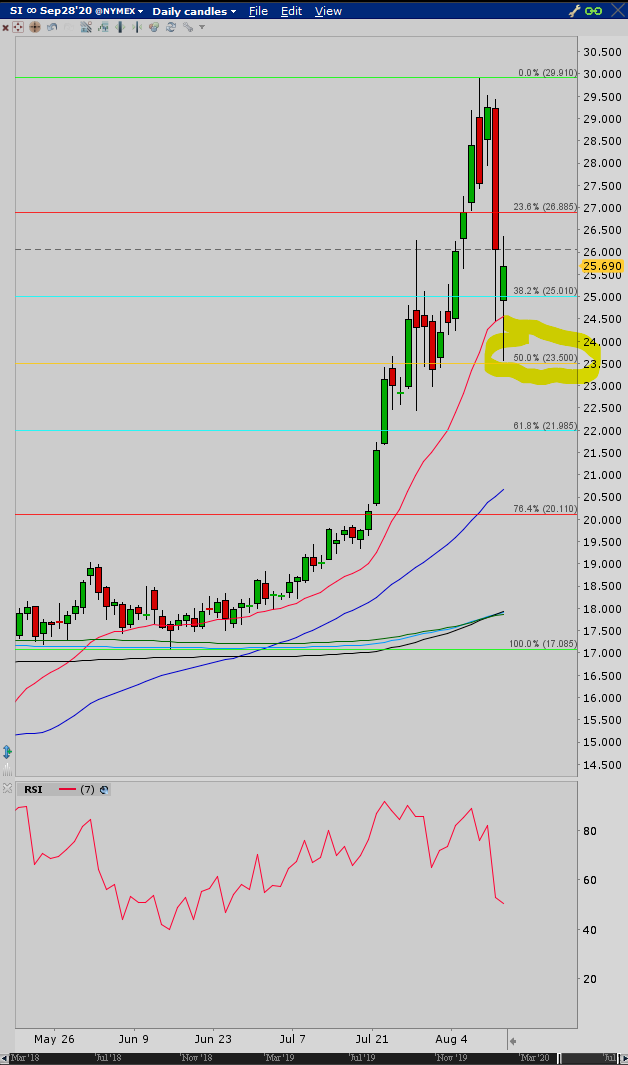
Silver futures completed a 50% retracement of its last major low at about 17.09 in mid-June. Instead of the 20EMA being resistance on the bounce, it was the stopping point for yesterday’s candle and, although last night’s trading took silver below the 20 EMA on the way to hitting the 50% retrace, it has had a nice bounce so that the candle body is well above that MA, which means that thus far silver is still in a strong uptrend, stronger than gold. There is still room for a push lower. Watch the 62% retracement level as the next area of support if that happens.
The breakout of the aforementioned descending/bullish wedge is in progress. As for a target watch the MA’s and the Fib retracement levels. The 130 ma is just above at 2.78. Then the two main Fib retracements at 2.90 and 2.99. We’ll see if it gets that far and update later.
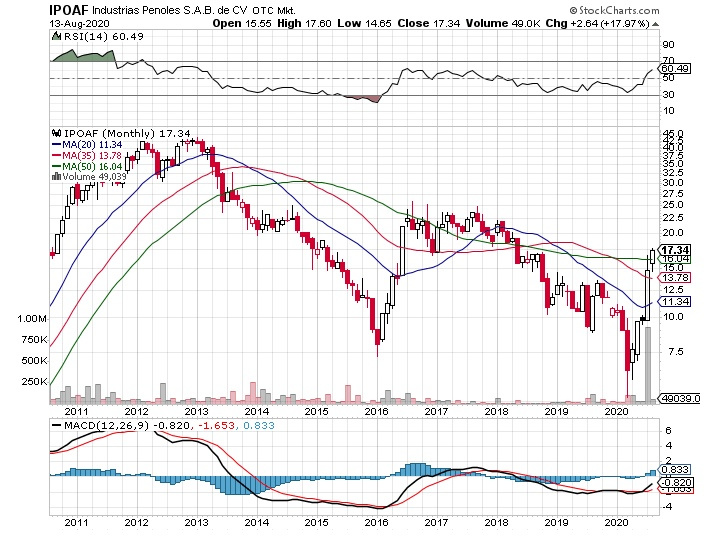
Not one I had on my initial list, but it’s starting to look interesting. I have a small position in this one, it had a recent upsurge in volume, but looks like it may be ready to retrace or consolidate in case anyone is interested. Long-term chart looks as though it may be ready for a break out.
I looked at the chart Richard. Have fun! Yes, I could chart it and trade it, but with all the other options out there why? If I wanted the headache that trading this would bring I’d put a million $$$ back in my trading account and go back to oil futures. Only difference is at least oil futures have liquidity and no spread.
Actually not trading major cores (may pick up more on major pull backs), and IPOAF looks to be behaving a lot like HL, but has a small OS. Keeping most of my speculative minor holdings until after some drill results come in from the current exploration/drilling season. I’ll have to decide which ones to keep as possible take over targets. Many options to play and most are responding well to the increasing POG and silver.