Here’s a quick gold update. These are all daily interval charts…
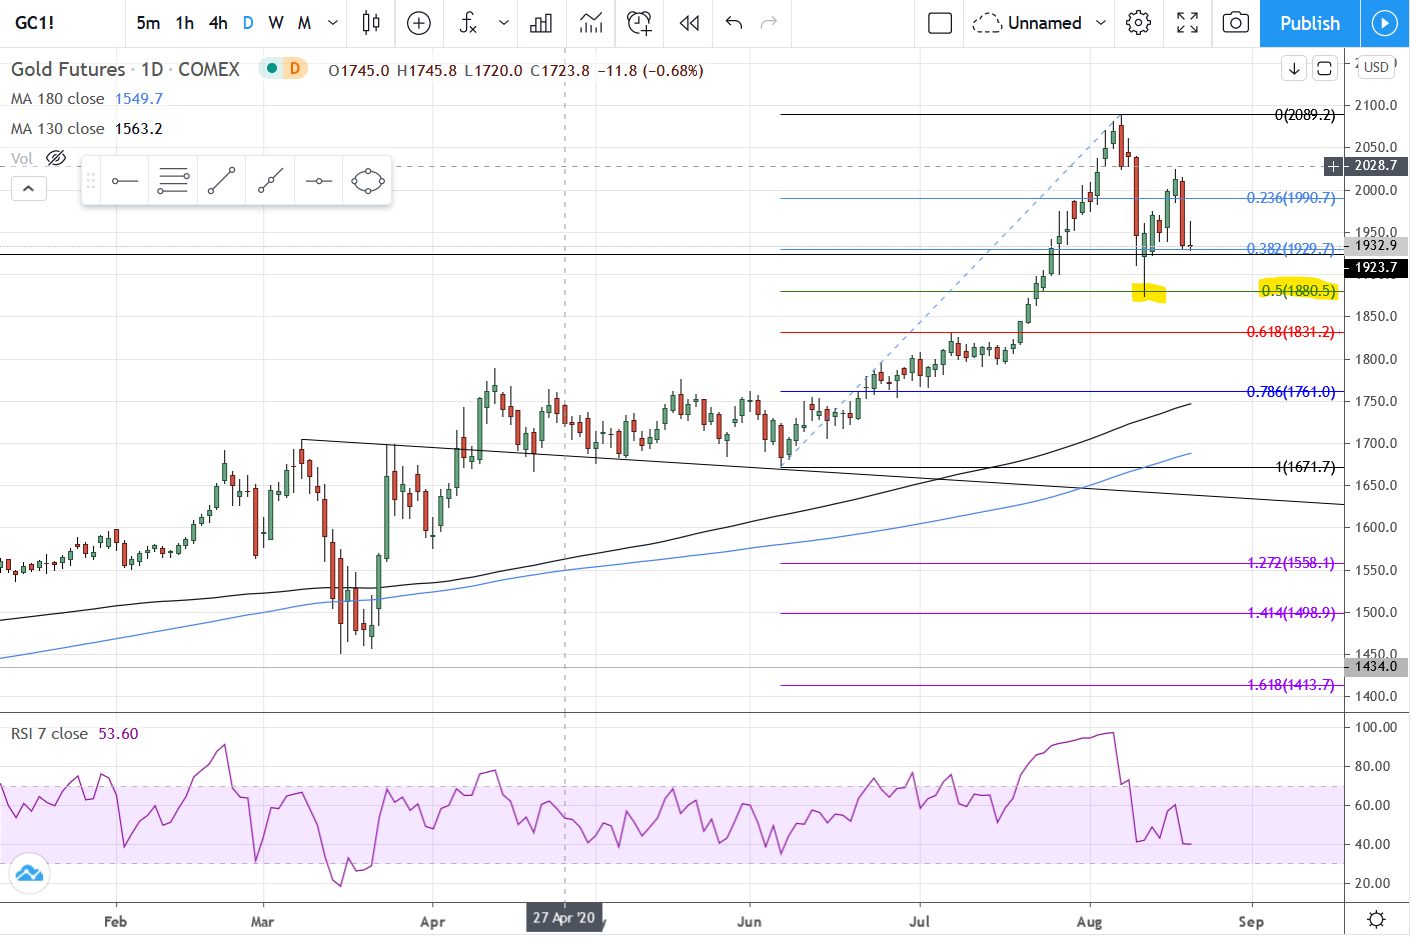
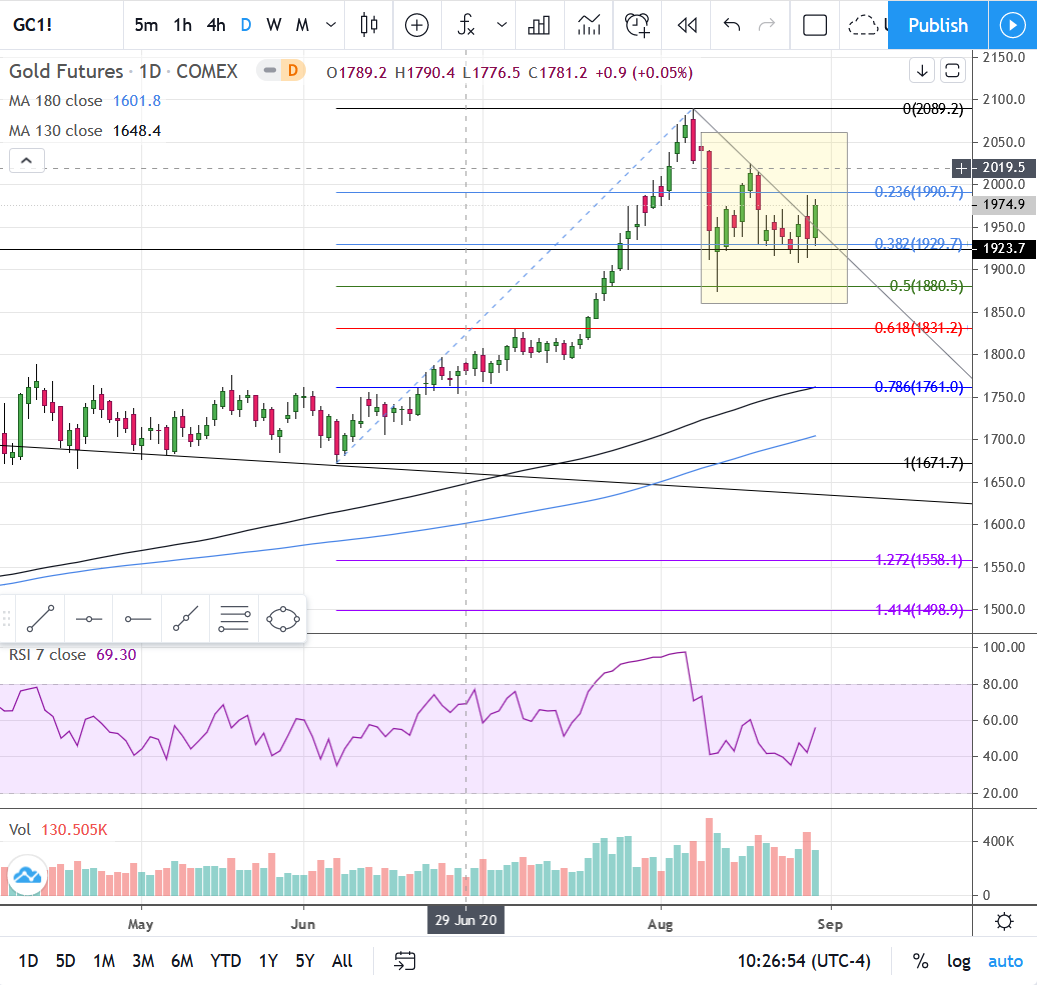
First up, I highlighted the bottom of the initial drop showing a 50% retracement to the last major low that occurred before gold broke out of the 3 month consolidation between around 1660 - 1760. From there gold bounced and looked as though it was heading back to the highs…
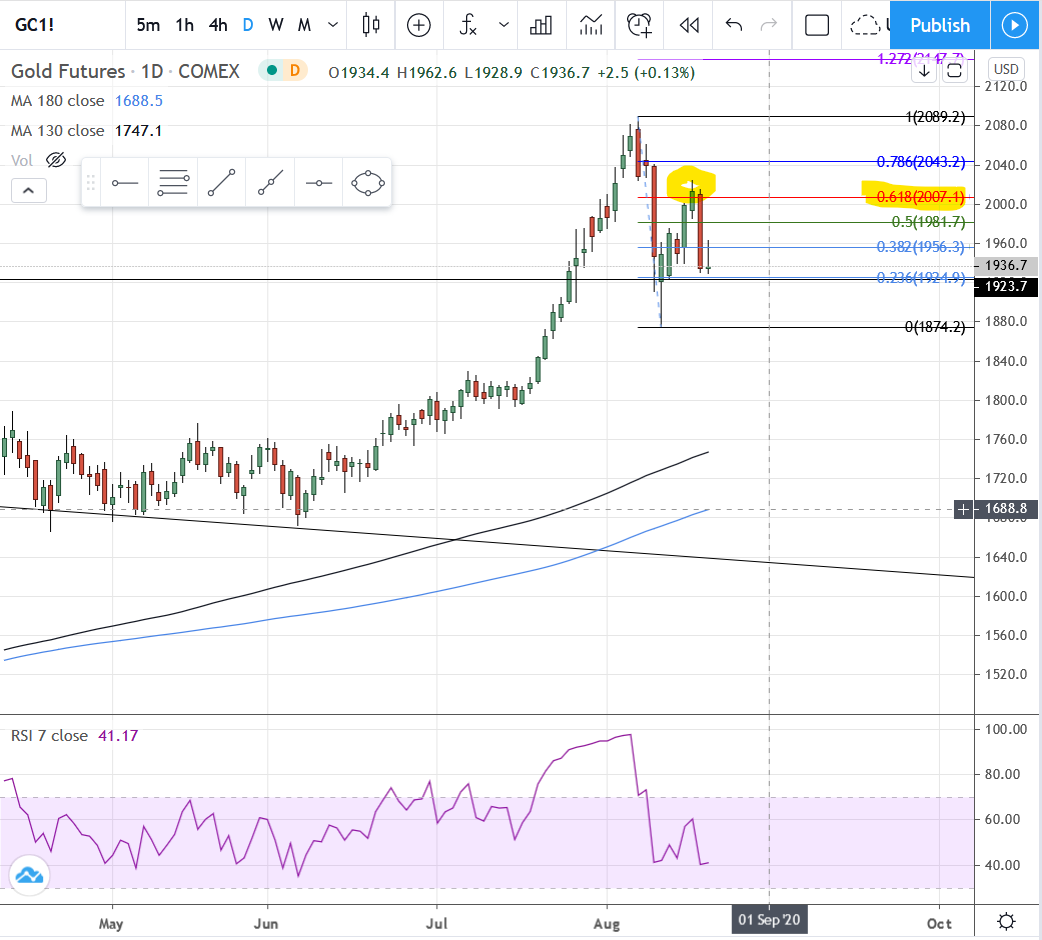
Gold did look like it could head back to the highs and recovered a bit over 70% of the drop, but that was as far as it was going to get, and so the pattern of the recovery ends up being a bear flag.
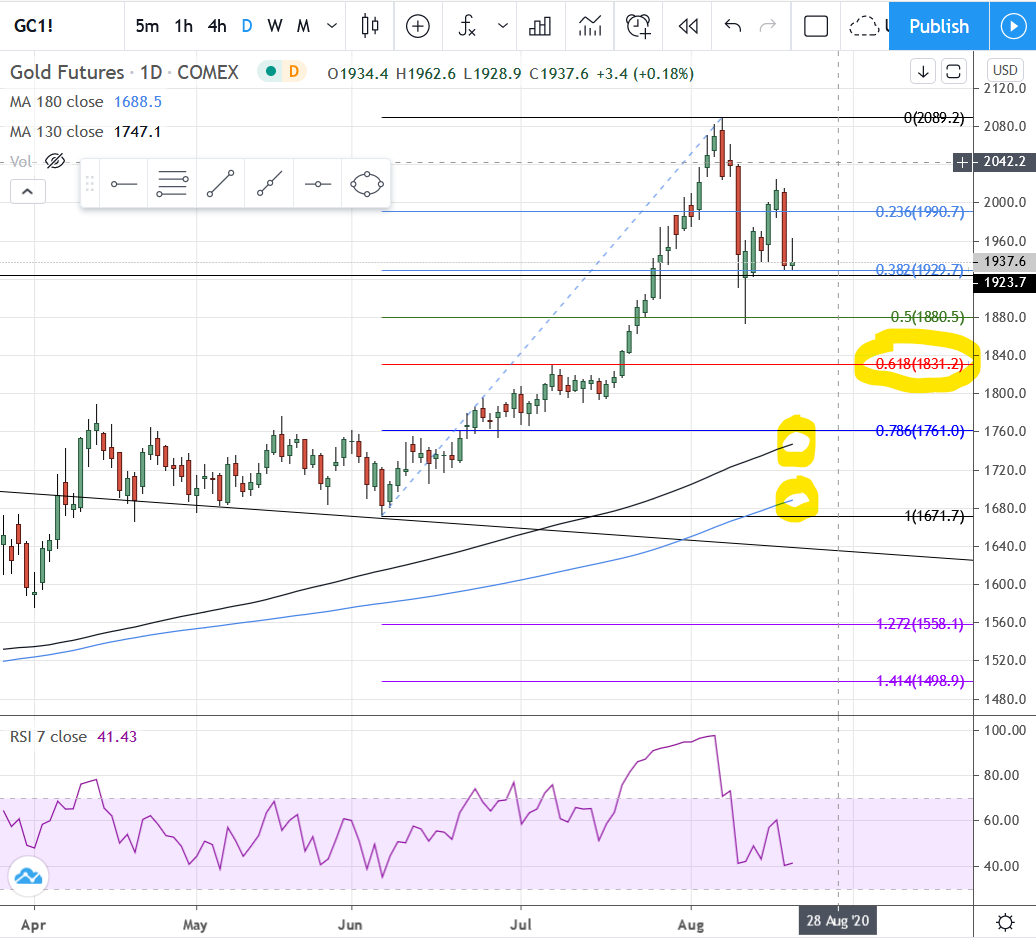
I feel pretty confident that gold is going to at least hit the 61.8% retracement level circled on the chart, and I expect a move below that to one of the moving averages circled. From there I think we’ll get some sort of bottom formation and then head back up to make new highs.
As things develop I’ll update.
3 Likes
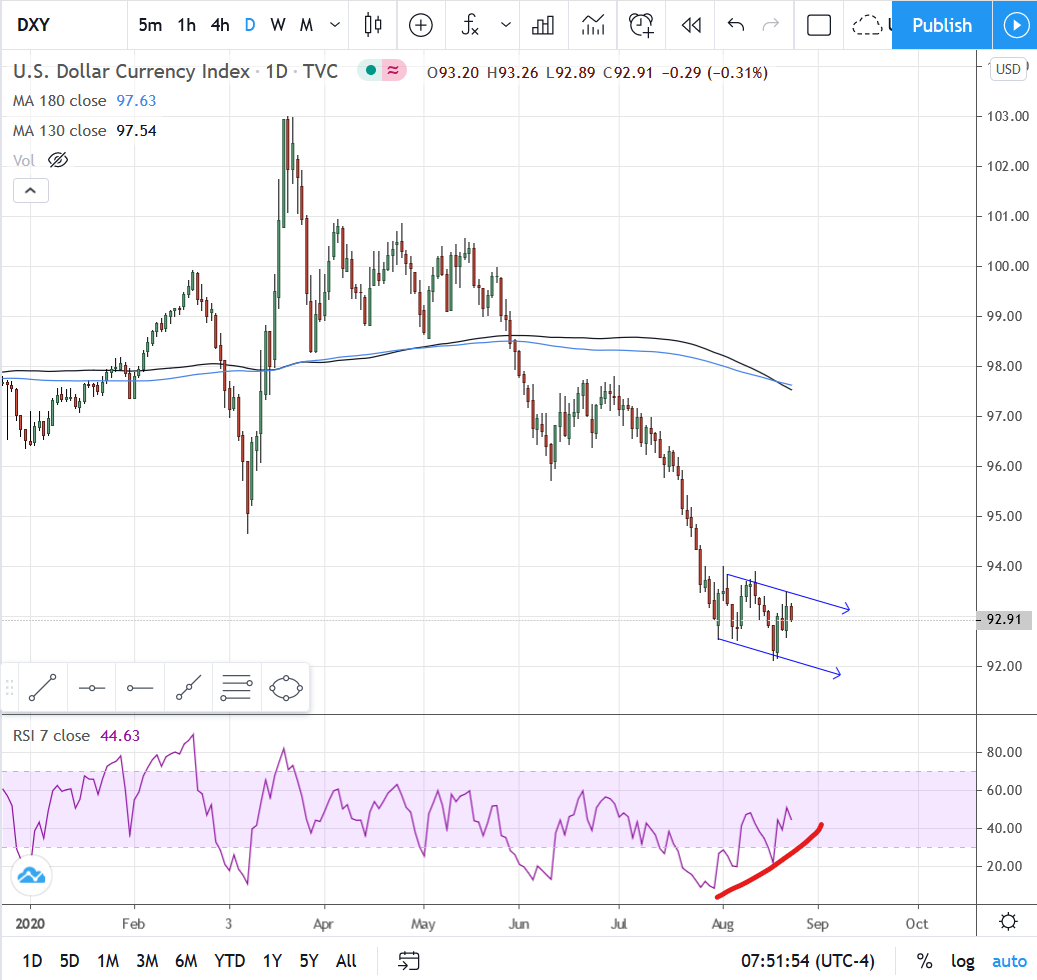
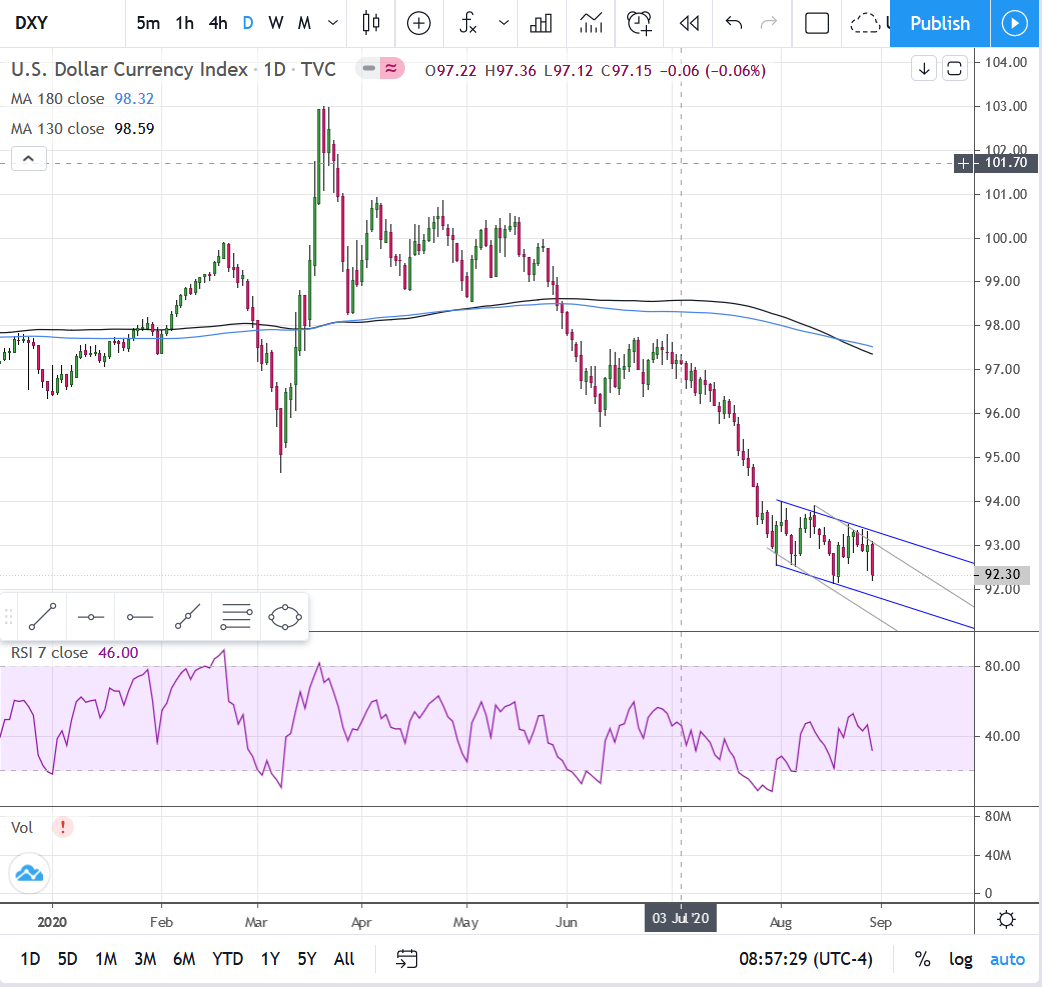
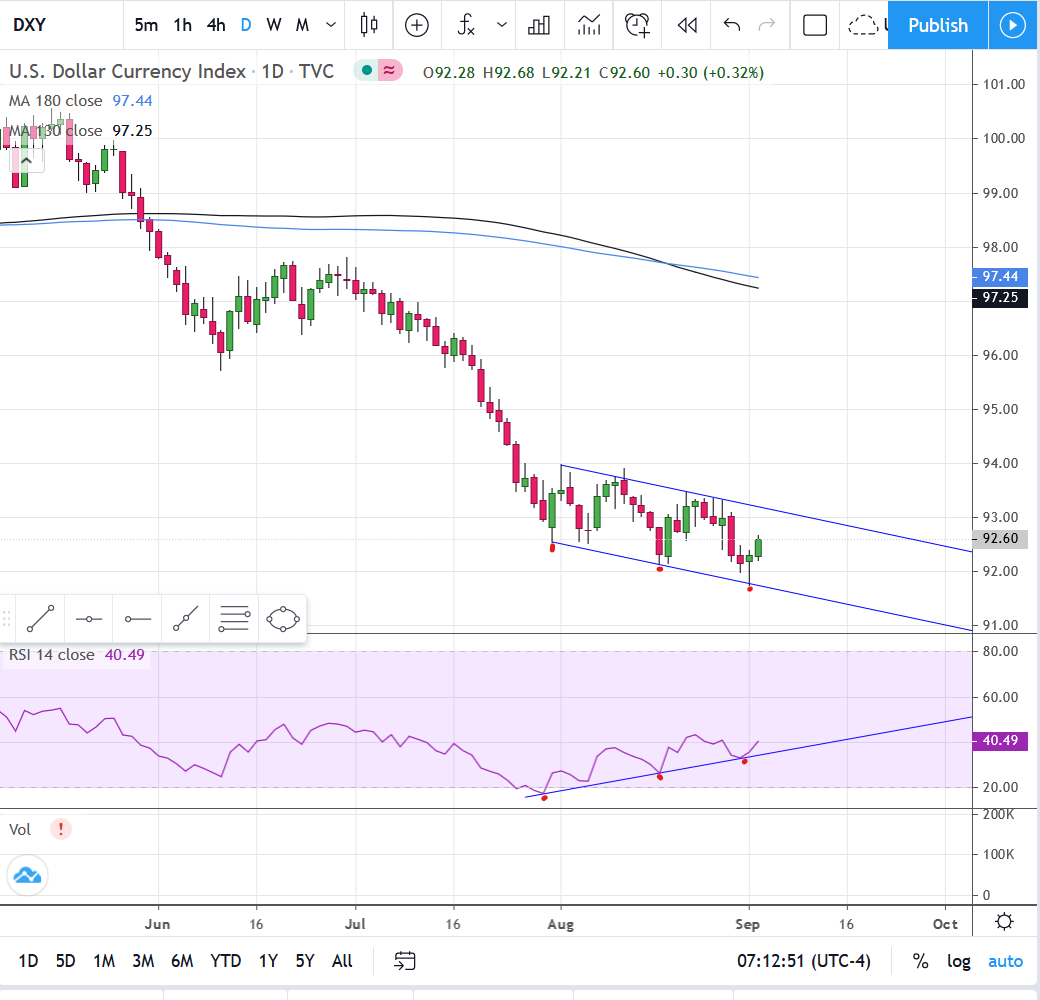
Here’s a daily chart of the dollar, which has had quite a decline as a result of, well… you know. Since the end of July the dollar has been trading in a downward sloping channel…at the end of quite a precipitous drop. As a trader, whenever I see a downward sloping channel forming at the end of a downtrend, or a rising channel forming at the end of an uptrend, I get about as excited as a teen who just found his dad’s old collection of nudie mags in the attic, especially when the RSI is doing what this RSI is doing… hitting higher lows as the candles hit lower lows. That’s divergence and that means at some point the dollar is likely to have an upside break out of this channel. Where it will go I don’t know, but my guess is at least to about 96.00, if not back up to the 130/180 MA’s currently at about 97.50, or most likely hit the 50/62% retracement levels in the range between the last major high a tad under 98.00 and where ever the low ends up being once the breakout of the channel occurs.
Here’s an updated dollar chart…
Note the potential “steeper”, if that’s a word, channel.
1 Like
Gold and Silver Futures
Gold so far seems to be saying that 50% is enough of a retracement. The consolidation that has occurred since that level was hit is forming an Adam & Eve bottom, which is highlighted on the chart. Yesterday’s strong trading appears to be the beginning of the right side of the “Eve” portion of the formation. For this to play out, gold must continue to climb to its previous swing high of 2024.60 and then break out from that resistance. The measured move is about 150 points, which would give us a target price of $2175. Thursday’s candle turned out to be a false breakout, with Friday recovering to close to the high from Thursday. The best case scenario is to wake up Monday with gold continuing its strong move higher. We’ll have to see if it doesn’t pull back now to test the top of the downtrend line on the chart before going higher, or if Friday’s action isn’t sold off as a bull trap.
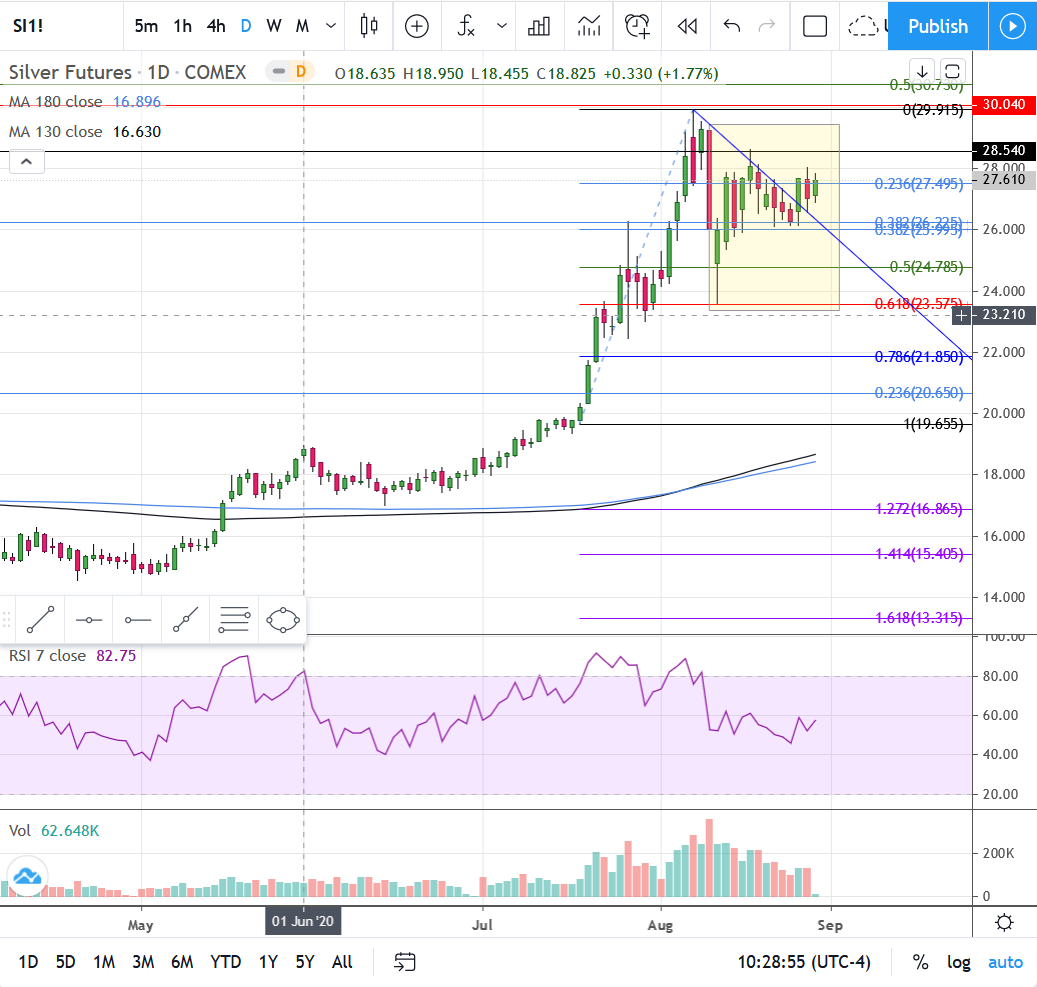
Silver has the same formation as I discussed above with gold, as highlighted on the chart. The breakout for silver, if the formation plays out, is at 28.605. The target price is $33.63.
1 Like
NVO
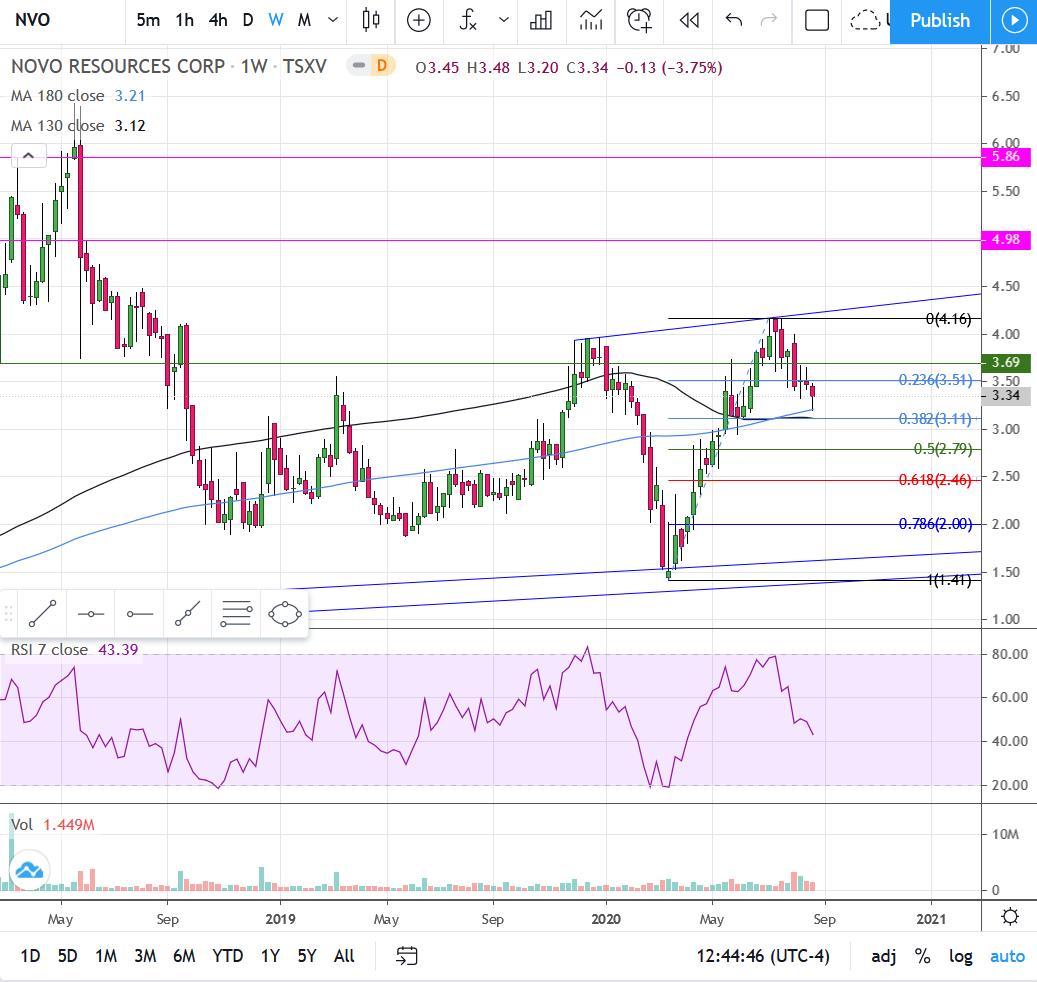
The weekly interval chart shows a retracement, which at this point looks like a bull flag, down to the 180 MA and a subsequent bounce… thus far. The “V” on this chart looks like a beautiful “Adam” portion of an Adam & Eve formation. If it is it would be nice if the “Eve” portion doesn’t go below the 38% retracement level, but in actuality if it is that formation we’ll see the 50 or 62% levels hit. For now the 180 MA @ 3.20 is support with the 130 MA just below at 3.11.
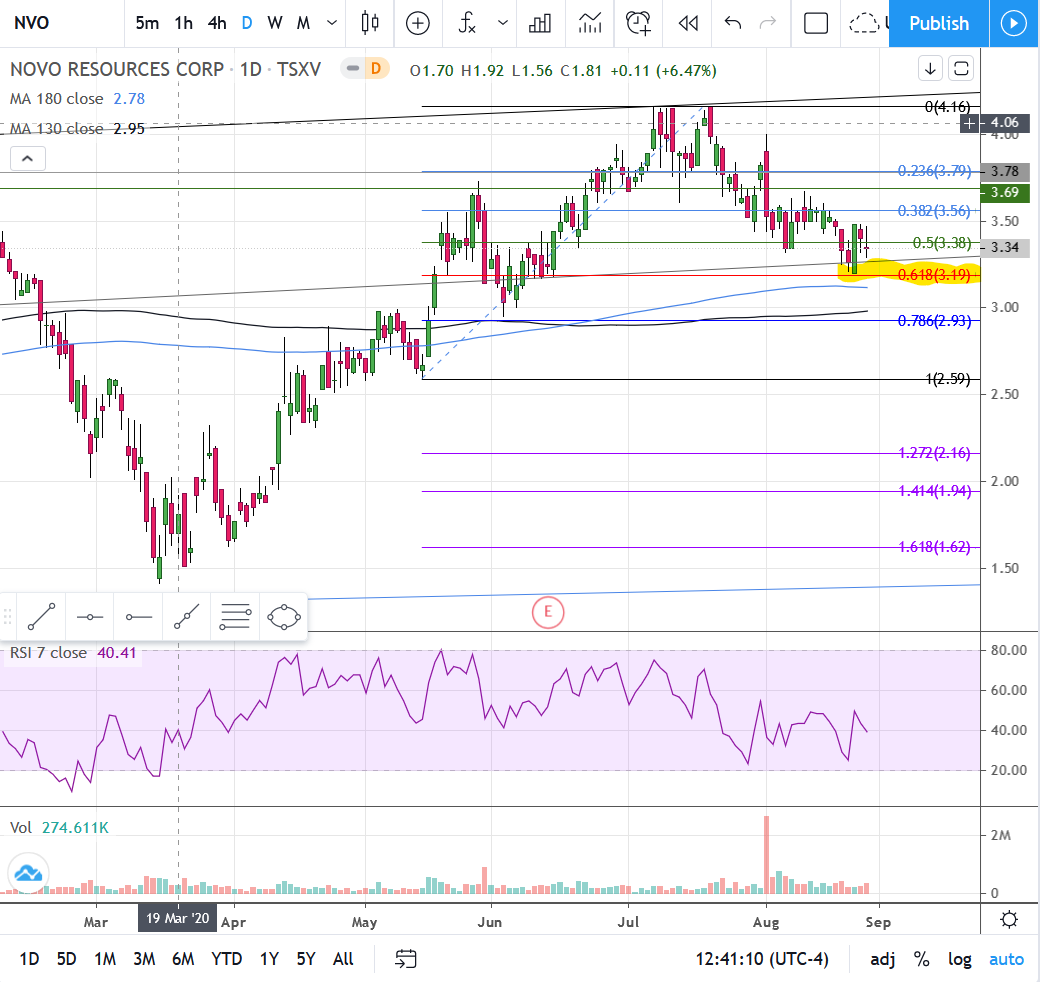
On the first daily interval chart you can see that NVO came a Canadian penny away from tagging the 62% retracement level (which irked me a bit because that penny was the distance between me having another 5k shares, but maybe I’ll get another shot). Just below are, again, the 180 and 130 MA’s at 3.12 and 2.98 respectively. There is also an old trend line running through offering some support here.
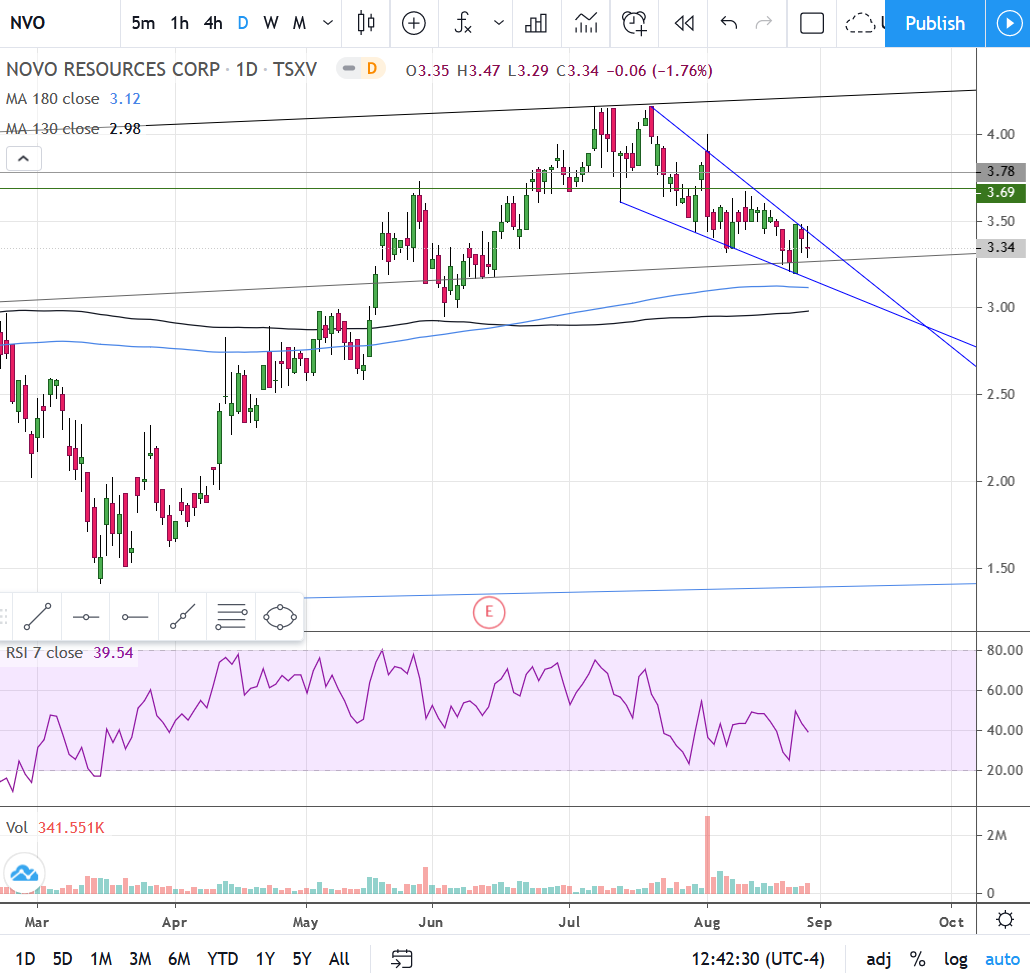
The final daily interval chart is without the Fibonacci grid and with a falling wedge formation drawn outlining the candles since the price hit its high at 4.16. If this wedge is confirmed then a breakout to the upside will occur literally any day, and very likely next week if it’s a legit falling wedge.
To my eyes all signs in these charts are pointing to higher prices fairly soon. We could get a little more downward movement but I don’t think much below $3.10. The RSI indicators on all charts are down near 40. I wouldn’t mind seeing them drop another 10 ticks before heading higher, but there is room for the stock to start another leg higher any time, and that looks more likely to me than to see much in the way of significantly lower prices.
1 Like
KRR
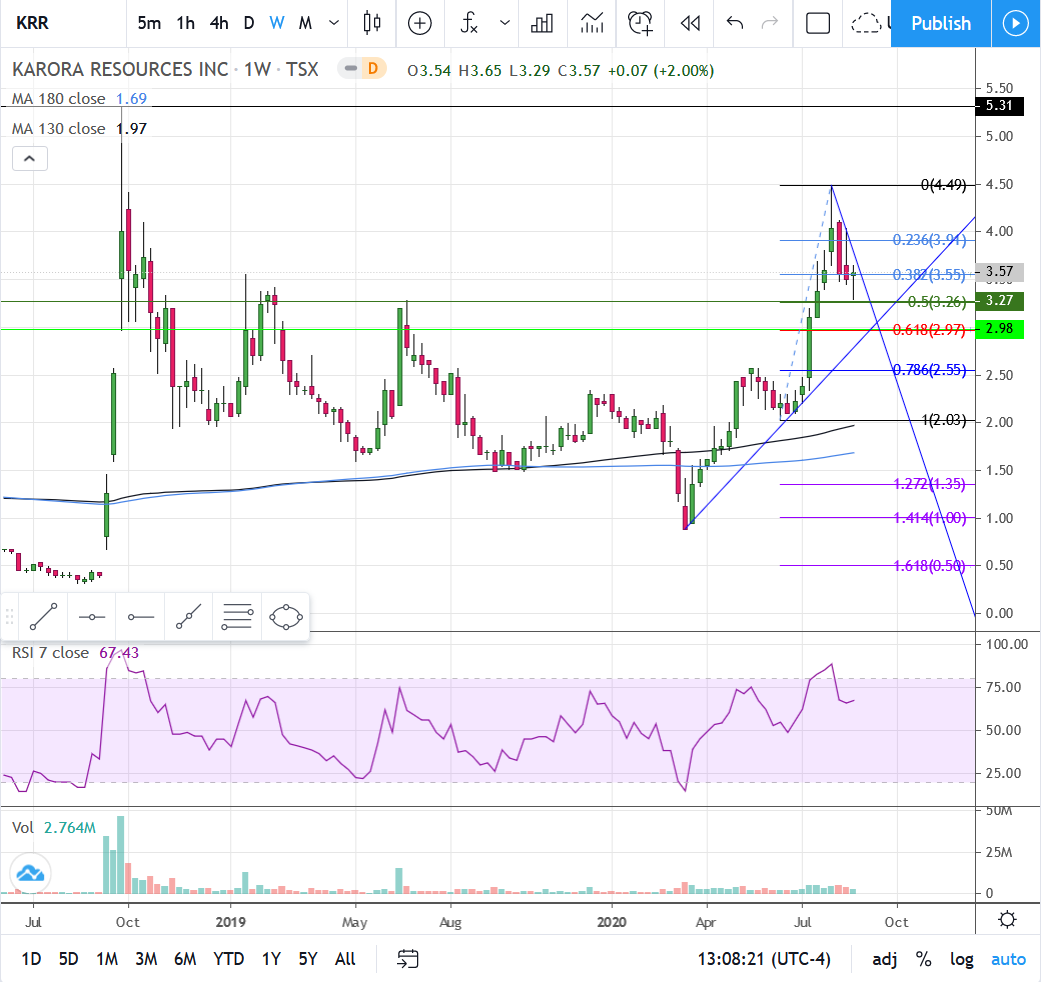
KRR so far has done a 50% retracement of its last major swing low of $2.03. There is a zone of horizontal support in the 3.30 - 3.18 range. If the lower end of that support is lost then we’re likely to see the 62% retracement area hit.
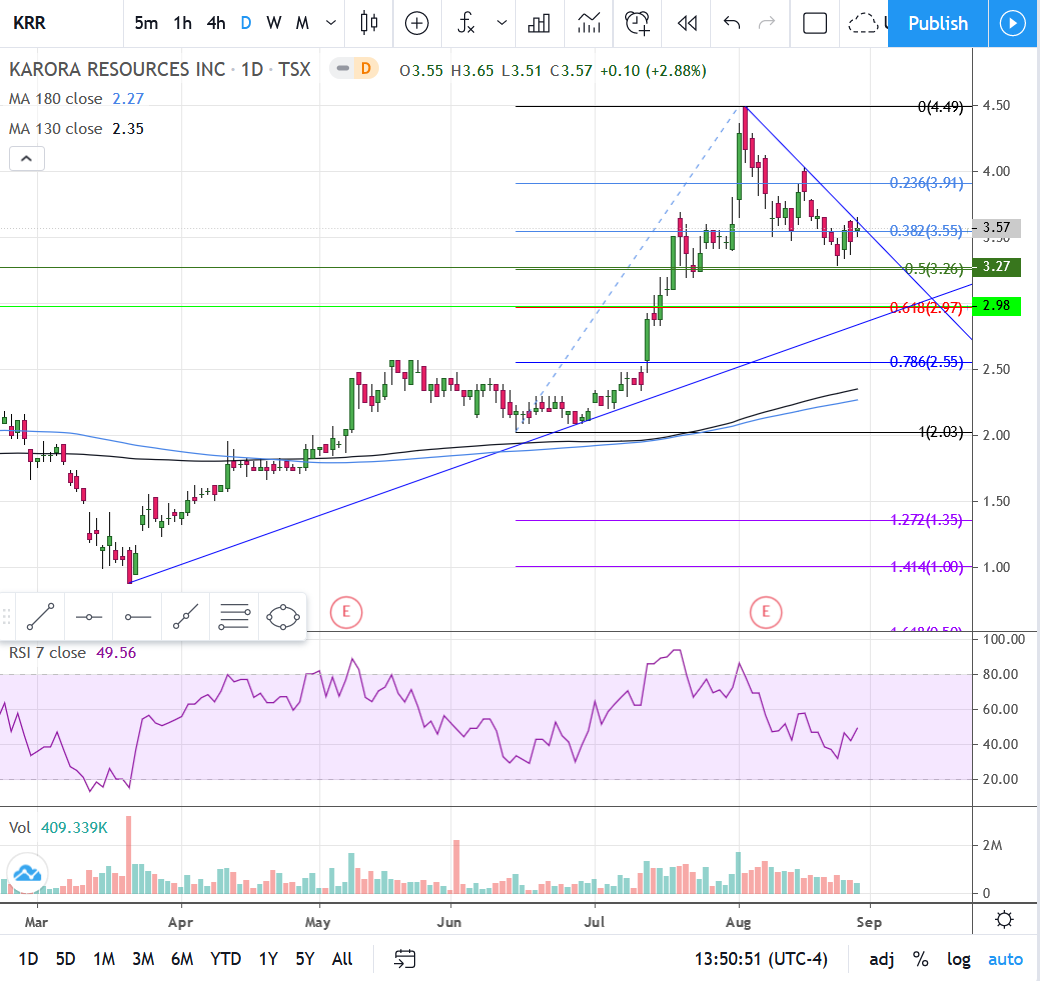
The daily chart shows downtrend line resistance, which was pushed through as a bit of a bull trap on Friday, but it probably didn’t do a lot of damage as volume was low and there wasn’t a lot of price movement above the downtrend line. In the event of another leg down, which looks possible, watch 3.26 at the 50% Fib retracement for a double bottom, or perhaps a visit down to the 62% retrace level at 2.97. If perfectly timed that 62% Fib level could be hit around the same time the uptrend line support is hit and the daily RSI will be at 30 or lower, all lined up for the next leg higher. Then again, if gold is to open $20 or more higher Monday morning we may just get a breakout to higher prices. Hard to say which, as both are very possible.
1 Like
MUX
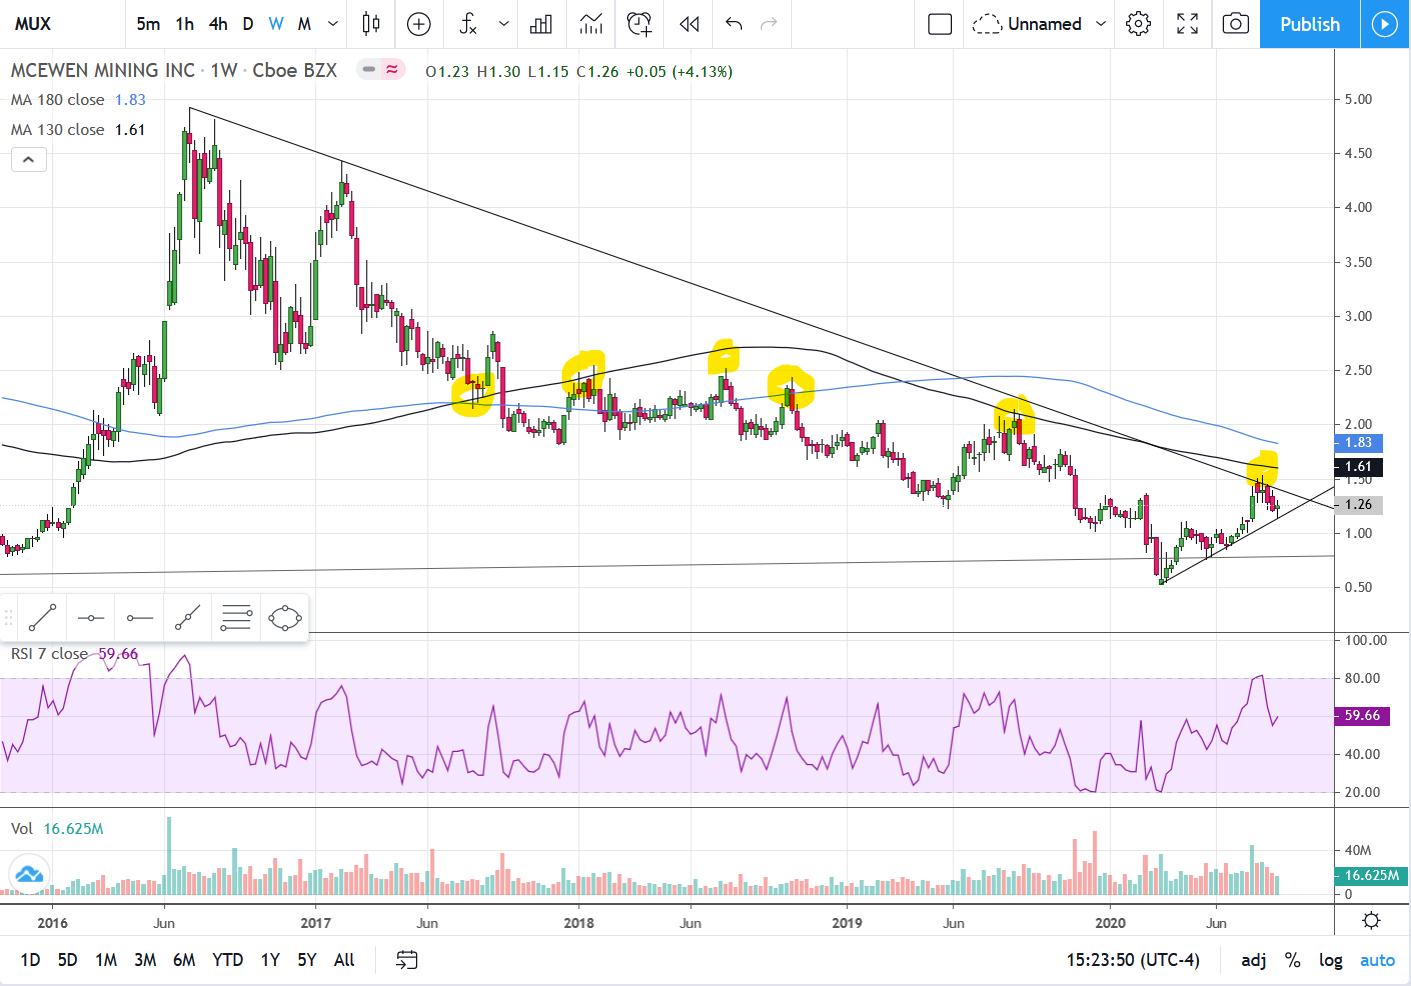
On the weekly MUX chart I highlighted in yellow how the 180 and 130 MA’s have been resistance points for the past 2+ years. The first yellow area to the left was the last time those MA’s were support. Since that support was lost in June of 2018 MUX has been in a downtrend, rejected by the 180 and/or the 130 MA’s 5 times. Most recently it was downtrend line resistance, with the 130 just above. Last week MUX bounced off the uptrend line support. The price is being pinched so the rest of this year is going to be interesting. So far, “the trend is your friend until it ends”.
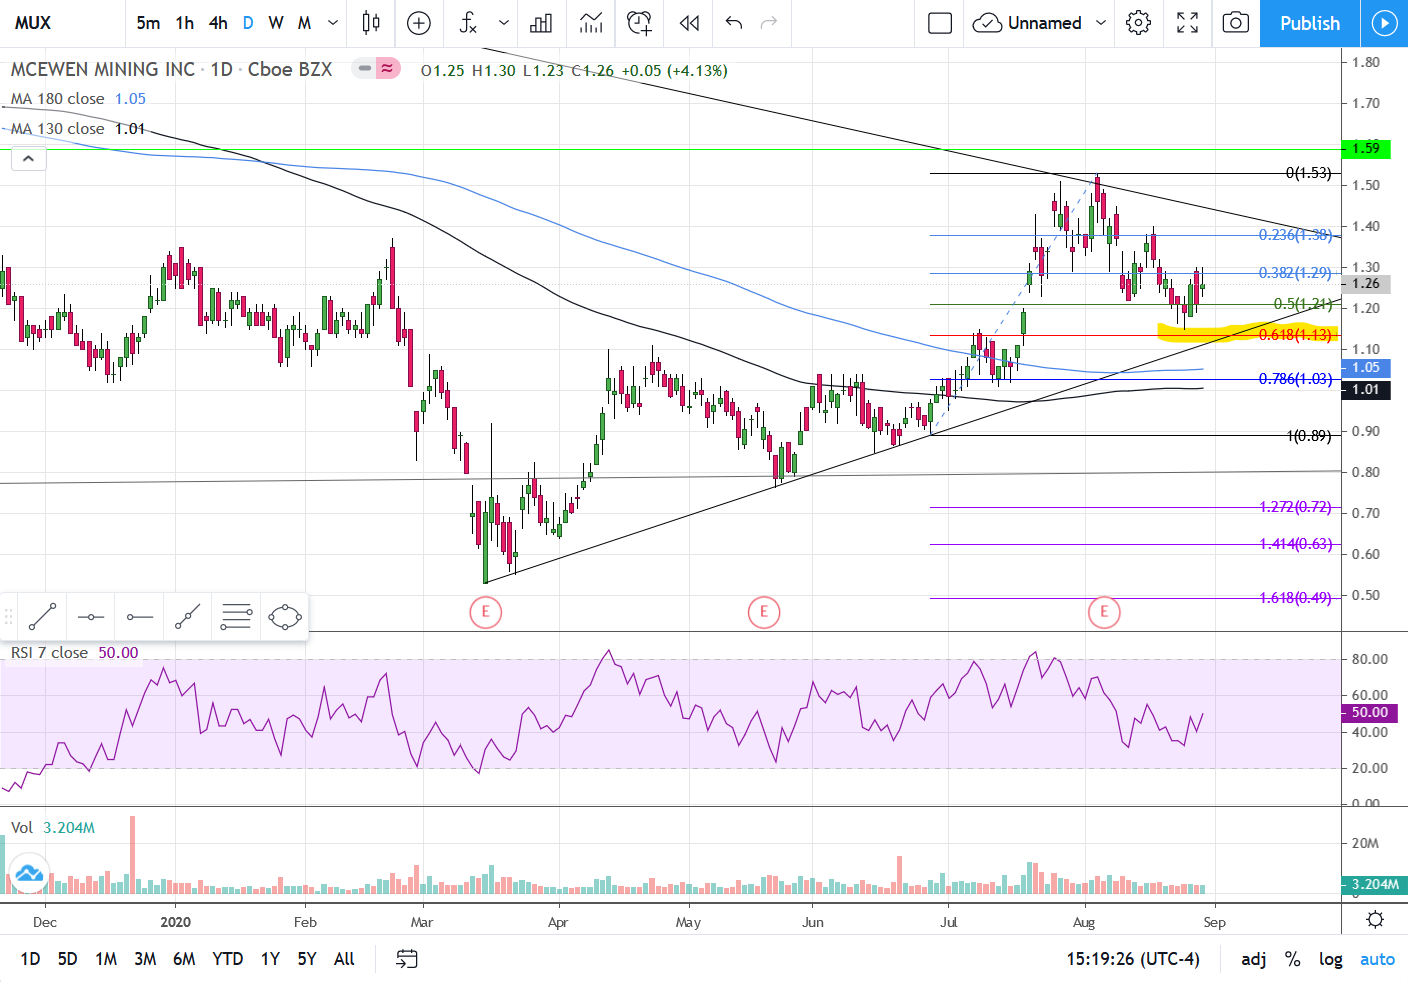
On the first daily interval chart, MUX came a few pennies from hitting the 62% retracement level of its breakout starting in late June. Note that the 180 and 130 MA’s are now support on this chart. This hasn’t been a consistent occurrence since before October of 2016. Perhaps a new uptrend has finally begun? It’s too soon to tell as MUX has on several occasions since 2016 spent some time above these MA’s, only to lose their support each time after a couple weeks of trading. At this time the MA’s are both just beginning to curl upward, which is a good sign. Hopefully they can hold support dependably on those MA’s going forward.
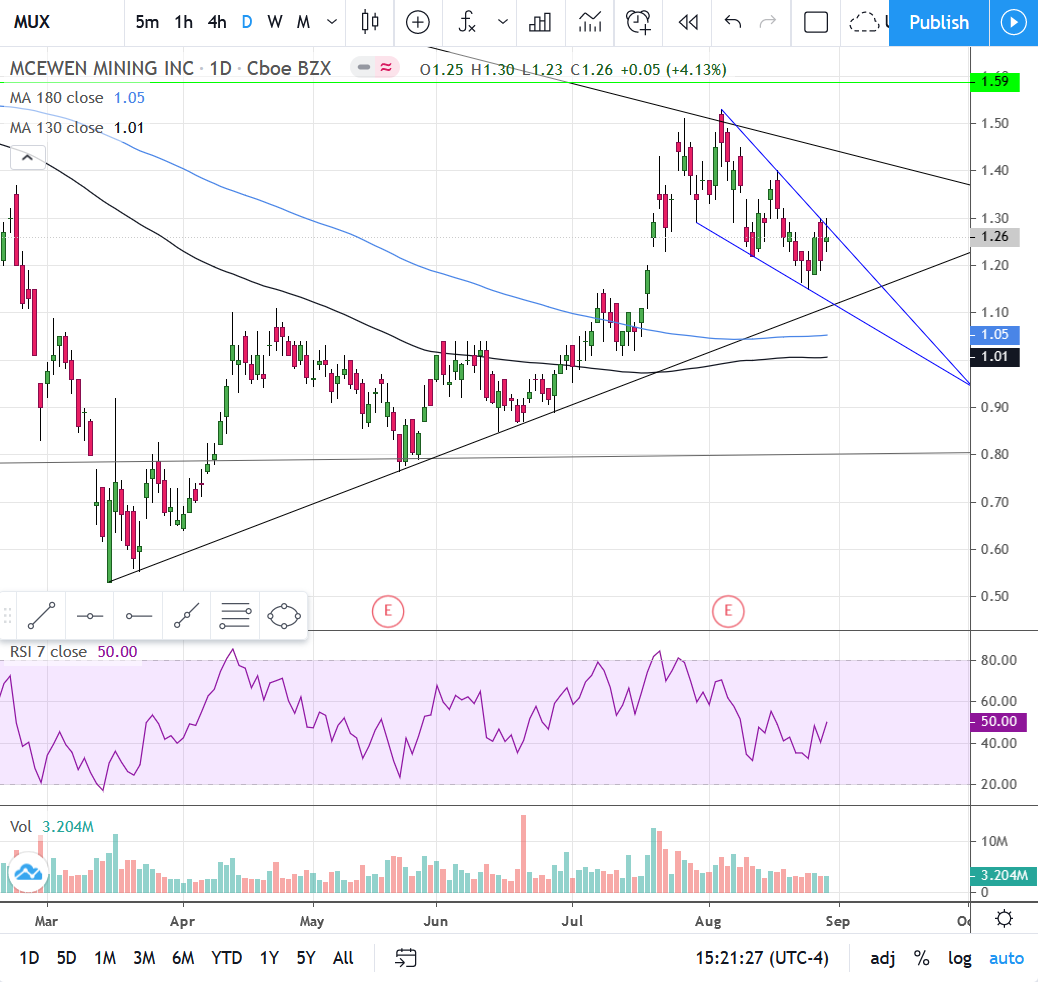
On the last daily chart MUX has a similar falling wedge formation to NVO. As with Novo, this wedge can break out at any time. If it pulls back first watch for support at the uptrend line or the 180/130 MA’s.
1 Like
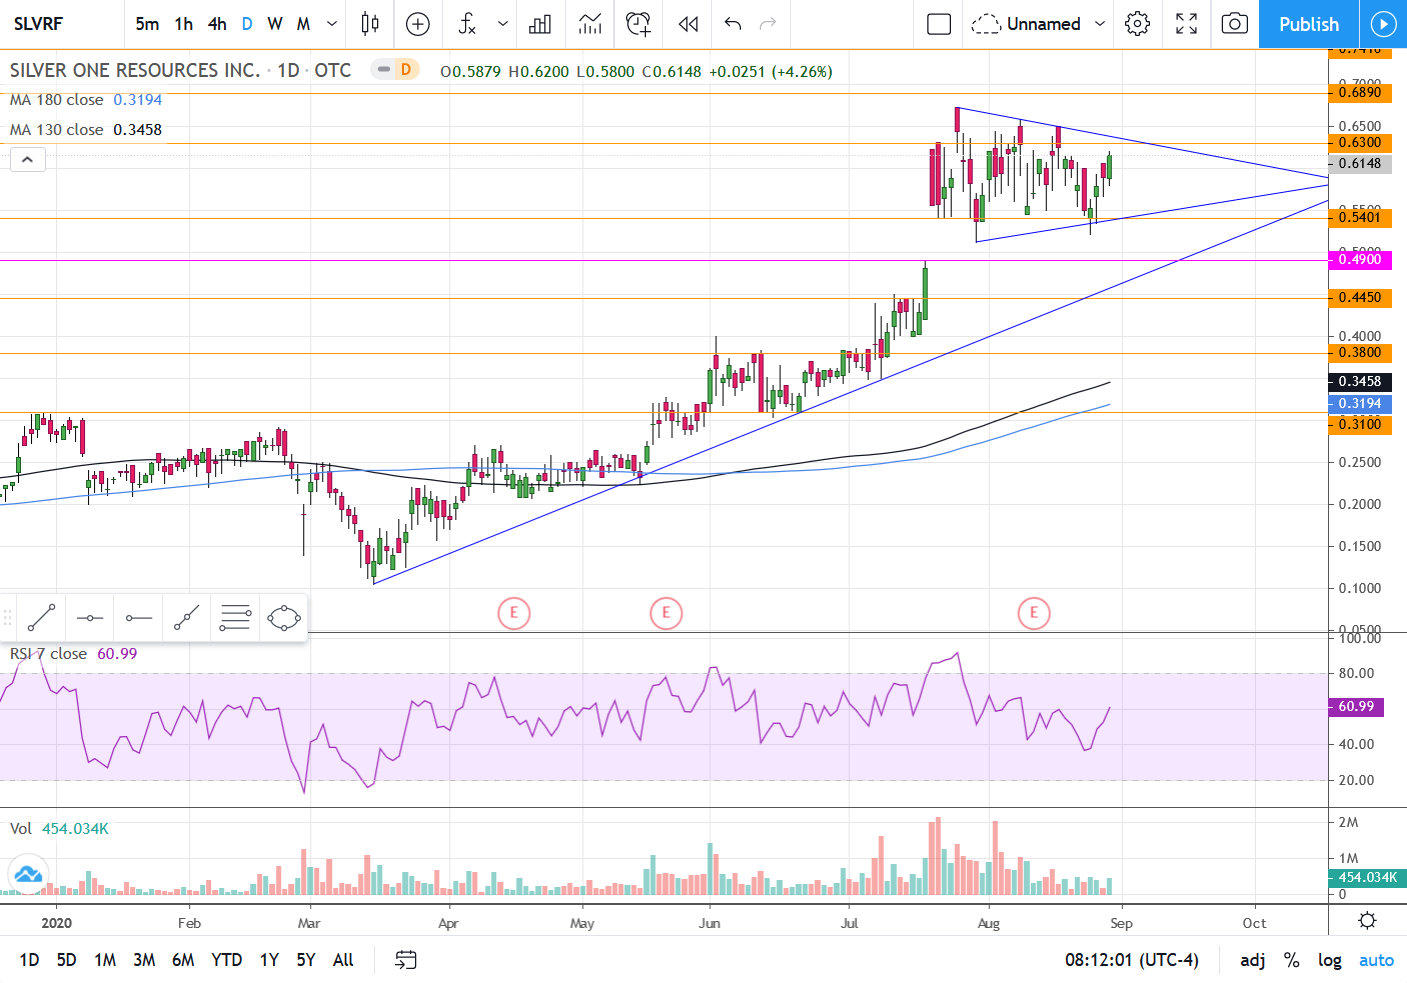
SLVRF
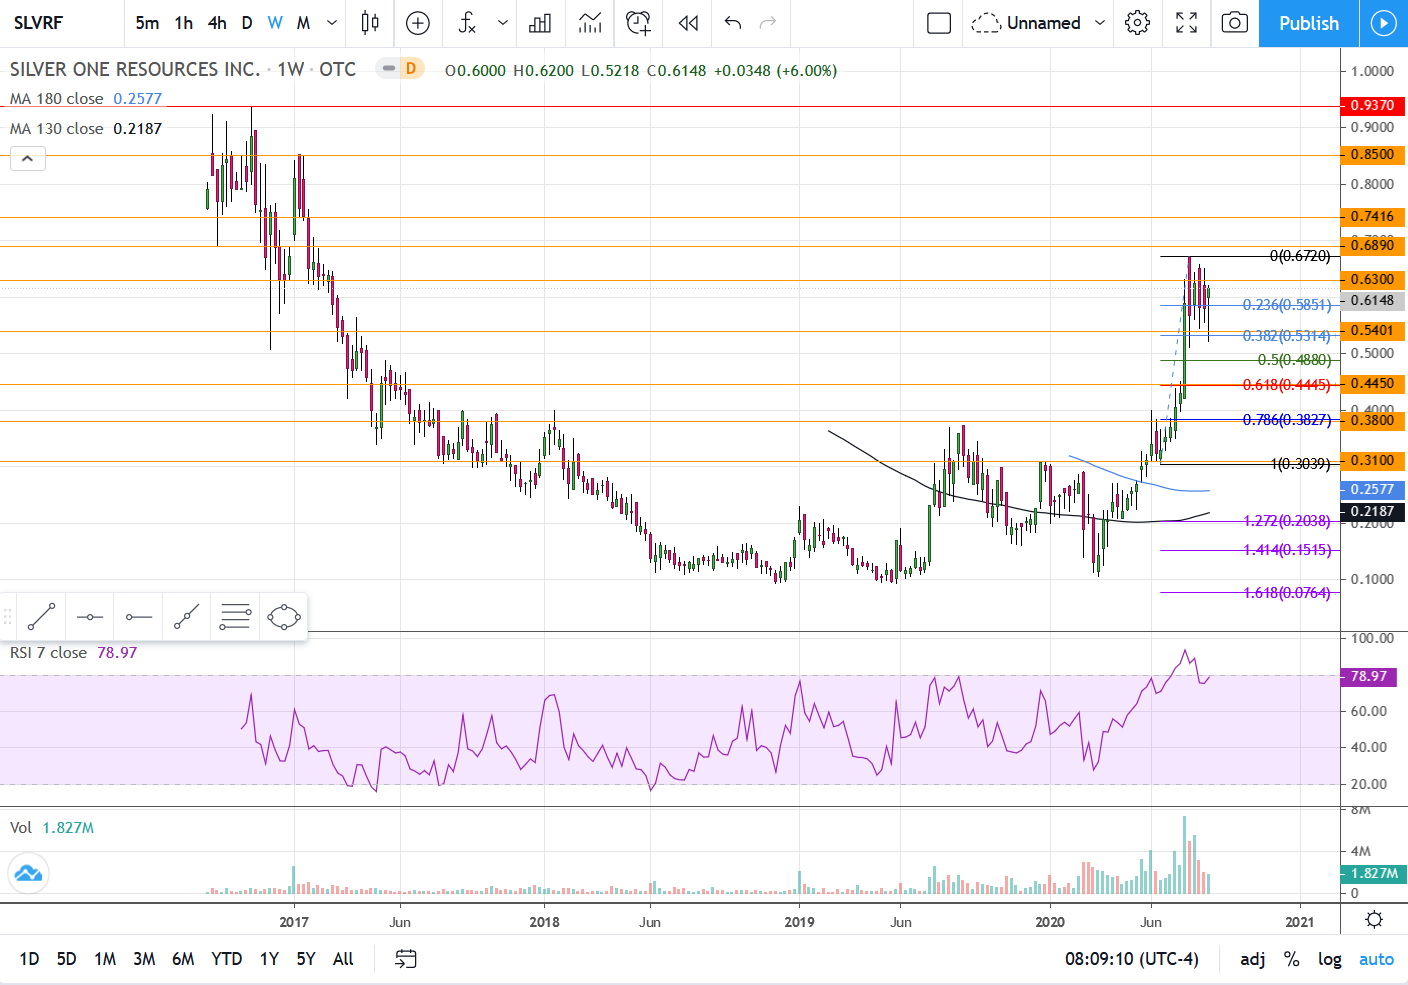
This 6.7 bagger since mid-March is showing overbought as far as the RSI is concerned, but currently looks to be consolidating in a symmetrical flag formation that could breakout anytime between now and the third week of September…if it should break at all. By definition, symmetrical triangles most often act as rest period before a continuation of the trend. That’s So far there has been not much in the way of a retracement beyond the 38% level. There’s not a whole lot of history on this chart yet, but I laid out where I think the best bets are for horizontal support/resistance.
The daily interval chart outlines the symmetrical triangle the stock is currently consolidating within. The target of a breakout from here would be to around .79. There is gap support at .49 and uptrend line support a smidge below that. The 130 and 180 MA’s are currently in the low .30’s, but are moving up at a clip of about a penny every 4 days.
1 Like
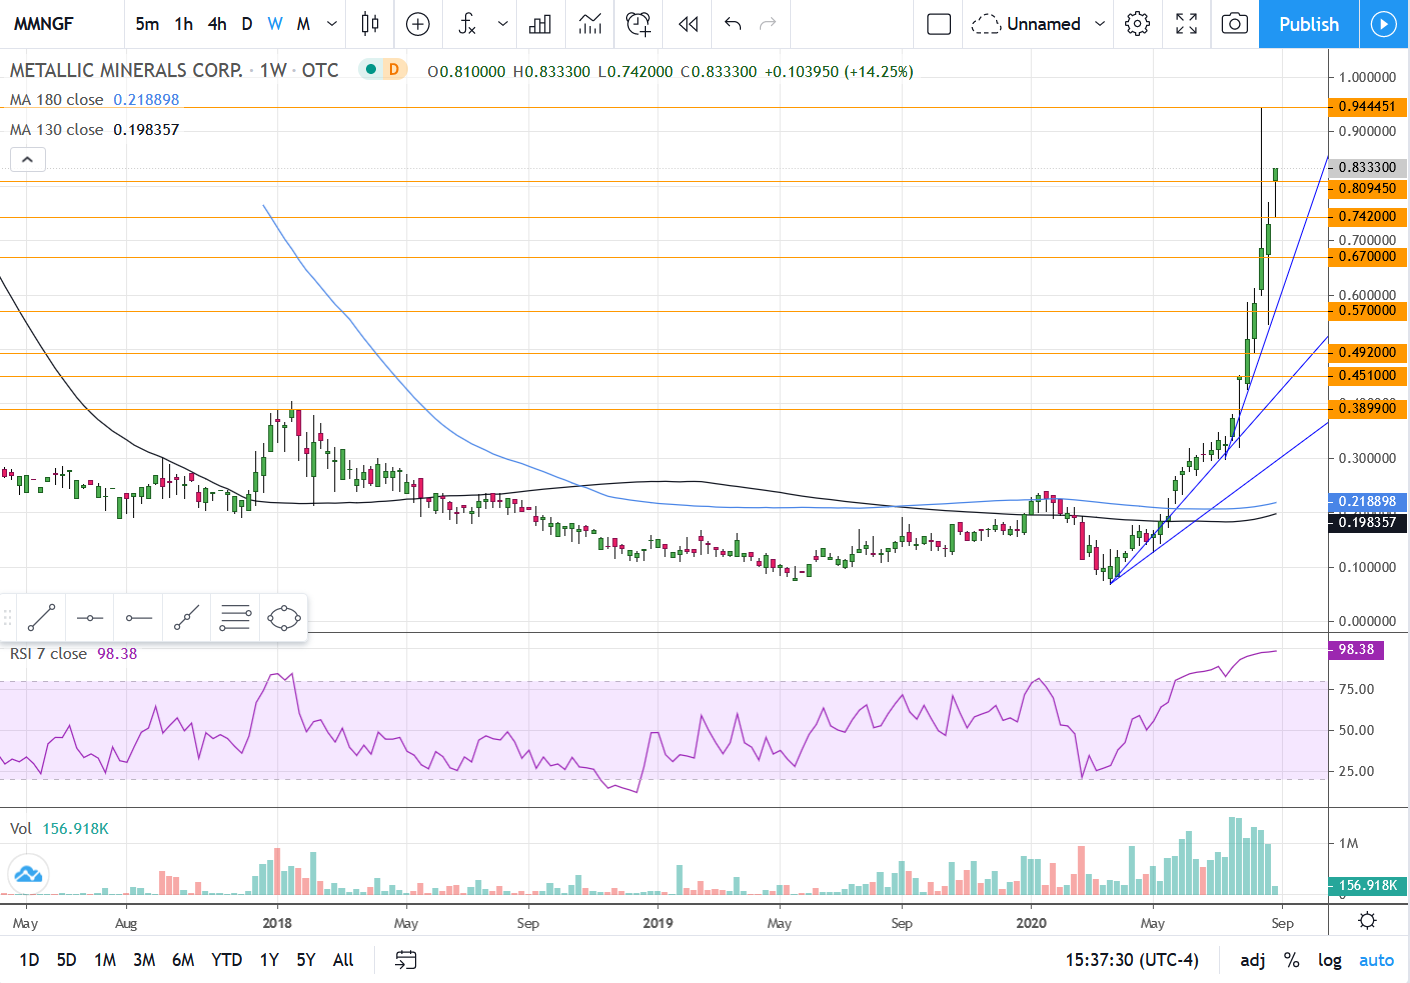
MMNGF
This one is En fuego. Despite being technically waaay overbought, apparently the fundamentals say otherwise. This is a weekly chart with some trend lines and horizontal support/resistance. Not a heck of a lot more to do on this one.
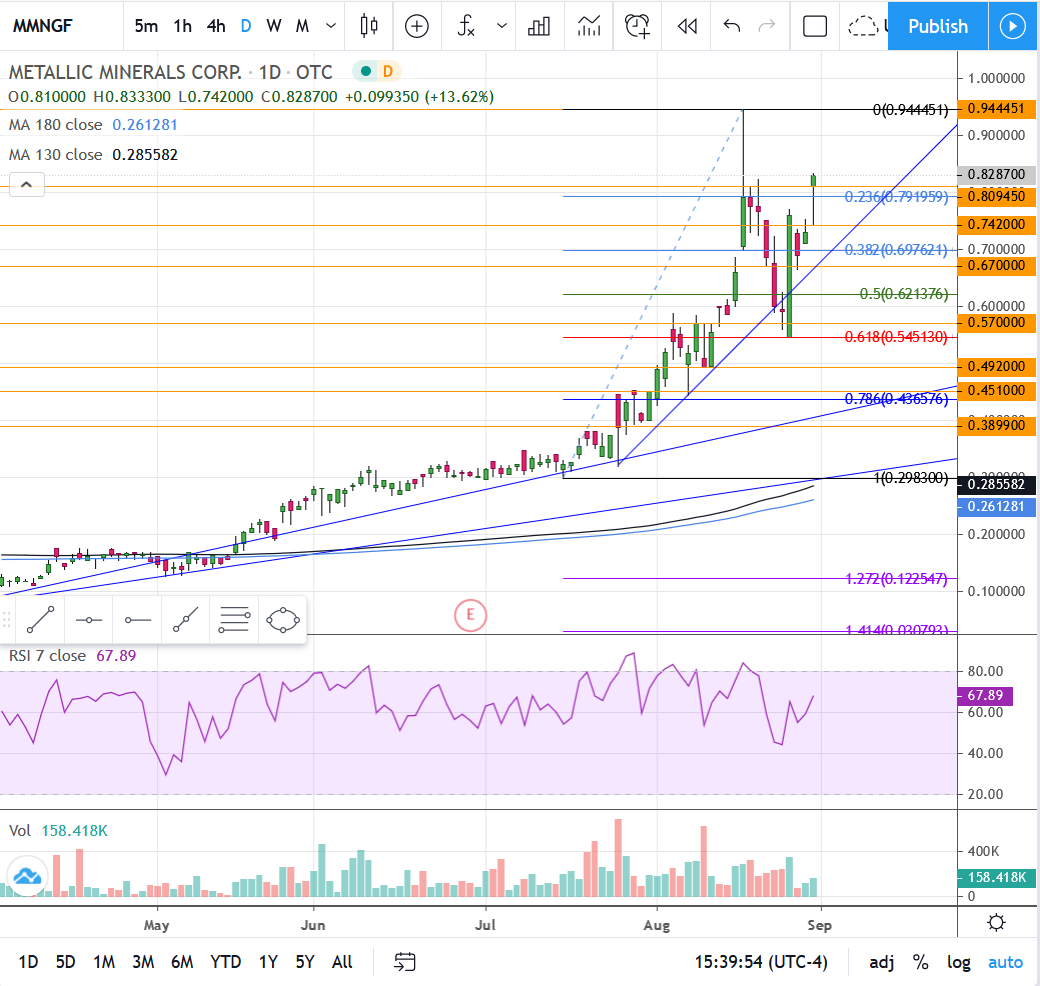
On this daily chart we’ve got a couple of uptrend line supports that show that you have to be careful about putting too much emphasis on the trend lines lest you be thrown like a bull rider then left in the dust. Although I drew the trend lines on this chart, use them as zones and not as price points. Looks so far like the Fib retracements are far more dependable. The MA’s appear to be as well. So here the stock ran up to about .944 then retraced 62% of the range from the high to the candle where the breakout began. This violated the most recent uptrend line for a couple days, although violated trend lines can still be useful. The stock is in the bottom of the range where the selling occurred from the highs. I can tell by eyeballing that it has already recovered close to 78.6% of the drop and has a good chance of revisiting the .944 high.
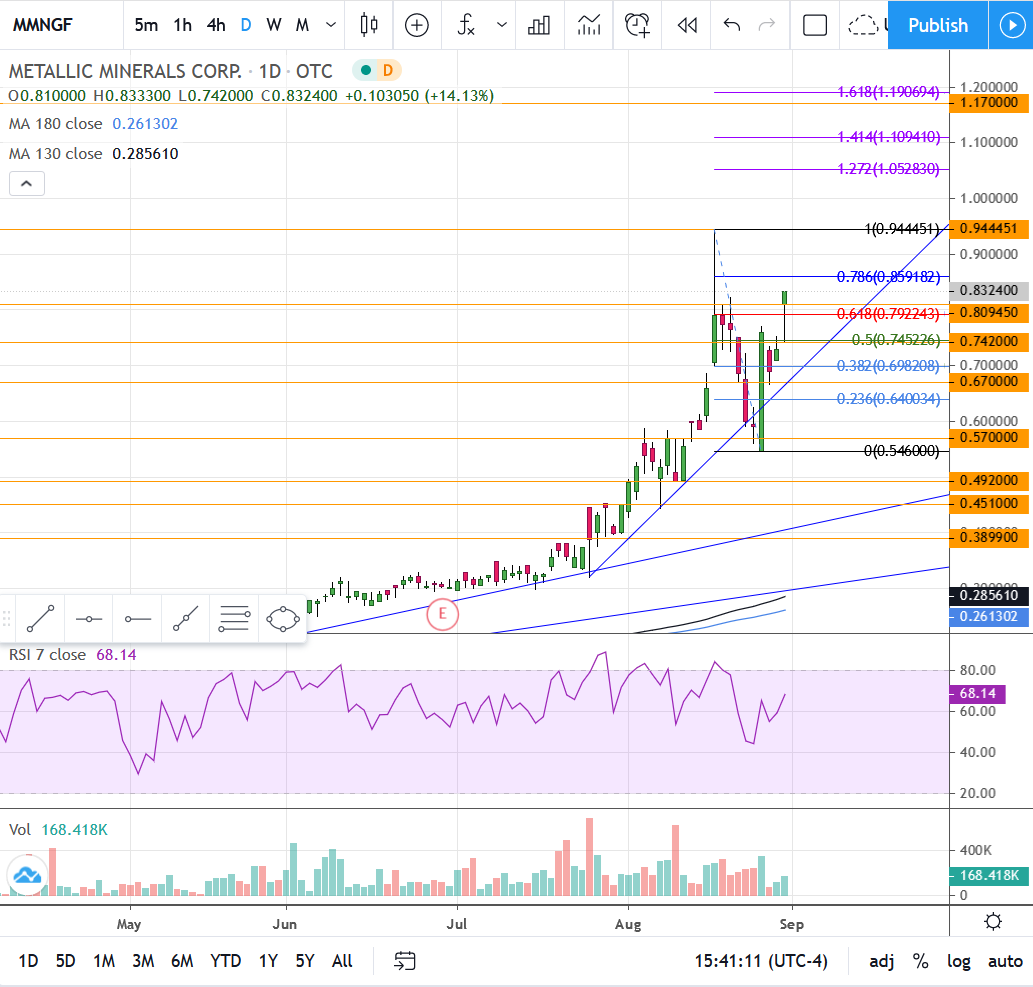
In the event that it does revisit the .944 high, the Fib extentions and an old horizontal line provide potential upside targets. The only formation I can pick out in the candles since the pullback from .944 is a funky looking Adam & Eve. If I turn out to be right then a break of .944 should get you to around 1.09 as a target. Thanks for the challenge Richard!
Thanks Rich,
I took a little off the table today just in case it does retrace I’ll pick some shares back up. This is exactly the kind of technical chart that can push one out of a position if selling incrementally on the way up. If it retraces, it provides the opportunity to accumulate a larger position if profits are used to accumulate more shares with whatever the trade provided. If it works out, I like to think of it as a reinvested interest payment.
EZ
2 Likes
Dollar update
The dollar just bounced off of the lower channel trend line for the third time. Oftentimes a change of trend or pattern occurs after the third or fourth test of support or resistance. We’ll see soon if the dollar plays along. I’m looking for an upside breakout from the upper channel trend line. On the RSI study at the bottom of the chart I marked the higher RSI lows that were hit as the dollar hit lower lows on the candlestick chart. That’s positive divergence which tells me to anticipate the dollar breaking out of this channel to higher levels, as a guess to the 50 - 62% retracement levels of the last swing high from late June. That would mean the dollar would at least get to 94.77 - 95.49. Typically this would mean a drop in the price of gold.
2 Likes
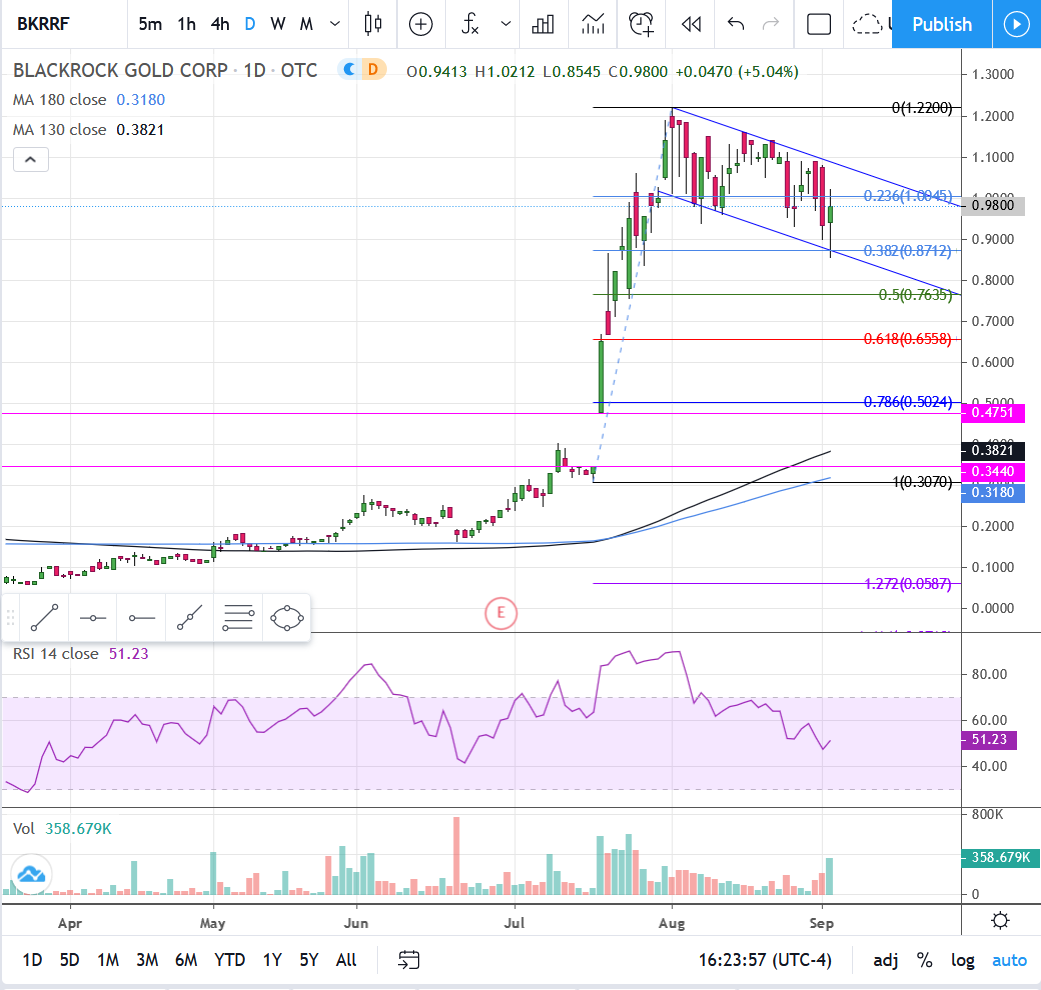
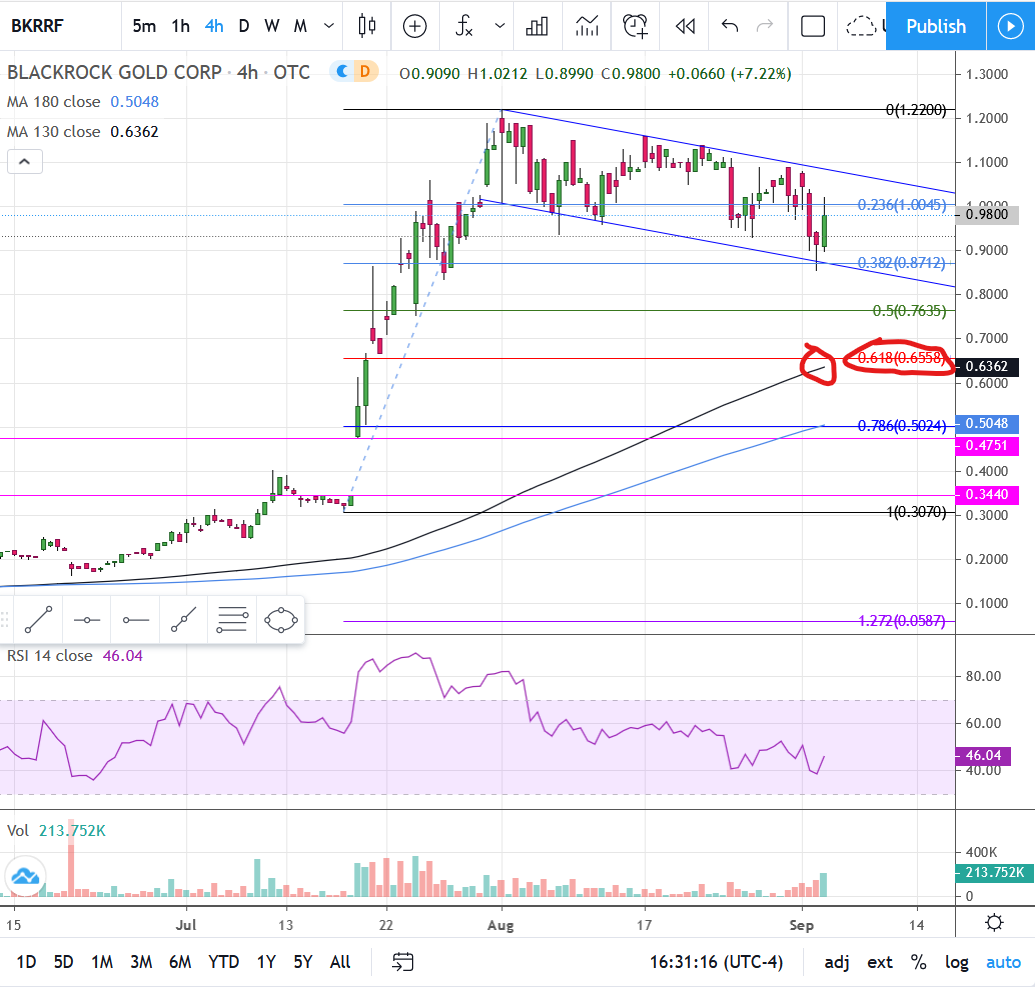
BKRRF
Gapped up on July 17 leaving horizontal support lines at .4751 and .3440. The stock consolidated into a bull flag and then has morphed into a channel. RSI hit 50 and price has retraced a tad past the 32% mark thus far. As usual watch the 50 & 62% levels, as well as the 20EMA, and 30, 50, 130 and 180 MA’s on the 4 hour interval chart. Take a historic look back and see how those MA’s behave in up trends, down trends and consolidations. I haven’t looked but I’d bet you’ll see at least a couple of those work well for support/resistance. (The 4 hr is the second chart, but with only the 130 & 180 MA’s since I don’t subscribe to these charts and I closed my broker charts down for the day).
If the current rate of price decline continues inside the channel and the current rate of ascension of the 130 MA remains consistent, they could intersect right around the 50% retracement level.
Great review Rich. I hear you’re now in competition with a rival chartist from "Charts are Us! 
It seems many of the speculative miners that have gone “en Fuego” as you put it are now retracing. This is making use of longer interval (weekly, monthly) key levels on charts less useful for incrementally acquiring a larger position. Appreciate seeing what levels you look at on the shorter interval charts. Usually there is less risk when short, medium and longer interval charts all align to support a trend. These awesome “en Fuego” charts may be retracing, but with gold/silver apparently trending up, I doubt many of them will retreat to earlier levels indicated on the weekly and monthly charts, at least for the time being.
1 Like
Two I’ve had some success with and maybe looking for new entry levels, so TR, if you have the chance WLL and ACB are back on my radar
GC… I can do ACB but WLL must have done a major reverse split or something otherwise my data is screwy and the charts are useless.
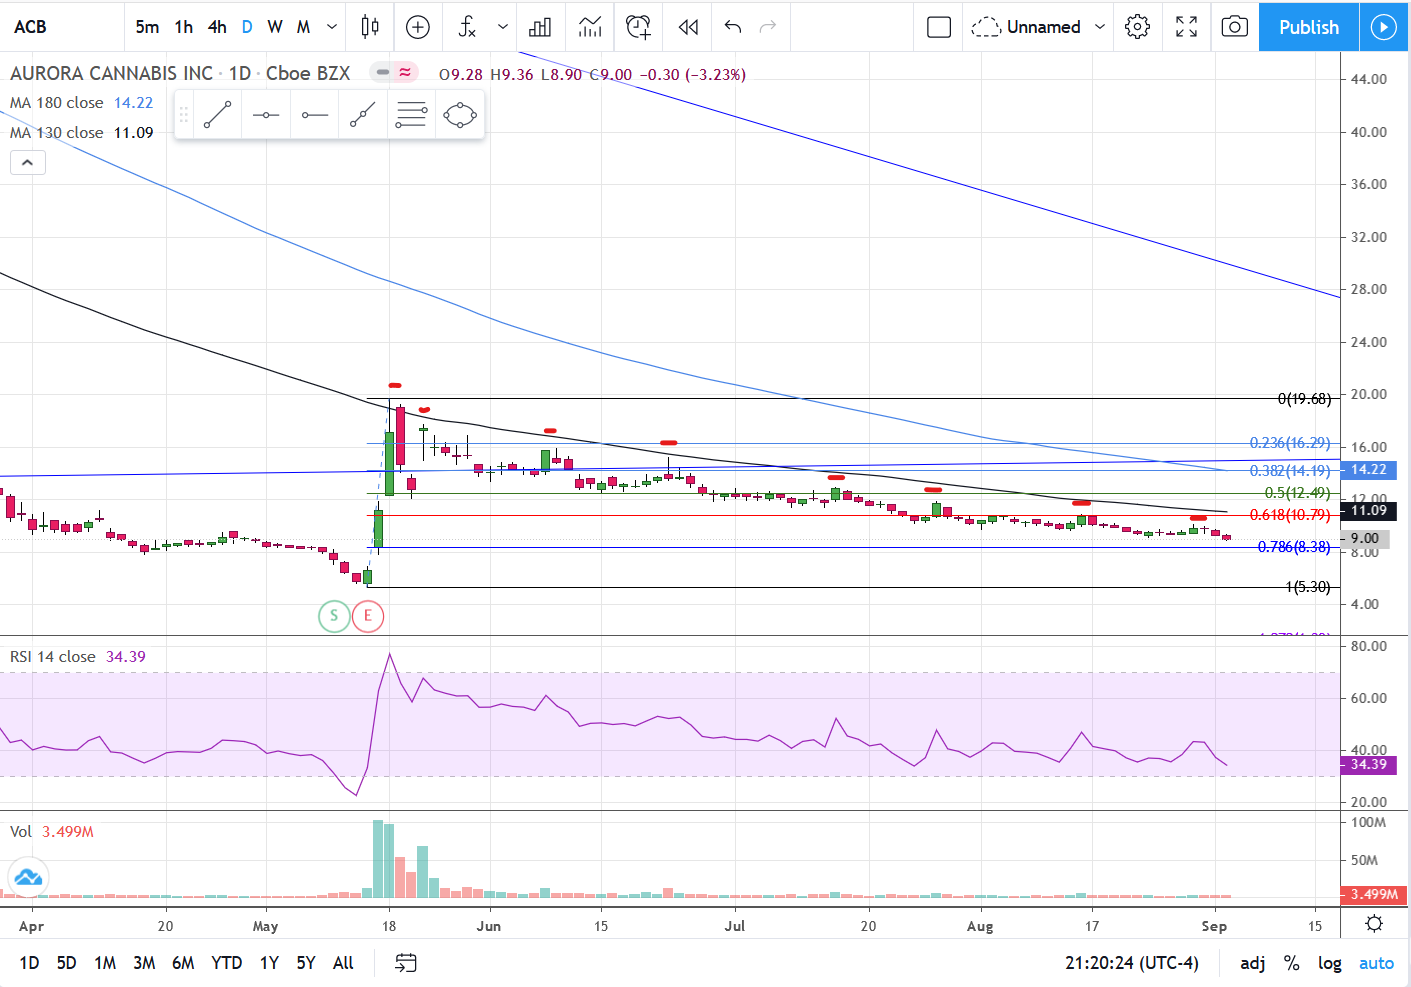
As for ACB, it has been in a long downtrend. Back in May they did a 1:12 reverse split then 3 days later the stock rallied on the day of its earnings announcement. As you can see on the chart, it ran directly to the 130 MA and has found staunch resistance there since. The stock has broken down through the 50 and 62% retracements and is heading for the 78.6 retracement level. Quite often when a stock gets to that level it ends up doing a complete retracement, or close to it. In this case back to 5.30.
If you know of fundamental reasons to be invested in this stock then go on that. Technically spreaking, there is nothing yet on this chart that would inspire me to be a buyer. As a matter of fact, if I was aware of the stock just before it had its three day run I would have shorted it once it was clear to me it wasn’t moving through the 130 MA. Anyone who did this has enjoyed 8 cycles of lower highs and lower lows thus far, with no threat whatsoever of having to cover the short. If I were looking to get long here that’s all I would be doing at this point… looking.
1 Like
Any of you guys familiar with the CEO.CA investor site, I started a channel there where I’ll post charts as well. Sometimes I’ll post on both, but in case I’m in a hurry and don’t here’s the link to the channel…
I just got done posting a DGMLF chart on that link, for those interested.
I posted your BBBXF chart on CEO.CA | ~charts by louie Richard. Couldn’t sleep. 
TR,
That guy Louie is back posting amazing charts and commentary! 
Missing your charts here lately.
I’d appreciate one on FSM, and also EXK. Getting interesting on many of these PM plays. I took some profits on these today, but hold core positions.
TIA,
EZ
Hiya. I don’t have a lot of time these days. I literally feel like a guy with a wife and two twenty-something kids and a younger brother, even though I’m not married, never spawned a fry, and my actual younger brother died 7 years ago. It’s like I woke up one day and all these people were here! Anyway, part of the reason I haven’t been posting much is because my eyesight is improving. That is a good thing… the result of 4 different juice “fasts” I have done this year, but I can’t yet see fully without glasses, and I don’t see as well with them and my eyes ache when I look at my screens for long…not to mention my body from all the contorting I’m doing in order to get a clear view. So, expect less posting from me until my vision is completely restored, but I will work on the two you mentioned. 
Rich,
Best wishes for being restored back to perfect eyesight and health. Relax more and get some rest. Charts can take a break for as long as needed, but maybe add ASM to the list. 
Too many charts have gone “en Fuego”! 
1 Like