I spent a few hours this morning working on the following for another forum and thought I’d share it here. Just speculating…
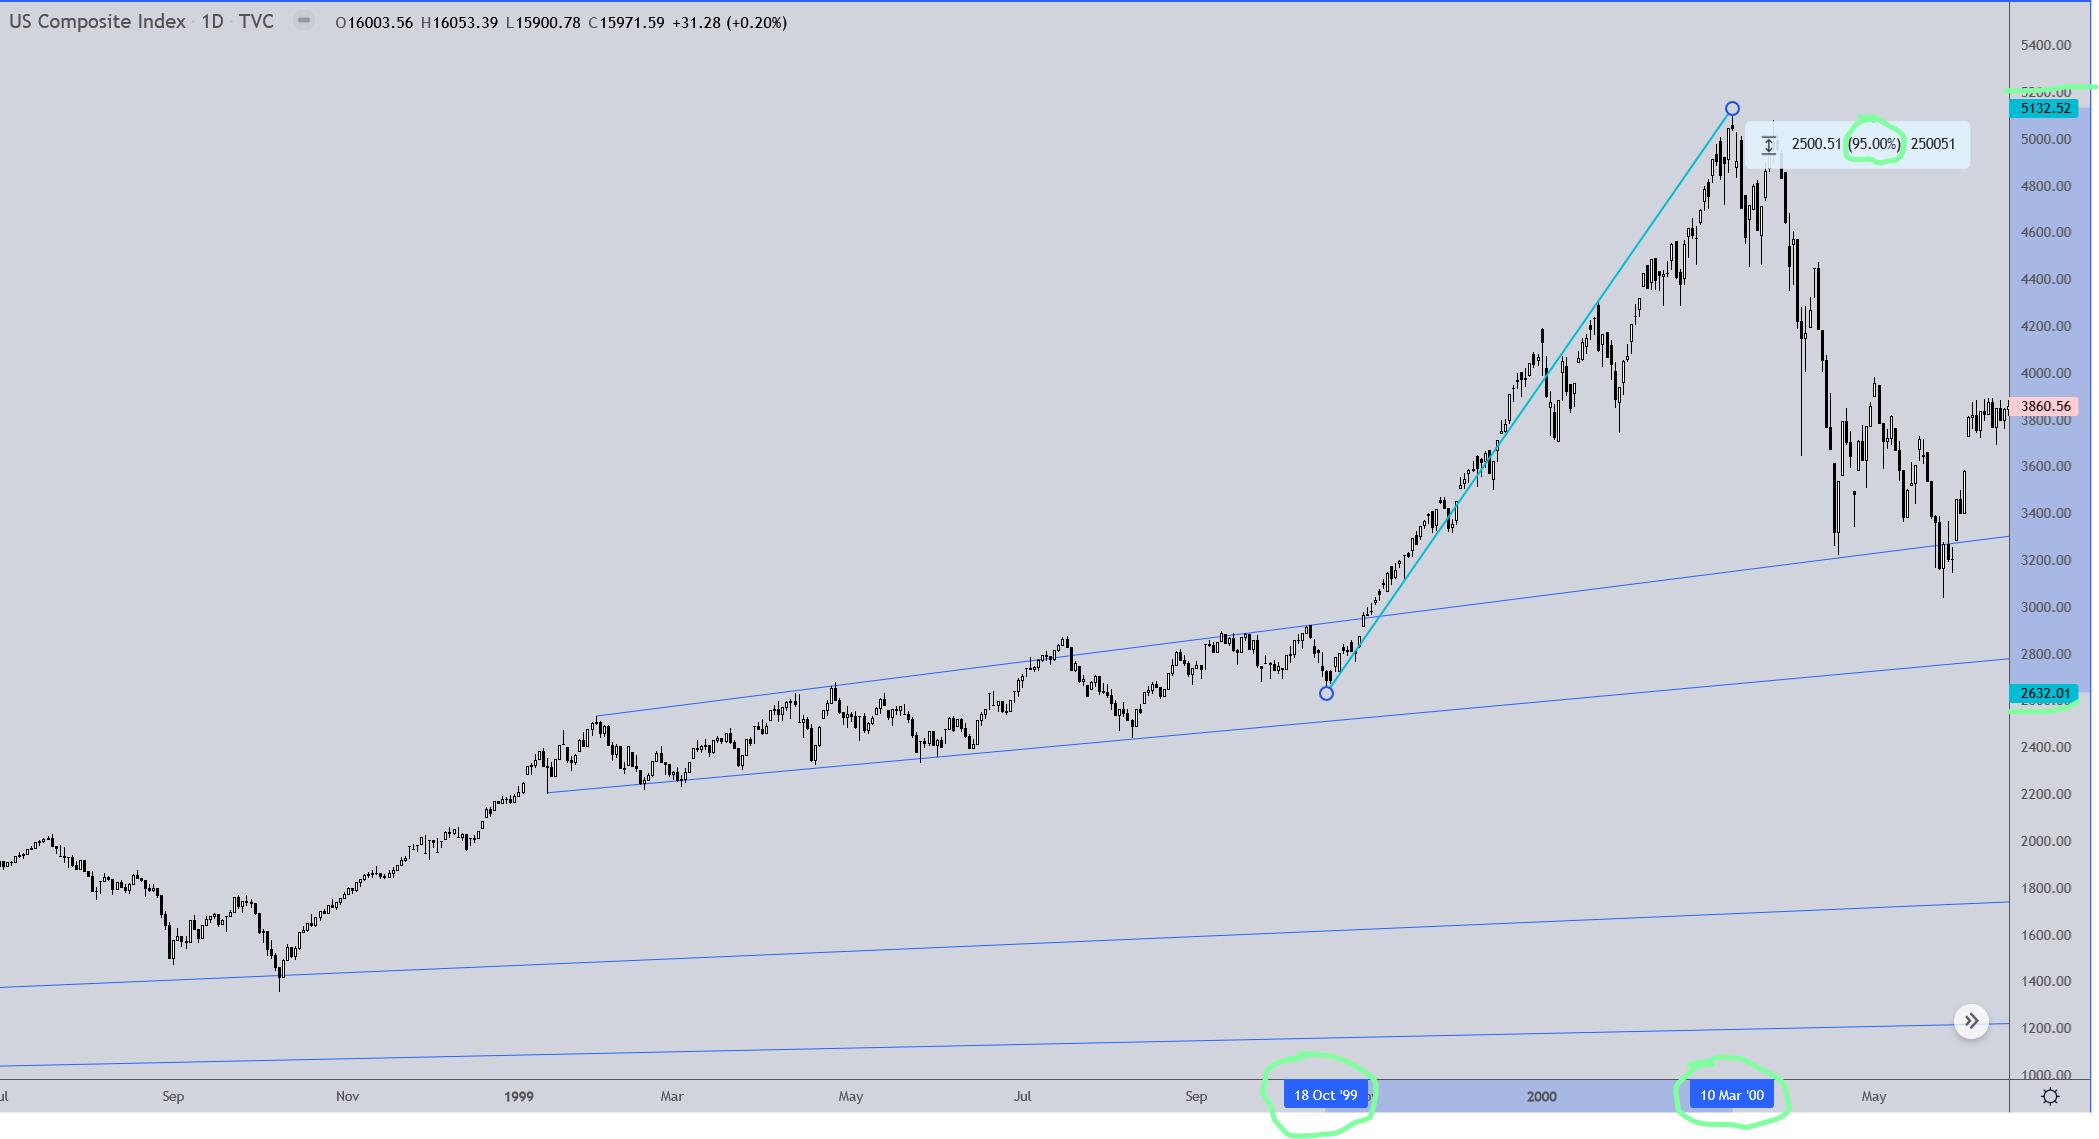
This is a daily interval chart of the 2000 bull market. It began in early October after a bottoming of a three month decline. The initial move was strong and steady with very mild pullbacks into early '99. Then, starting in January, the market went into a mildly upward sloping consolidation phase until Oct '99. From there the market launched, almost doubling over the course of 5 months…and then losing the majority of those gains over the next 3 months. I only started my trading career just after the peak in April 2000. (What a miserable time to begin investing, with no experience and not a clue about what the markets are really about… but then pain can be a great teacher! lol)
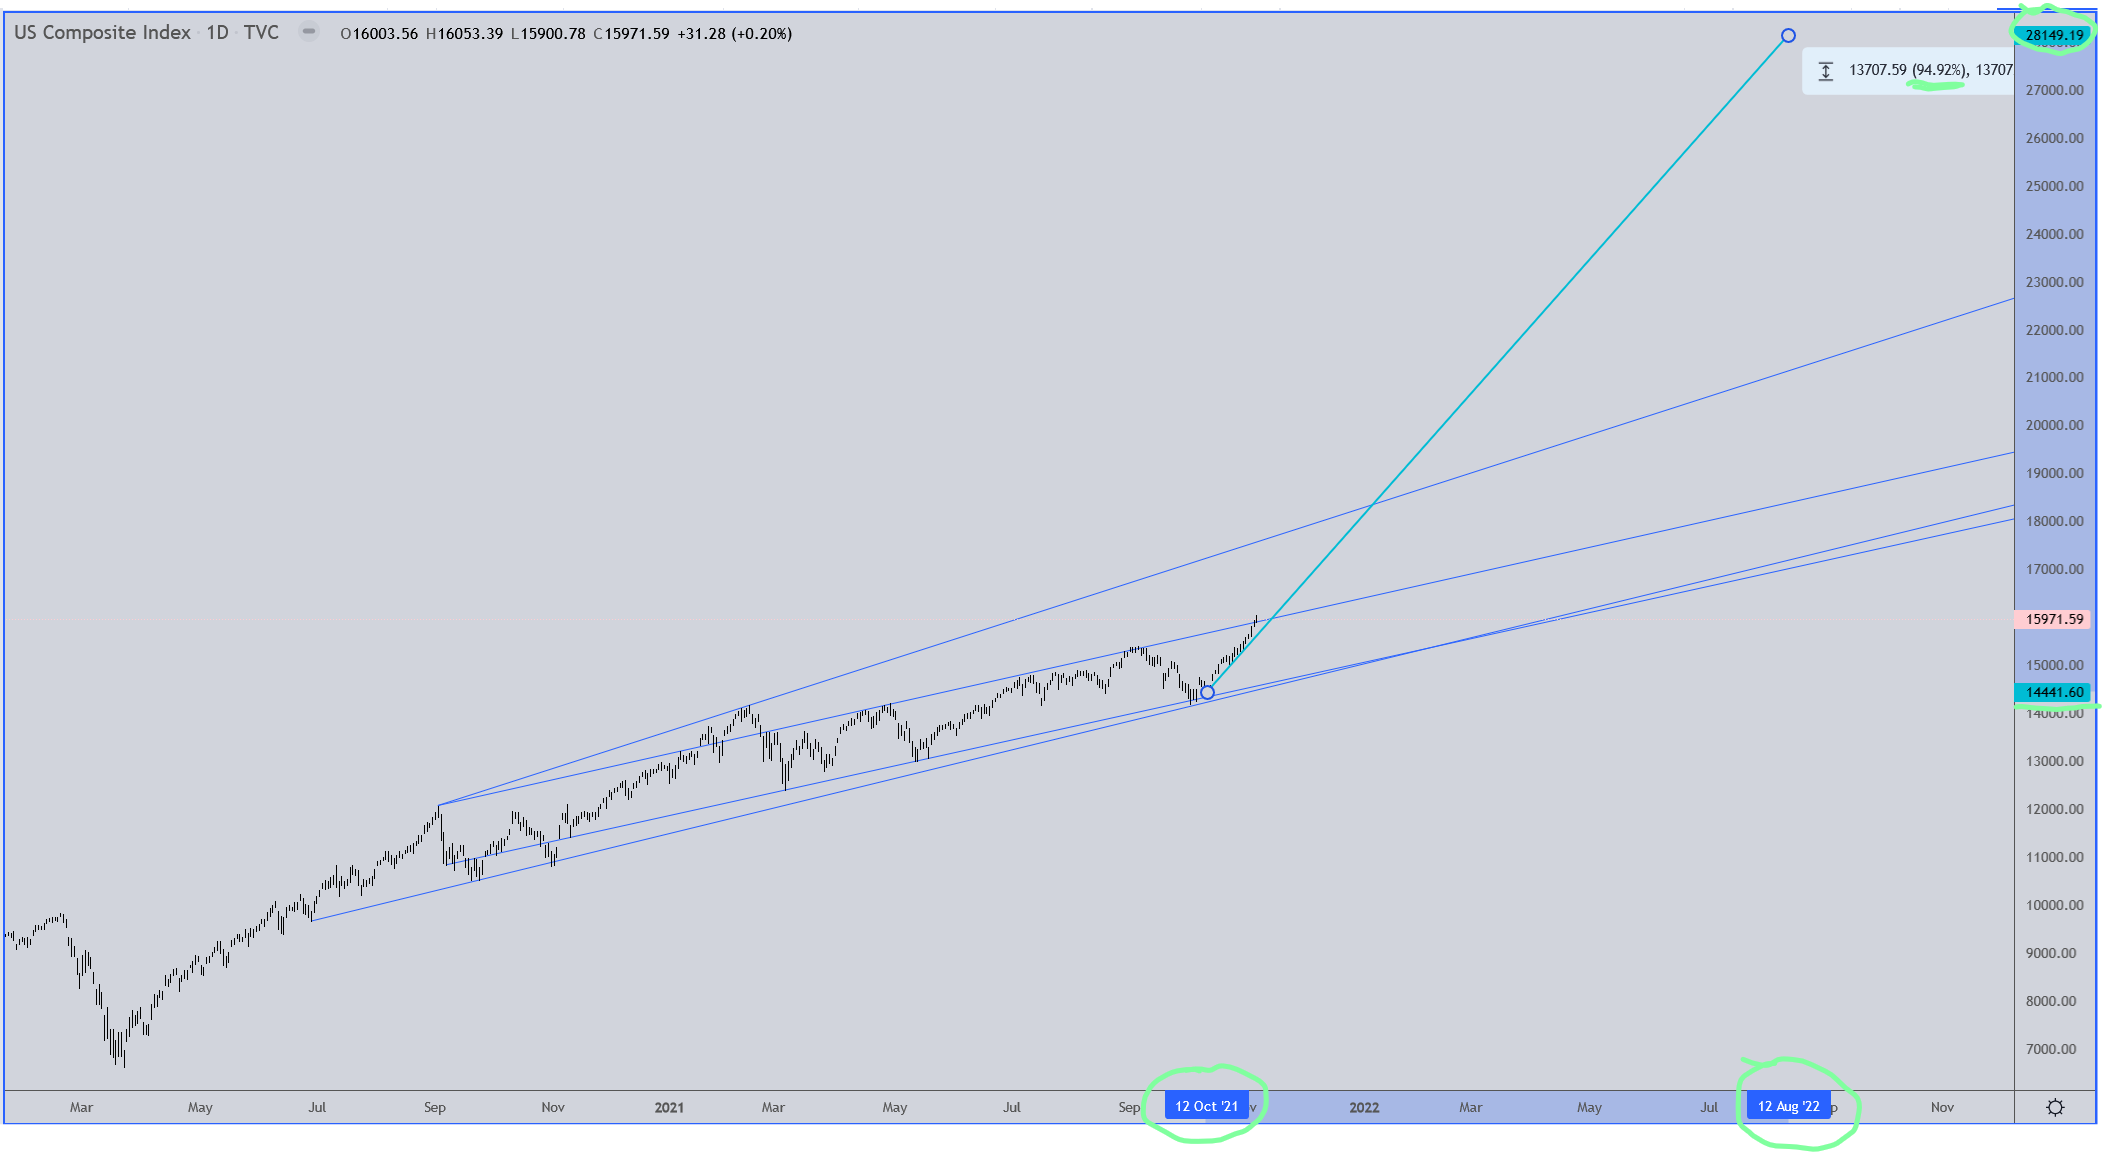
Now, let’s say that history ends up repeating… The end of the plandem… I mean balognavir…I mean covid panic apparently started ending in March… because the markets say so. From there the markets have had a strong, steady uptrend with very minor pullbacks up until September, where it could be said the markets entered a more gently upward sloping consolidation phase. Now we may still be in that consolidation phase, or we may have just begun the launch into a new bubble, the likes of which… IF history repeats on this occasion… could blow all our minds into the middle of next year with the COMP ending somewhere around 28,000… give or take a few thousand points. OR this could all end up being pointless blather if we wake up tomorrow morning with the COMP opening at 8000. Clearly I have no idea, but it might be wise to consider the possibilities. The Fed has “printed” a crapload of funnymunny which is the acutal definition of inflation, so markets going to those highs would be a logical representation of such. Having stated that, I am no economist. I am but a simpleton with a simple mind that has absolutely no desire to comprehend the complexity of all the nonsense the powers that be create to blind and confuse the masses.
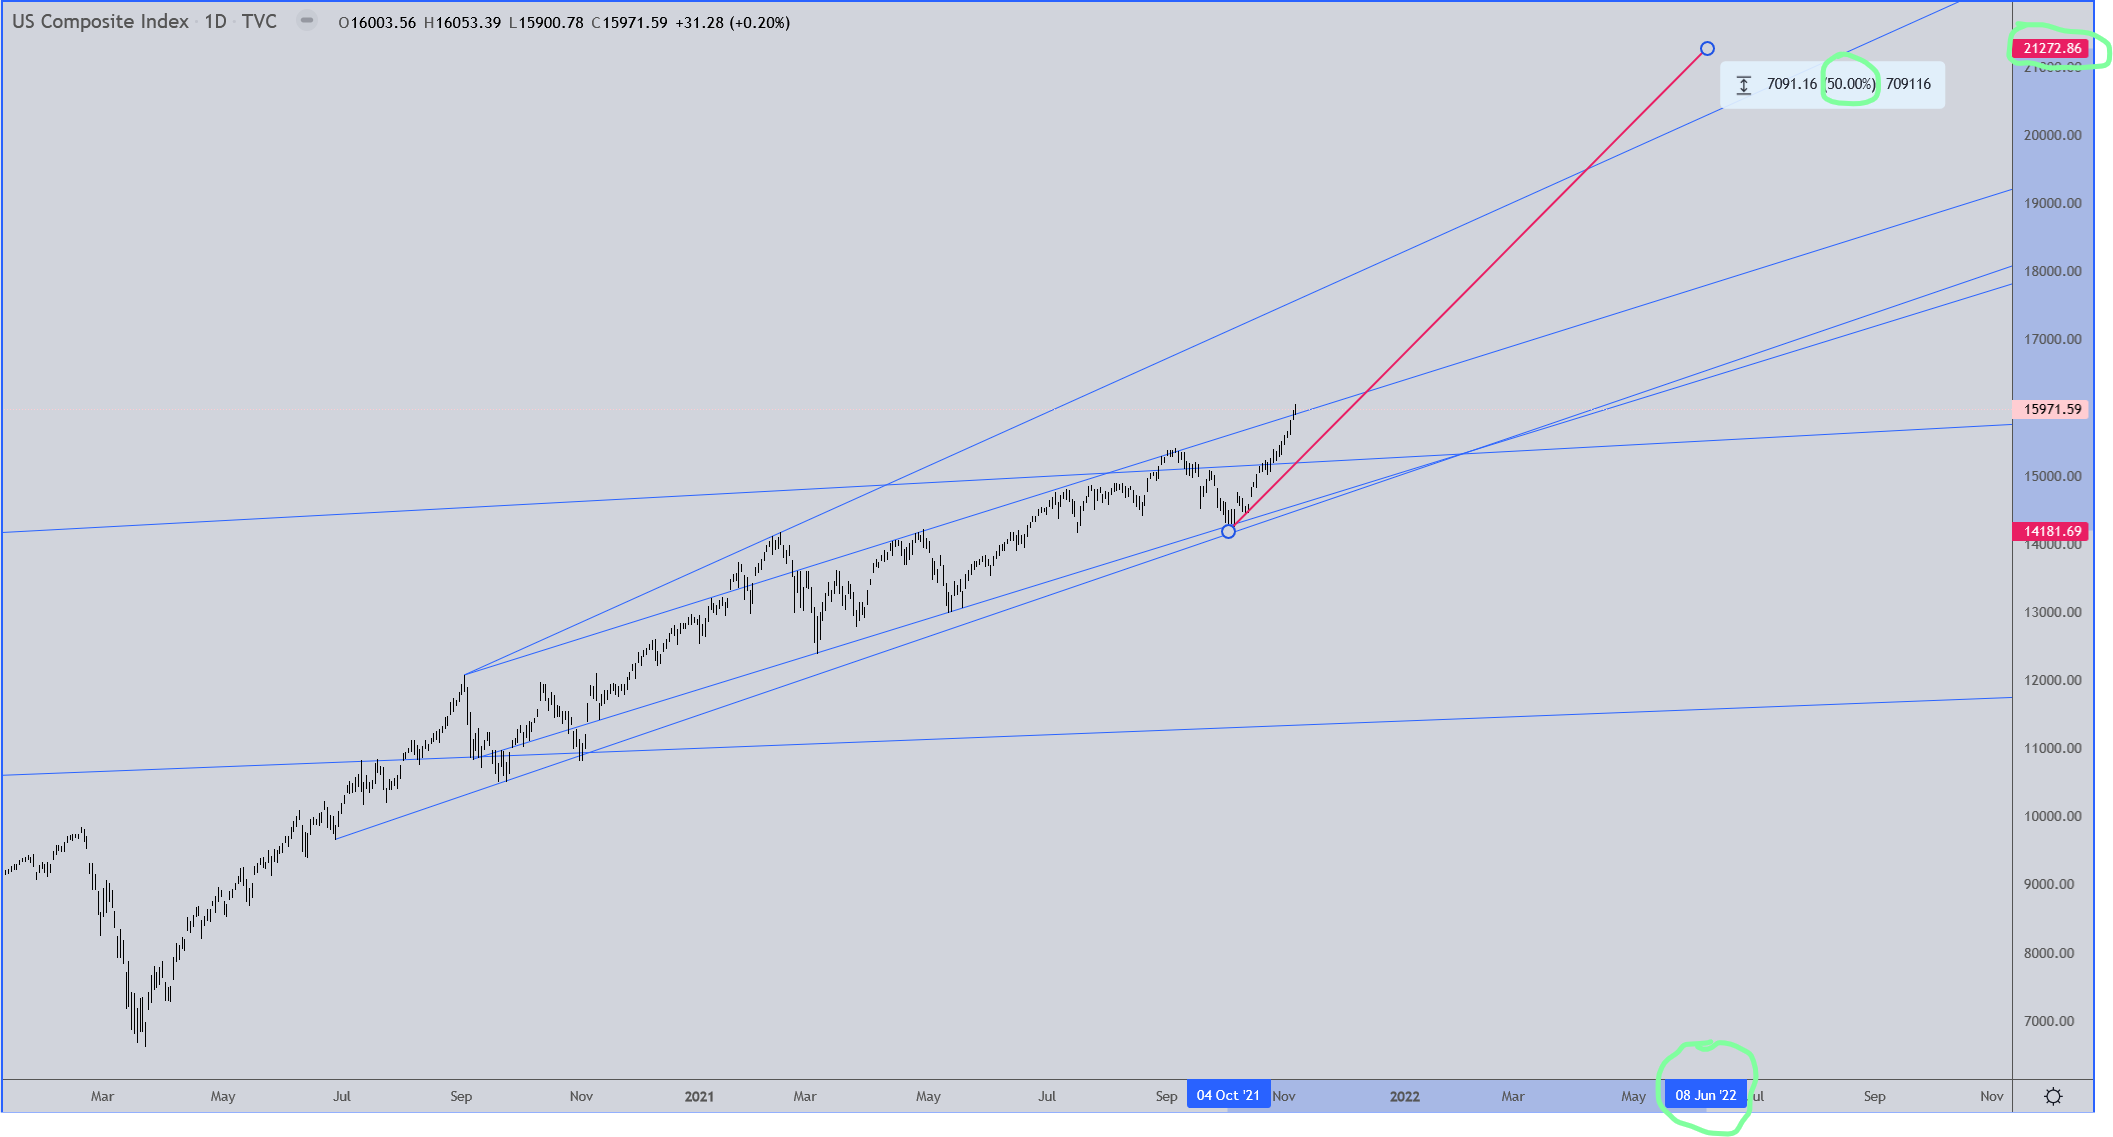
Oh, and let’s say instead of 95% the markets are just too lazy this time around and only go half way to 100%. That could still get us to COMP 21,000 and change by next summer as a very general guesstimate.
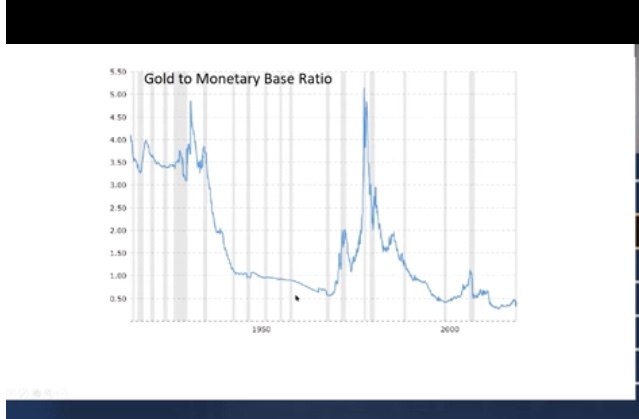
Thanks Rich! Your post exactly reflects my sentiments for the upcoming next couple of years. That also really fits into a very recent video clip I viewed that really covers the short and long prospects for a number of market commodities, all based in gold as a relative reference. What really got me was this chart:
The chart above is from my having viewed this rather intriguing video that has a thesis supporting some of the astronomical future valuations of a number of commodities and the “melt-up” in the COMP. I’ll also attach the Time Stamp references to the clip following the graph.
Time Stamp References:
0:00 – Introduction
2:10 – Metal Swap Levels
6:00 – Wealth Measuring
7:45 – Housing Market Phases
16:04 – Business Cycle & Housing
18:30 – A Commodity Bull Market
21:17 – Interest Rates & Dollar
22:54 – Energy Crisis
24:32 – Buying Commodity Equities
26:30 – New Investors & Commodities
28:08 – Uranium & Valuations
30:10 – Volume & Charting
33:10 – A Uranium Squeeze
35:48 – Gold/Silver Trends
37:18 – Rates & Metals
38:27 – Leverage To Commodities
40:26 – Royalty Companies
41:36 – Mining Sector Outlook
44:43 – Investing in Energy
46:00 – Taking Profits
48:30 – Bitcoin Outlook
52:30 – Wrap Up
Talking Points From This Episode
– Outperforming the stock market with precious metal ratio trading.
– Housing markets as a catalyst for the commodity complex.
– The energy crisis and why he expects a massive commodity squeeze.
I posted the above clip in case anyone else may be interested in considering it wise to ponder the possibilities.
Again, reflecting on the past, my investing/trading experience mirrors yours in many respects. It was an exciting, but truly miserable time to start investing that I still manage to keep learning from. I’m branching out into some of the other commodities suggested in this video clip because Andy has a rather unique trading thesis that appears quite valid to anyone with a rather long-range investing horizon. It’s not the only trading strategy I’ll use, as much of it is just played on the fly for some of the events that effect specific plays and other events that effect the general market. TA is emphasized as an important part of that strategy. Again Rich, thanks for posting your analysis and thoughts for where we are at in the gold bull market and where it could go based on TA in the next few years.
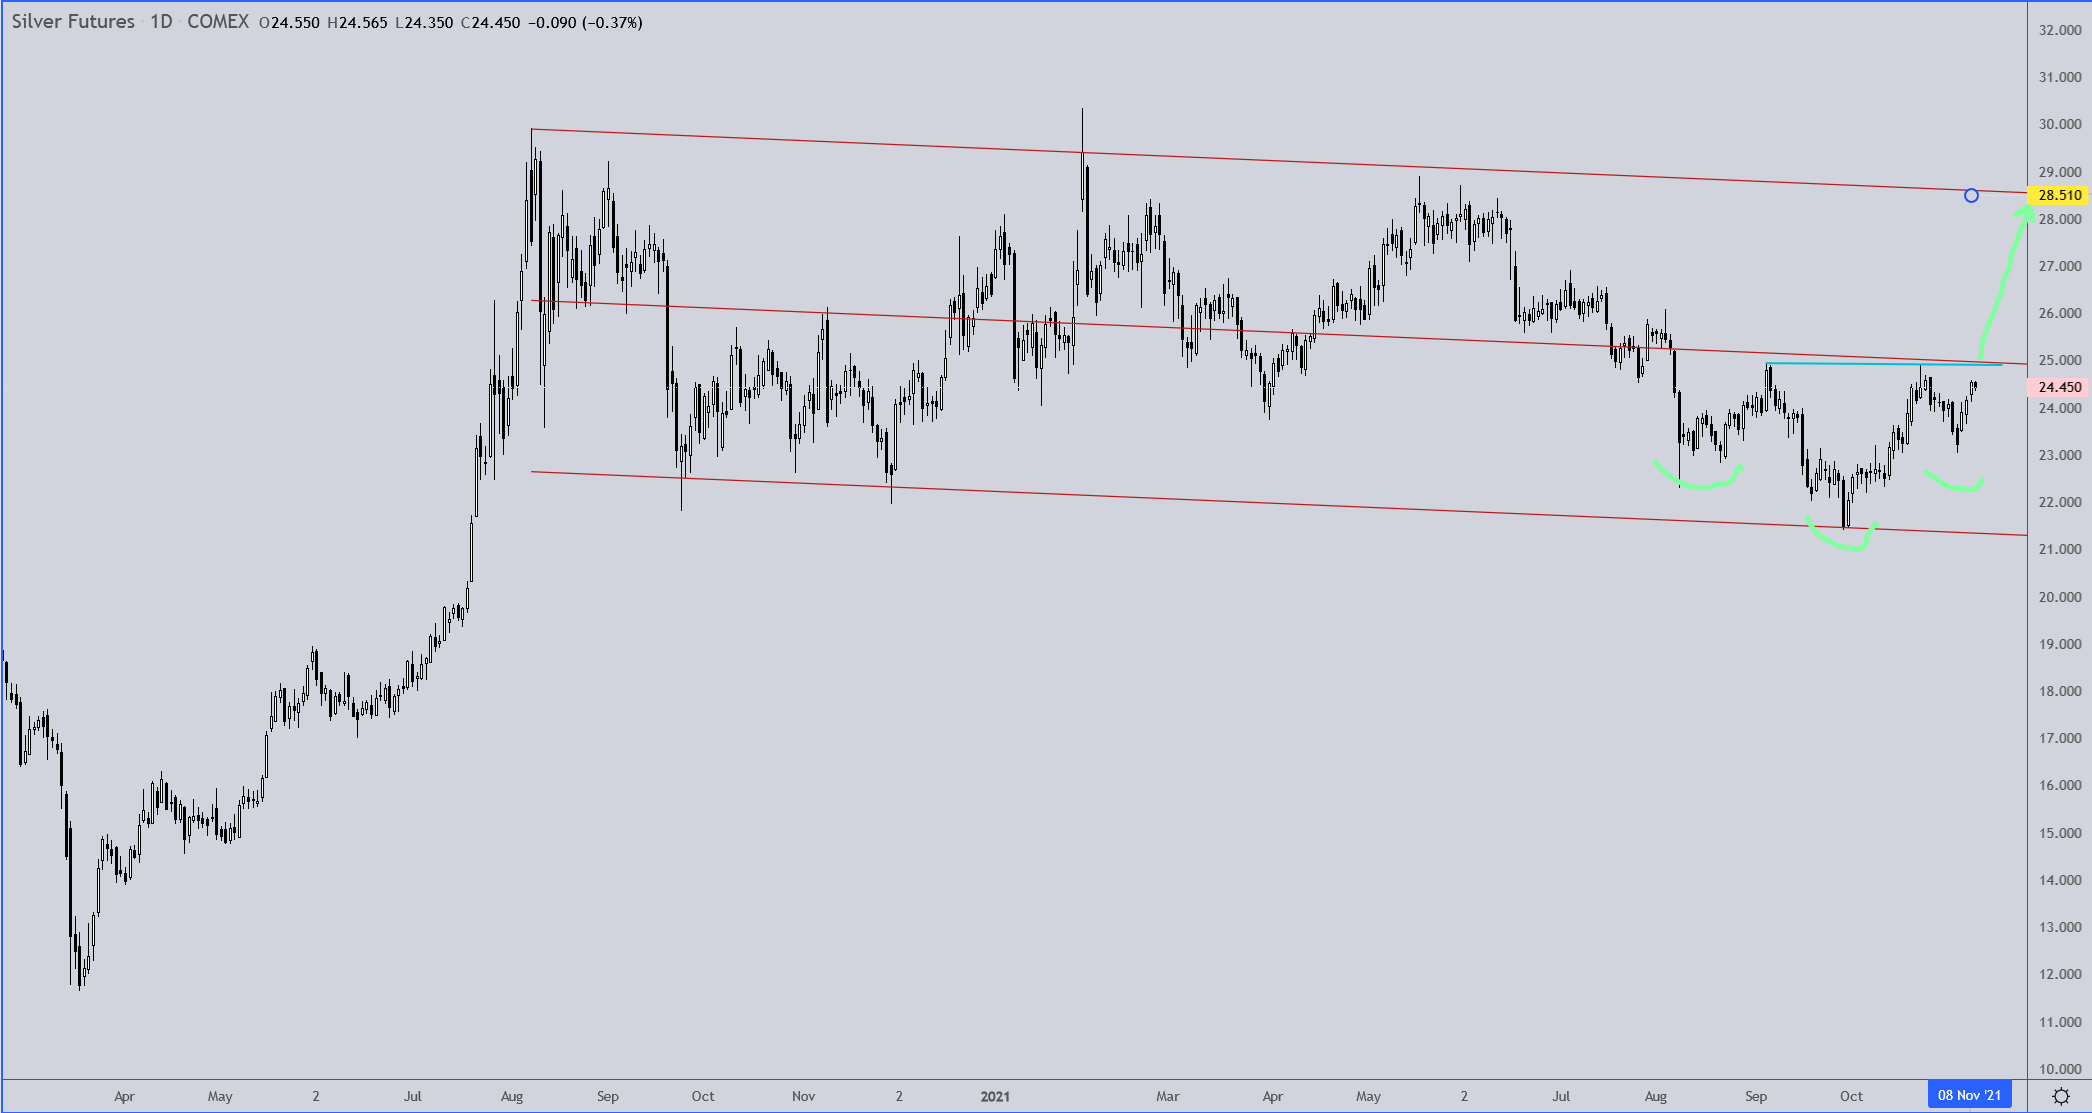
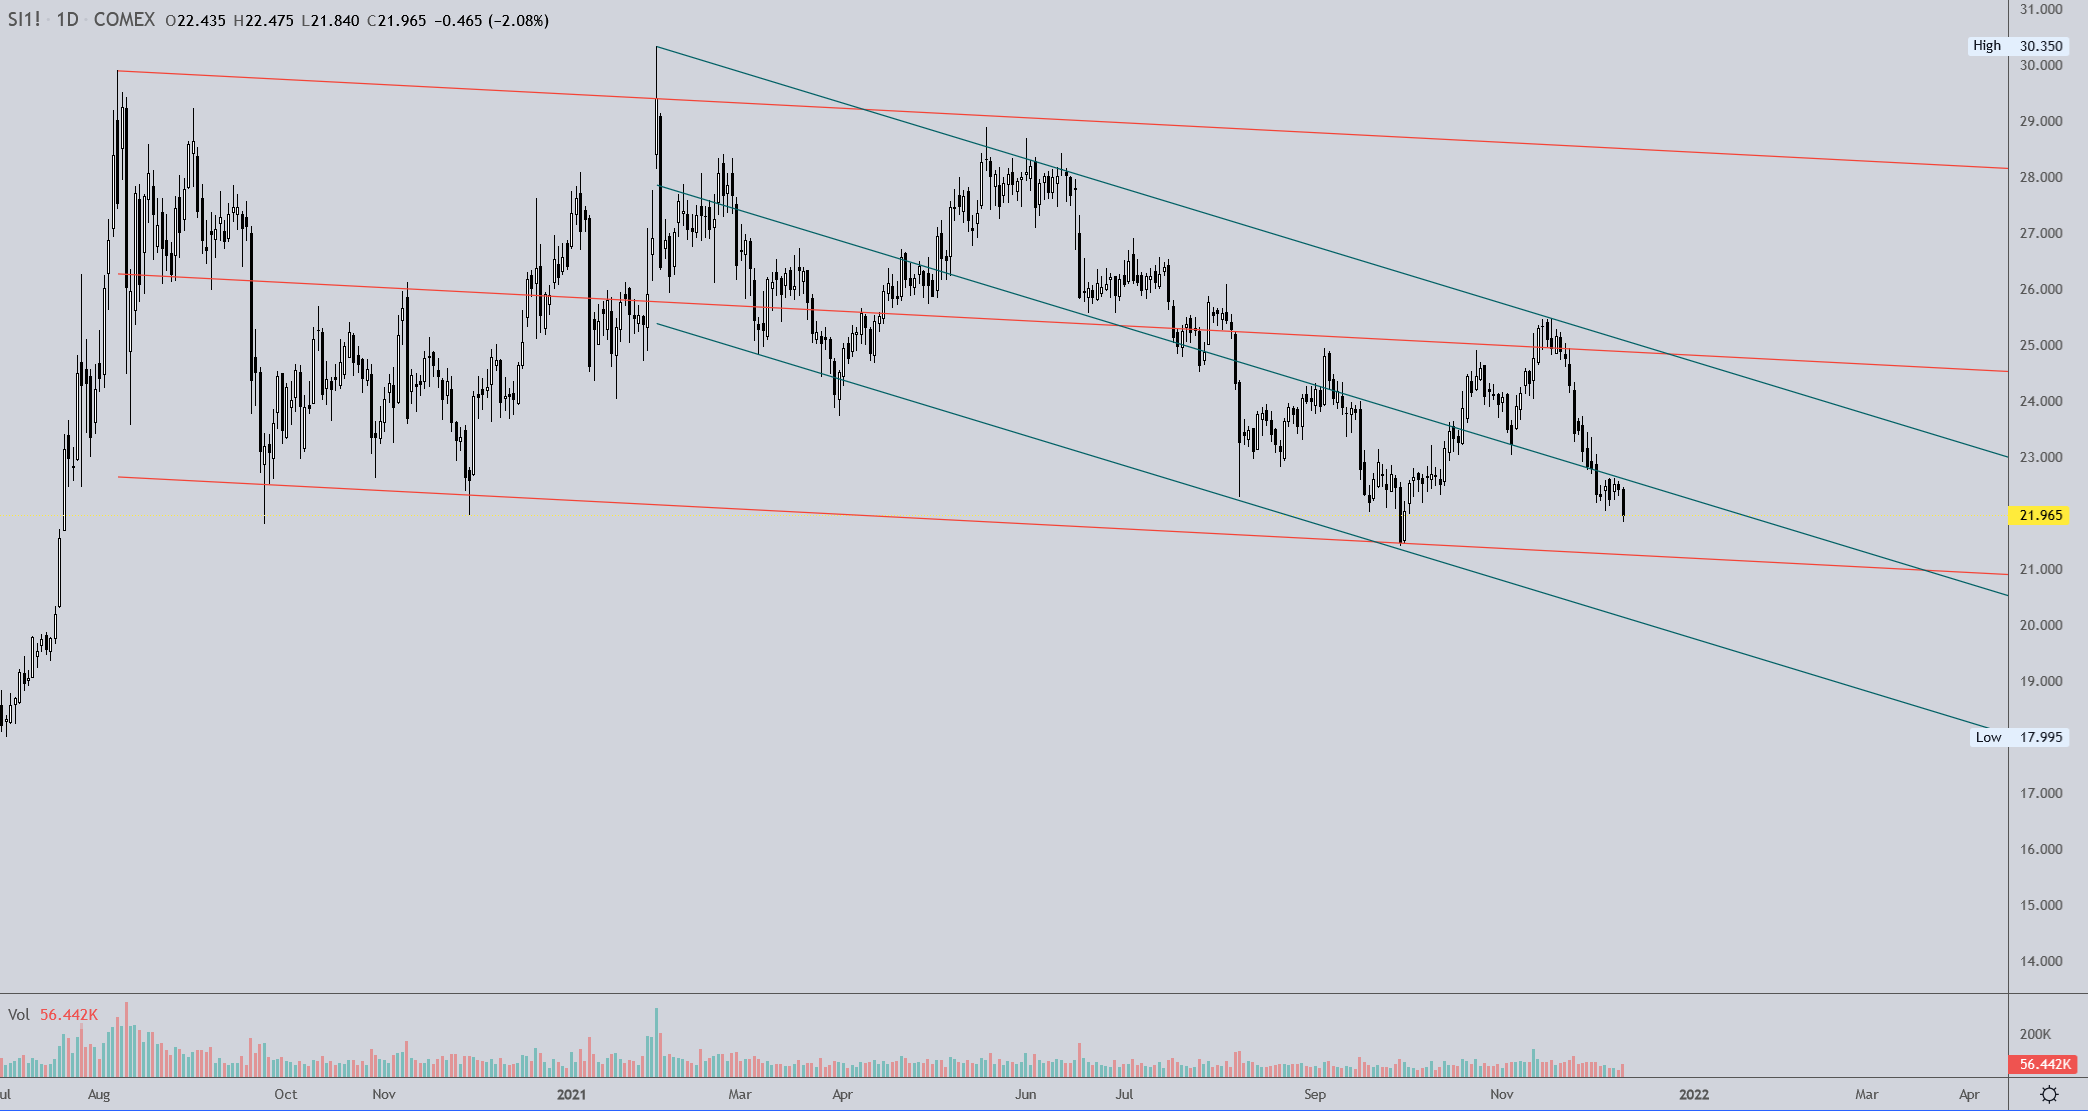
Since it’s spring rise from just under $12, silver has maintained support above the 50% retracement level of that rise and has since been consolidating between $21 and $29. Since August an inverted head and shoulders has developed and, if the formation proves true, is likely within a week or two of a breakout and potential measured move to the top of the channel at around $28.51. Caution is advised though as people more attuned to the silver and gold markets than I are saying that gold is ready for its next down leg. Whether that is the case and if silver will follow are questions I certainly do not have answers to.
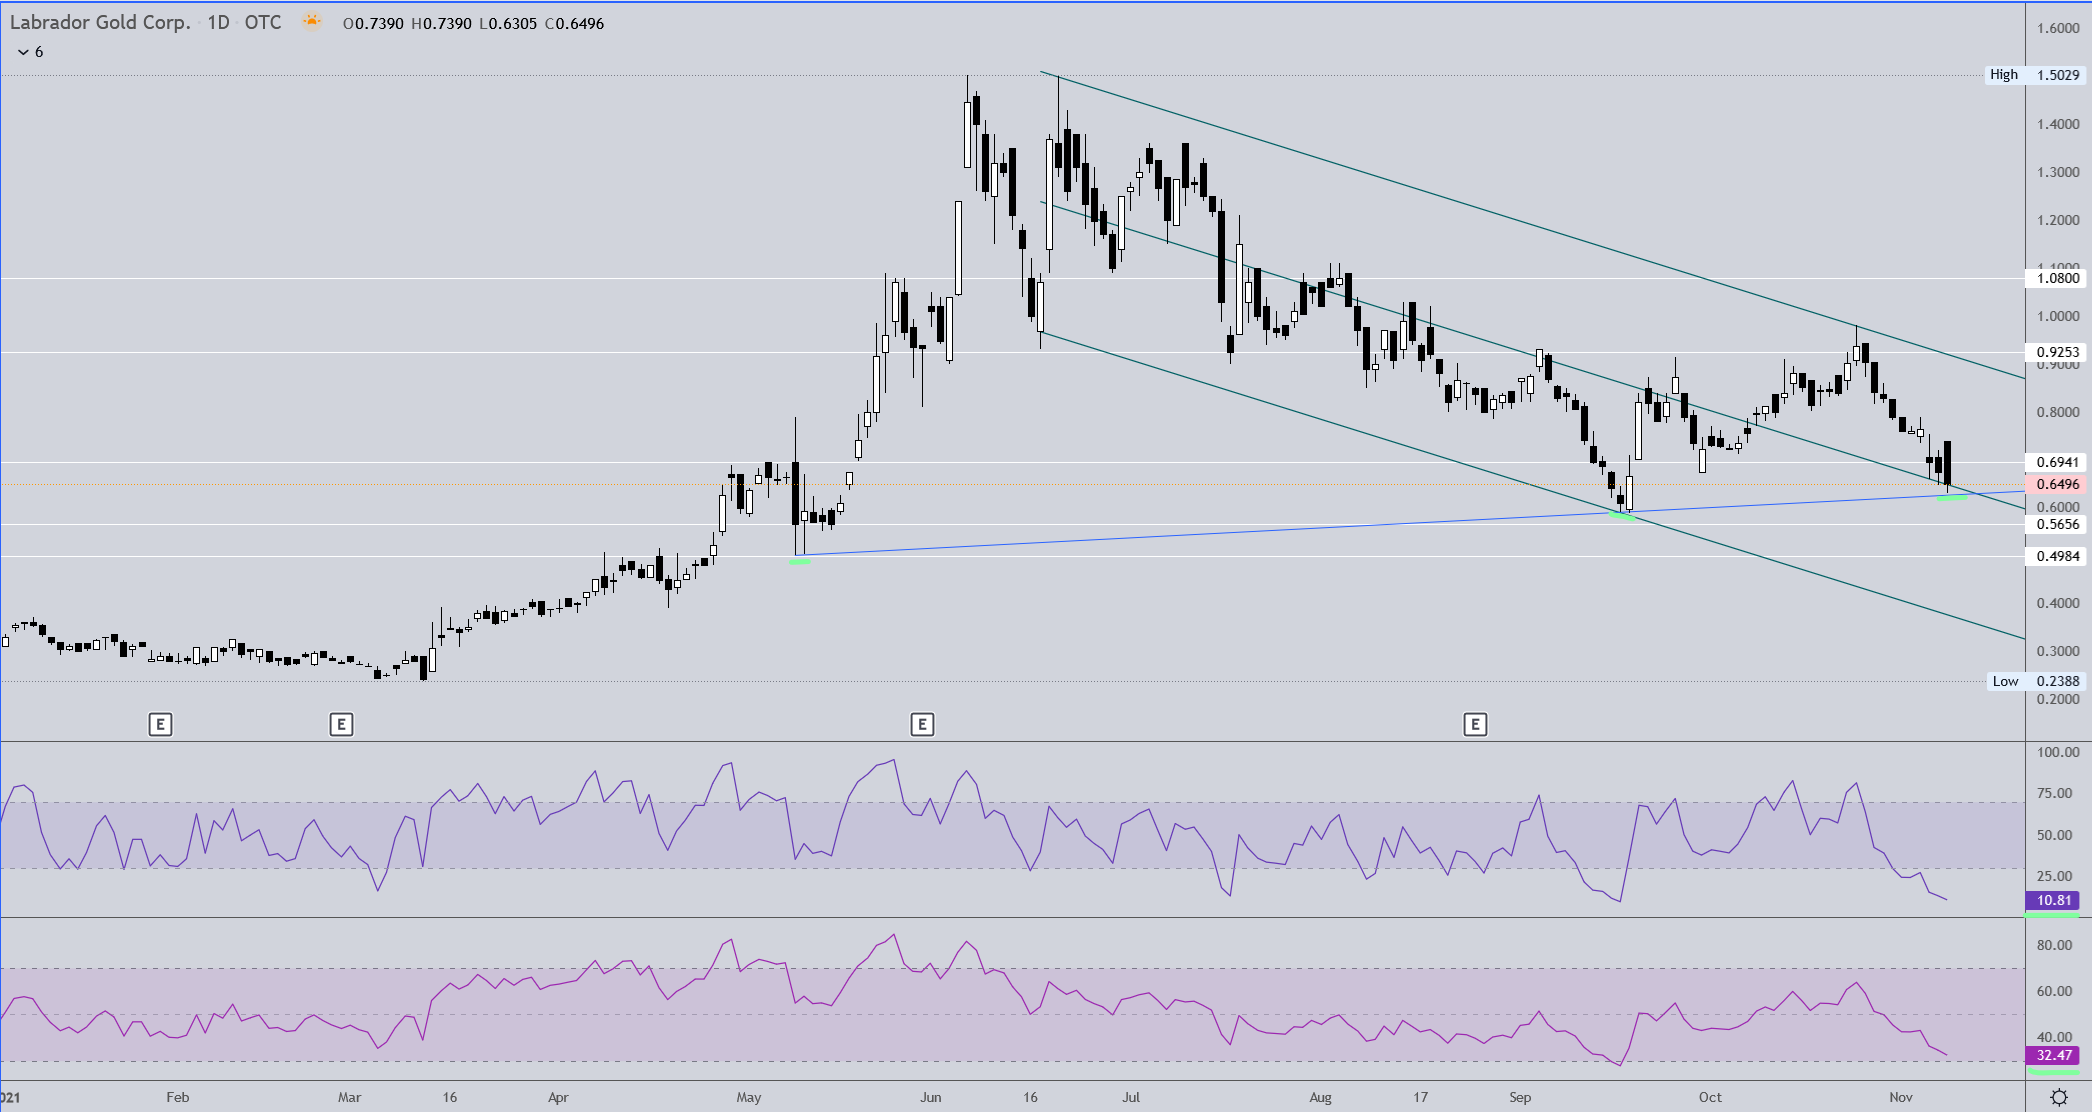
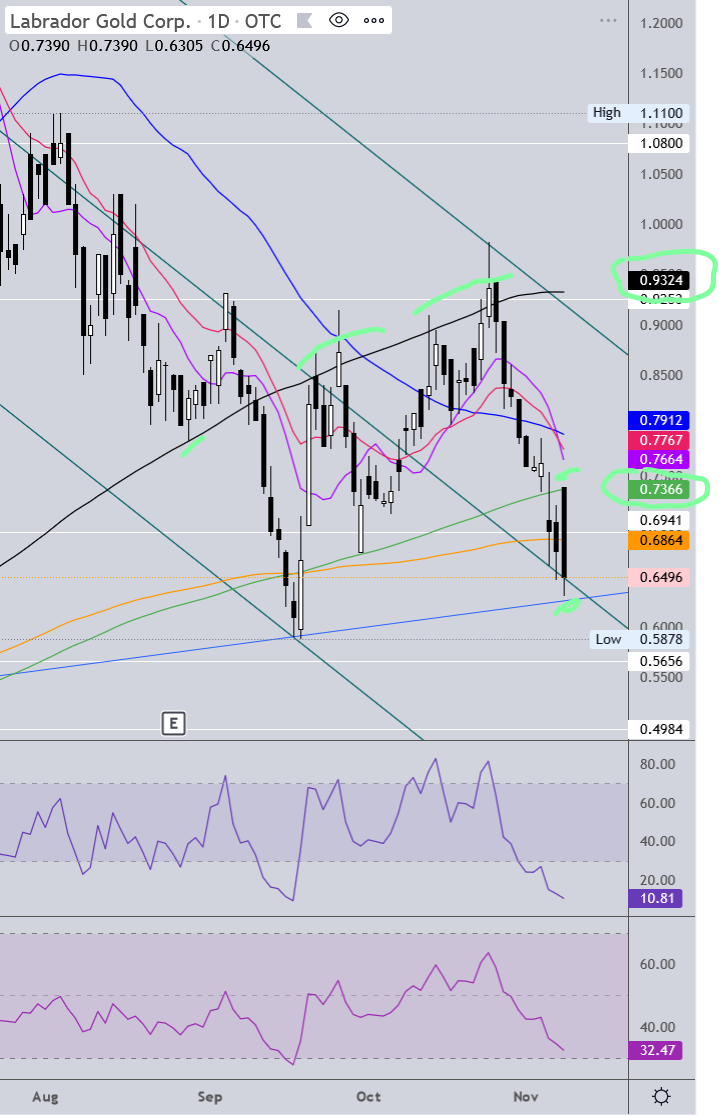
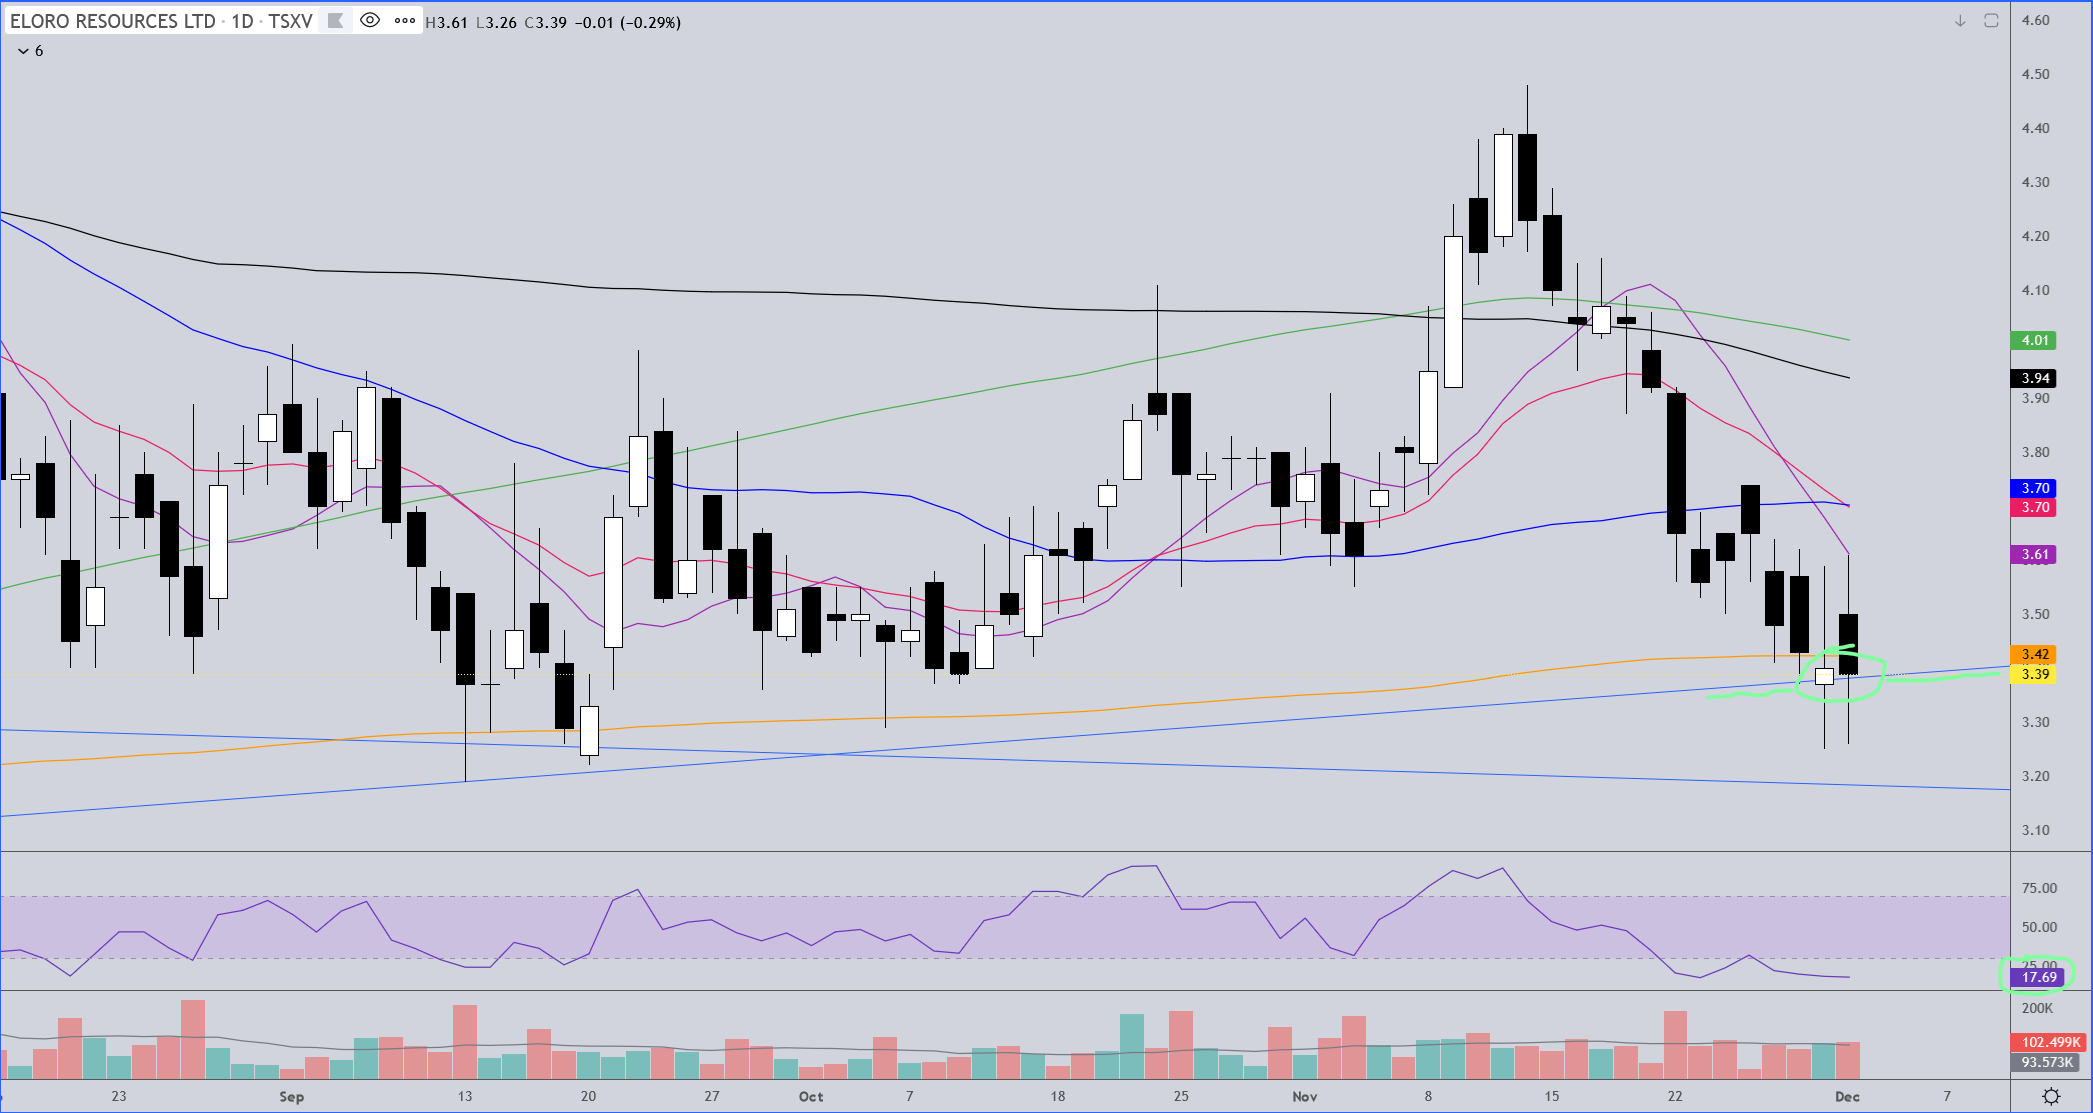
This is a daily with horizontal S/R, blue uptrend line (to be determined presently), and a downward sloping channel. What you’ve got going for you is that the RSI is very oversold while the price is testing that potential uptrend line and the center channel line. You’ve either caught a bottom or you’re about to get some cheaper shares. I’d keep an eye on .565, .498 and that lower channel line that’s hitting around the upper .30’s today but if tested in the next week or two will be in the lower .30’s.
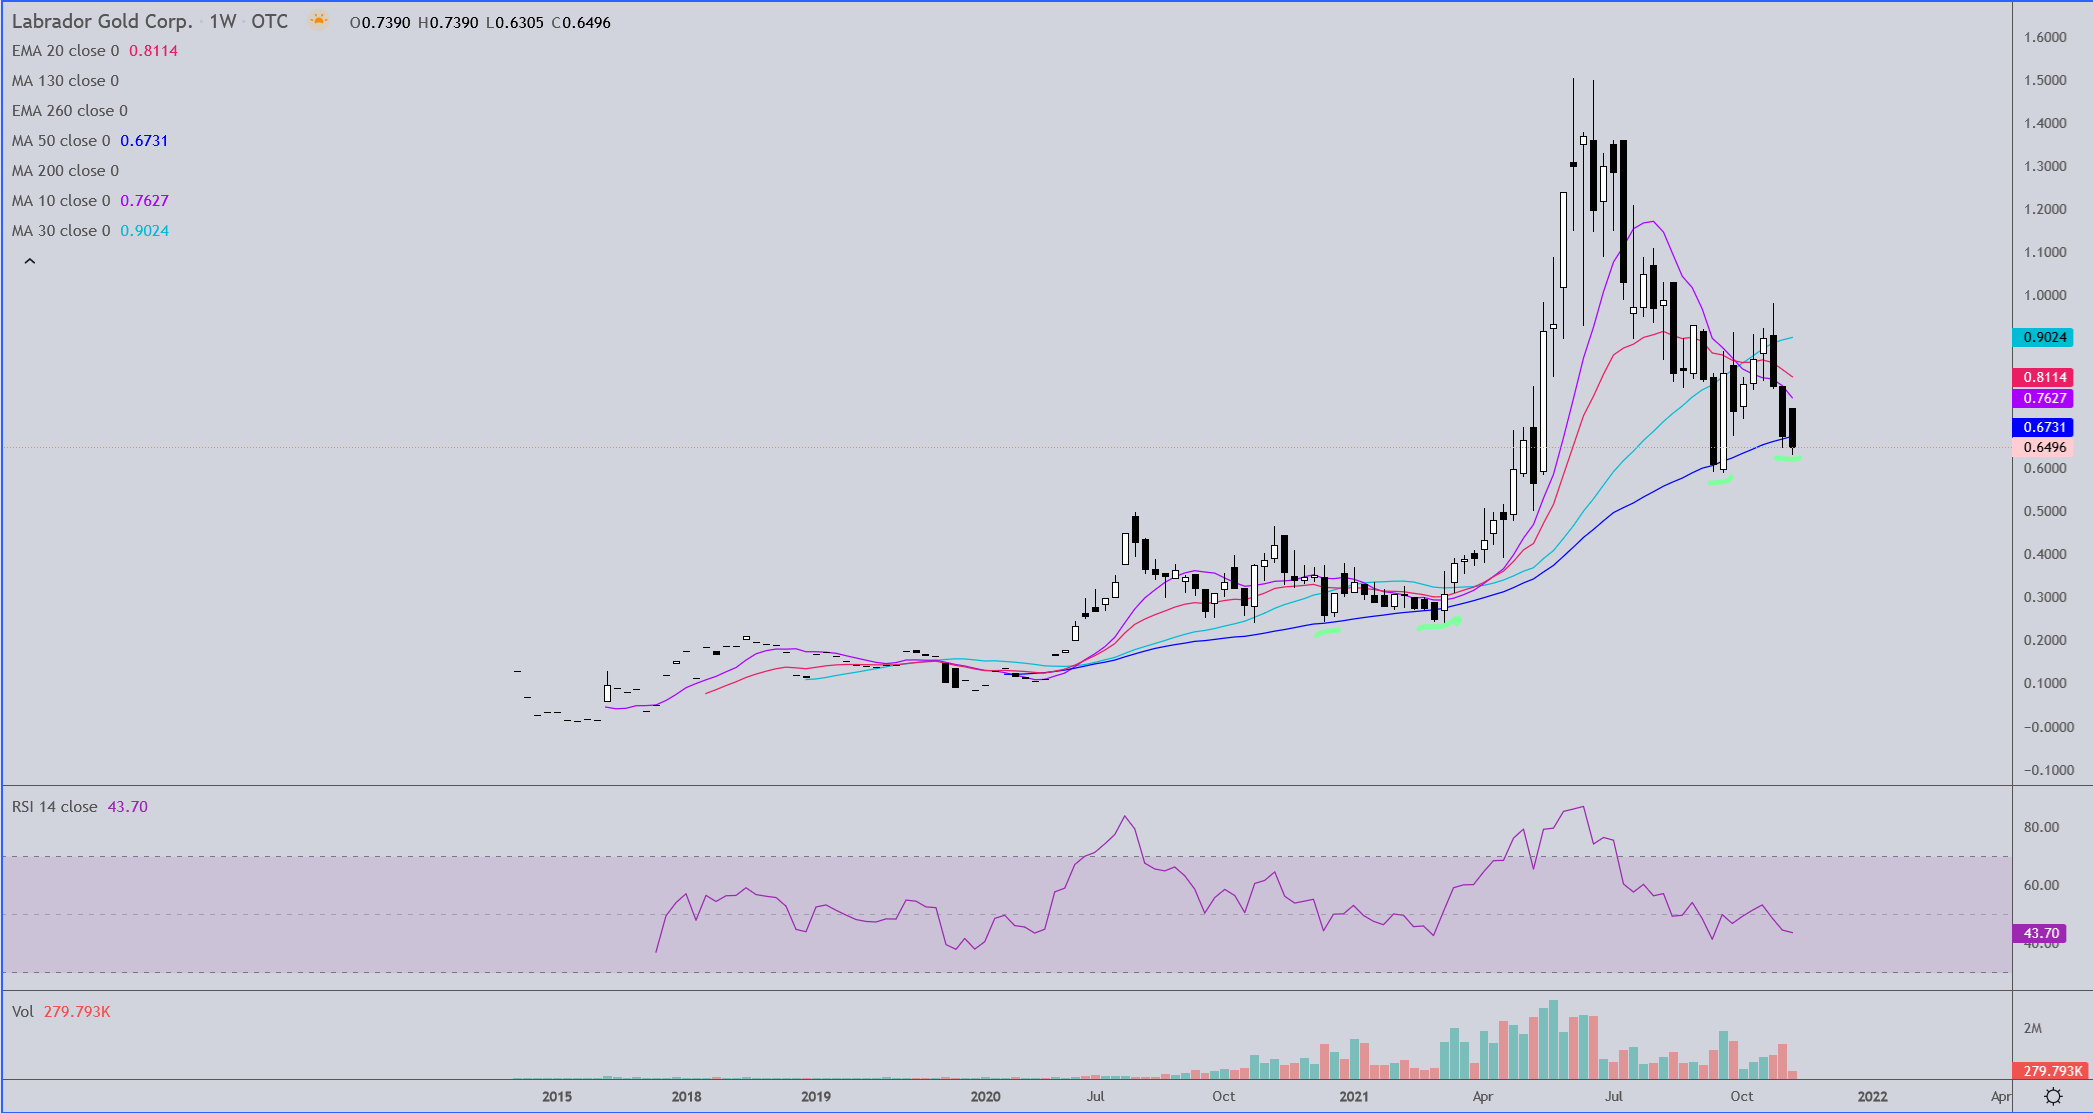
The weekly chart is showing support has thus far held at the 50 MA. I would want to see the price above .6731 by the close on Friday to keep that trend going.
Here’s a messy closeup of the daily. Note the recent consistent resistance found at the black 130MA. Also, for three days now the stock has closed below the 200MA.
I know you’re a long term cap gains guy and so not in this for a quickie. That’s good because my opinion is that you’re likely to have opportunities to average down here, and perhaps for more than a brief period of time.
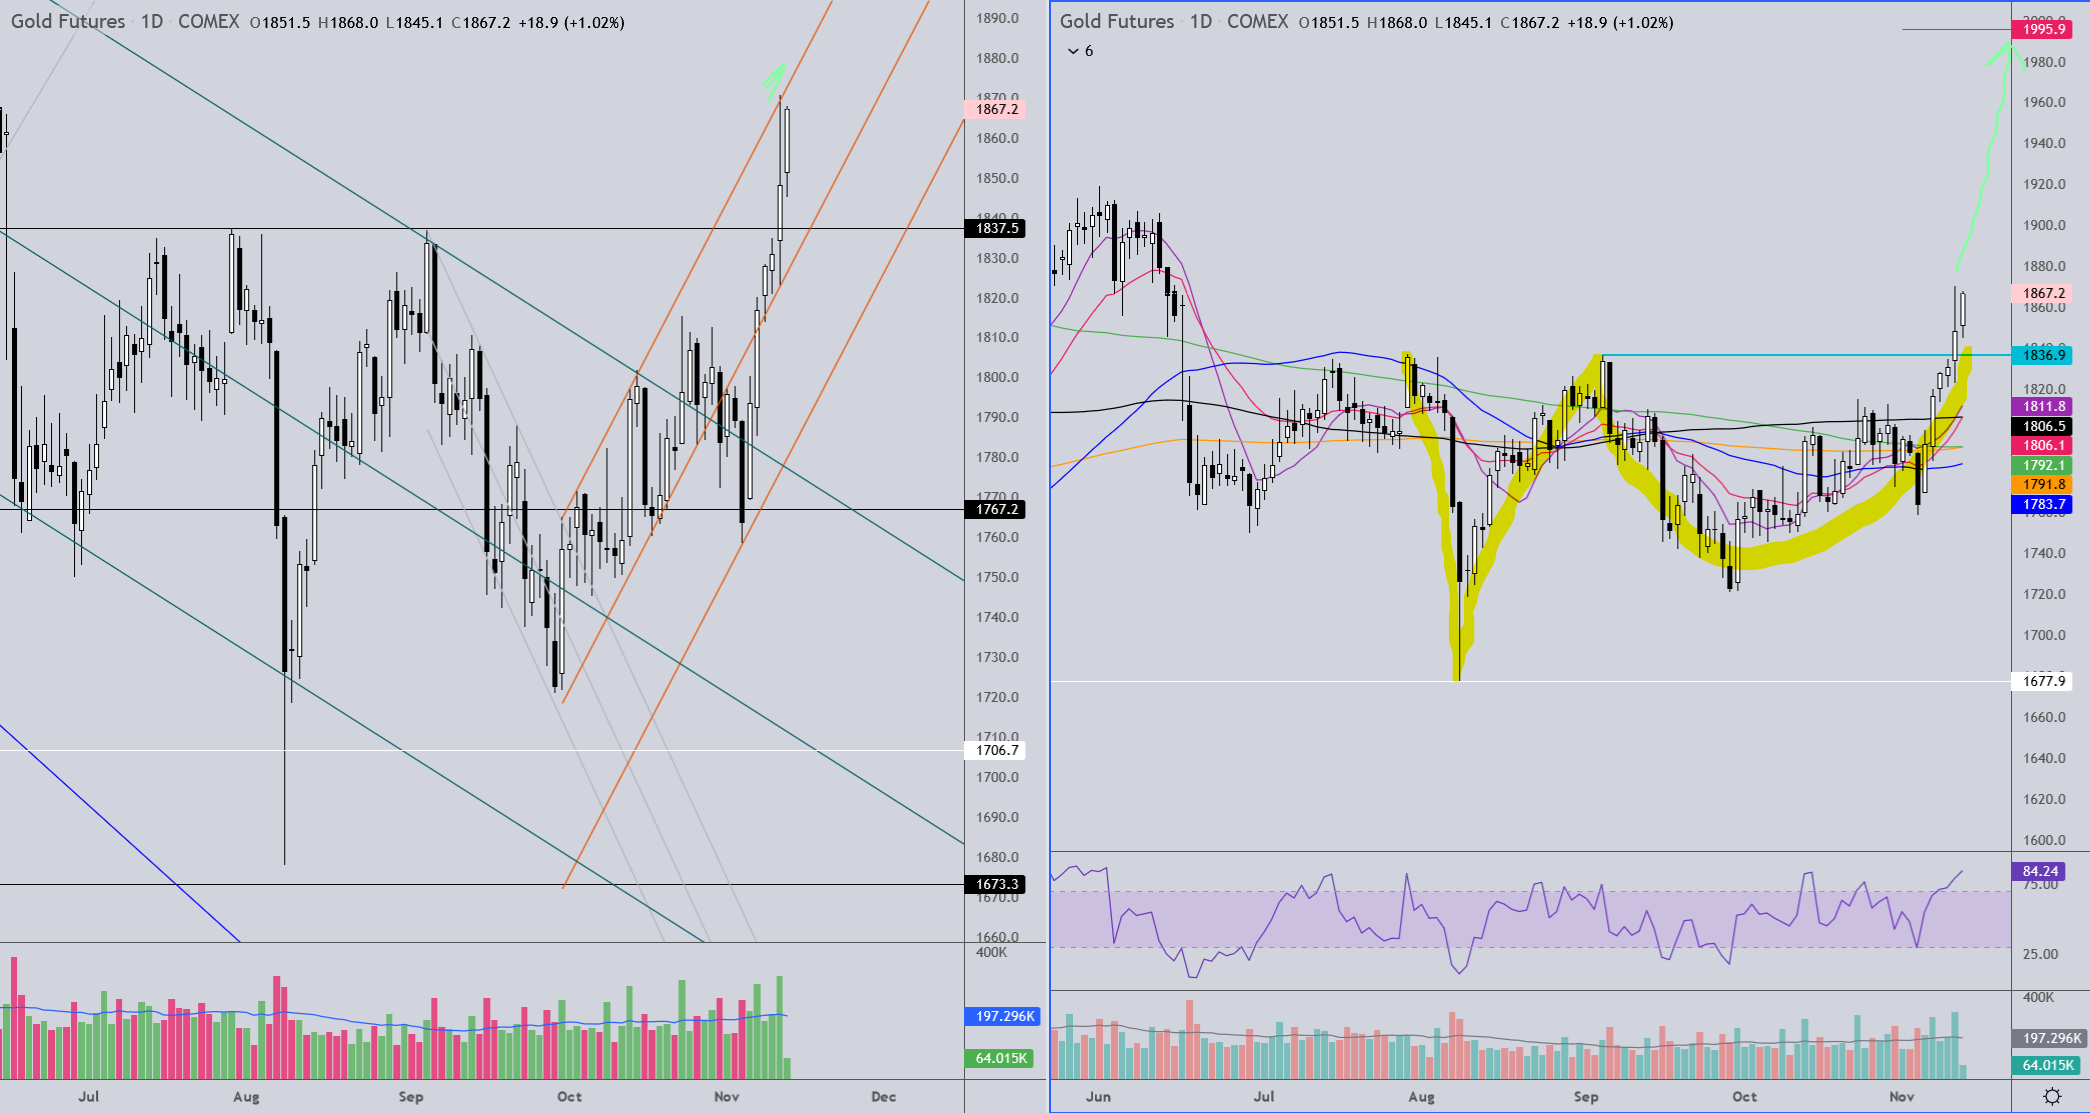
This is the daily chart of gold. Note the channel on the left chart where gold has hit the high side of the channel. Watch for a pullback or hopefully a consolidation (although more likely it gets hammered down like it often does in the mornings). On the right we have the breakout of a big old adam & eve formation. If the measured move plays out fully we’ll be a few points shy of $2000 gold again.
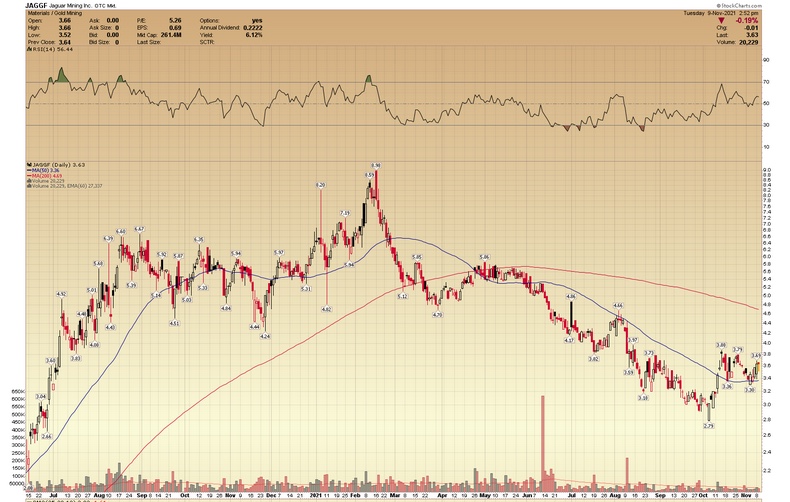
I’m posting two charts, both the same daily interval chart. My intentions with the first are to highlight the trend line and the orange 260ema that tends to be where the stock bottoms out since July.
The next one is a close up showing how, so far, the price has closed inside of the trend line even though the wicks show intra-day trading below. The way the markets have been I can’t say I have great confidence that line will hold, but if it doesn’t watch the lower line for support.
Here’s a simple chart of silver futures for you gents who are looking to acquire physical. This is a daily chart of the silver futures contract with two channels drawn that runs to mid-April 2022. Yes, it does look like there is an inverted head & shoulders bottom there but I’m not expecting it to play out. You can’t see it on this chart, but silver made a run from about 11.75 and the end of that run begins the red channel. Silver has been consolidating in a big bull flag since then between about $28 and $21. Moving forward, keep an eye on the lower line of the green channel if/when the lower orange channel line is broken. Further price declines in silver are not expected to be too dramatic, but into the first half of next year there may be opportunities to buy in the $18 - 16 range based upon what I have heard from those who more or less specialize in the metals sector.