Mark Sebastian, Ace of investing newsletter
Regarding IVS.V (Inventus Mining), they are currently undergoing a 6,000 bulk sample at their high grade 007 zone which is part of their larger 50,000 tonne bulk sample program at their Pardo property. The majority of the exploration at Pardo has indicated anomalous gold mineralization at surface or within 2-3 meters of surface. Based on their public communications, they are expecting results from the bulk sample any day now. Today the stock was up 16.7% on relatively strong volume (for Inventus) which I believe is someone taking or adding to their position in anticipation of results. Here is a post I made on ceo.ca:
According to the Inventus blog update, processing of the 007 bulk sample began on 2/15 with the run anticipated to take less than 10 days. Tomorrow is the 10th day. I don’t know how long it takes to get results, or for those involved in processing the ore, how long it takes them to realize if the results are significant or not, but today’s trading feels like someone is taking a front-running position. I added to my position last week in anticipation of positive results based solely on the previous grades at 007. The previous highlighted exploration results at 007 are as follows:
36.5 g/t gold over 31 m (channel sample)
7.9 g/t gold over 2.25 m; Including 21.2 g/t gold over 0.78 m (drill hole)
13.4 g/t gold over 1.93 m; Including 62 g/t gold over 0.3 m (drill hole)
9.5 g/t gold over 2.0 m; Including 29.2 g/t gold over 0.6 m (drill hole)
The mini-bulk sample program from September 2021 yielded the following results:
Pit #1 – 17.1 g/t gold
Pit #2 – 12.5 g/t gold
Pit #3 – 6.1 g/t gold
Pit #4 – 11.3 g/t gold
Pit #5 – 4.5 g/t gold
Pit #6 – 4.0 g/t gold
Based on those results, I don’t think it’s overly ambitious to expect a grade north of 10 g/t gold in the bulk sample.
The bulk sample is 6,000 tonnes. If the grade is 5 g/t, that equates to 1,058 ounces worth approximately $2,000,000 at today’s gold prices. 10 g/t is $4,000,000. I don’t know how much the extraction costs are, but they’re obviously minimal at surface. Add in ore sorting, which I don’t believe was utilized in this bulk sample (I have questions outstanding to Stefan Spears regarding that), and this becomes quite a profitable undertaking once they’ve identified the high grade zones.
1 Like
Novo news:
High-Grade Gold, up to 91.16 g/t Au, Identified via Rock Chip Sampling at Station Peak, Egina District
10:58 am ET February 24, 2022 (Globe Newswire) Print
HIGHLIGHTS
– Rock chip sampling at the historic Pilgrims Rest Gold Mine at Station Peak in Western Australia has returned multiple high-grade results over 200 m strike, including 91.16 g/t Au, 30.15 g/t Au, 13.27 g/t Au and 12.08 g/t Au
–
Looks like another record high for KRR on some new nickel discoveries:
4 Likes
KRR closes at an all-time high today.
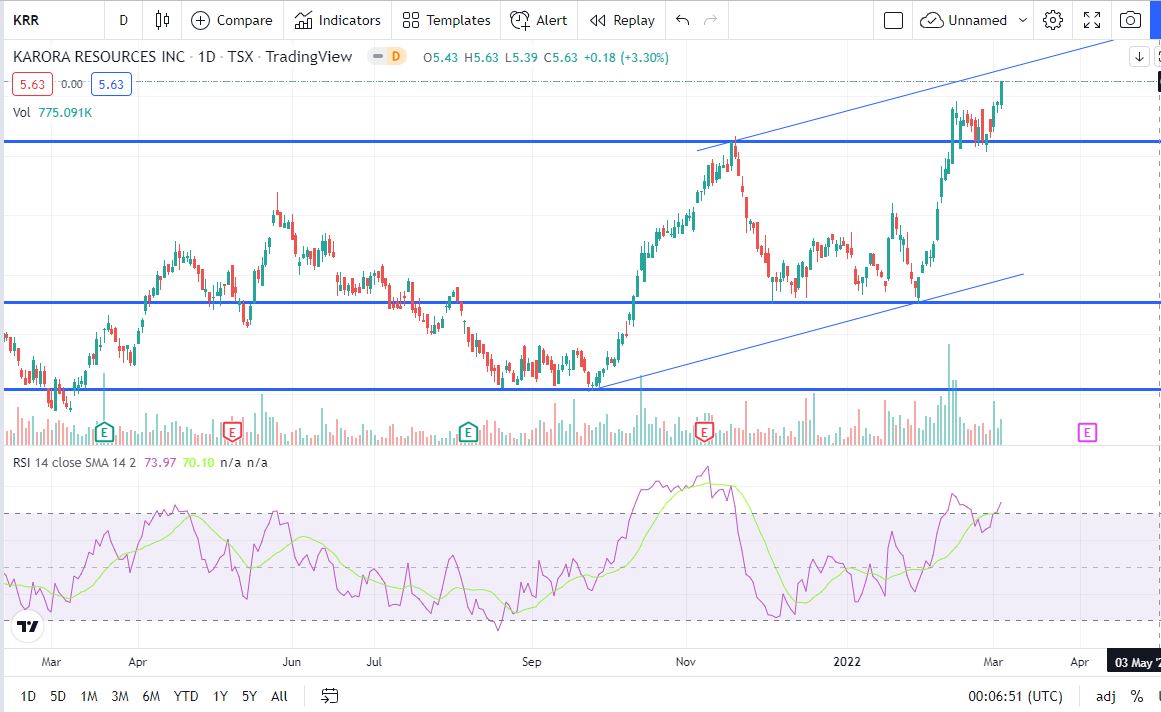
TradeRich - Would love to get a Fibonacci projection on KRR if you get a chance. Or if you think there’s a viable pattern (cup & handle?) playing out.
2 Likes
Last swing trade on this I sold a little too soon. A perfect call from TR right now on when to take some very generous profits would be great!  I’m thinking gold prices might peak out for now next week so some retraction is probable in KRR so will be watching carefully.(Nickel is doing fantastic and likely to stay that way which may be very protective to KRR going forward if gold prices dont cooperate.)
2 Likes
Good morning Fellas
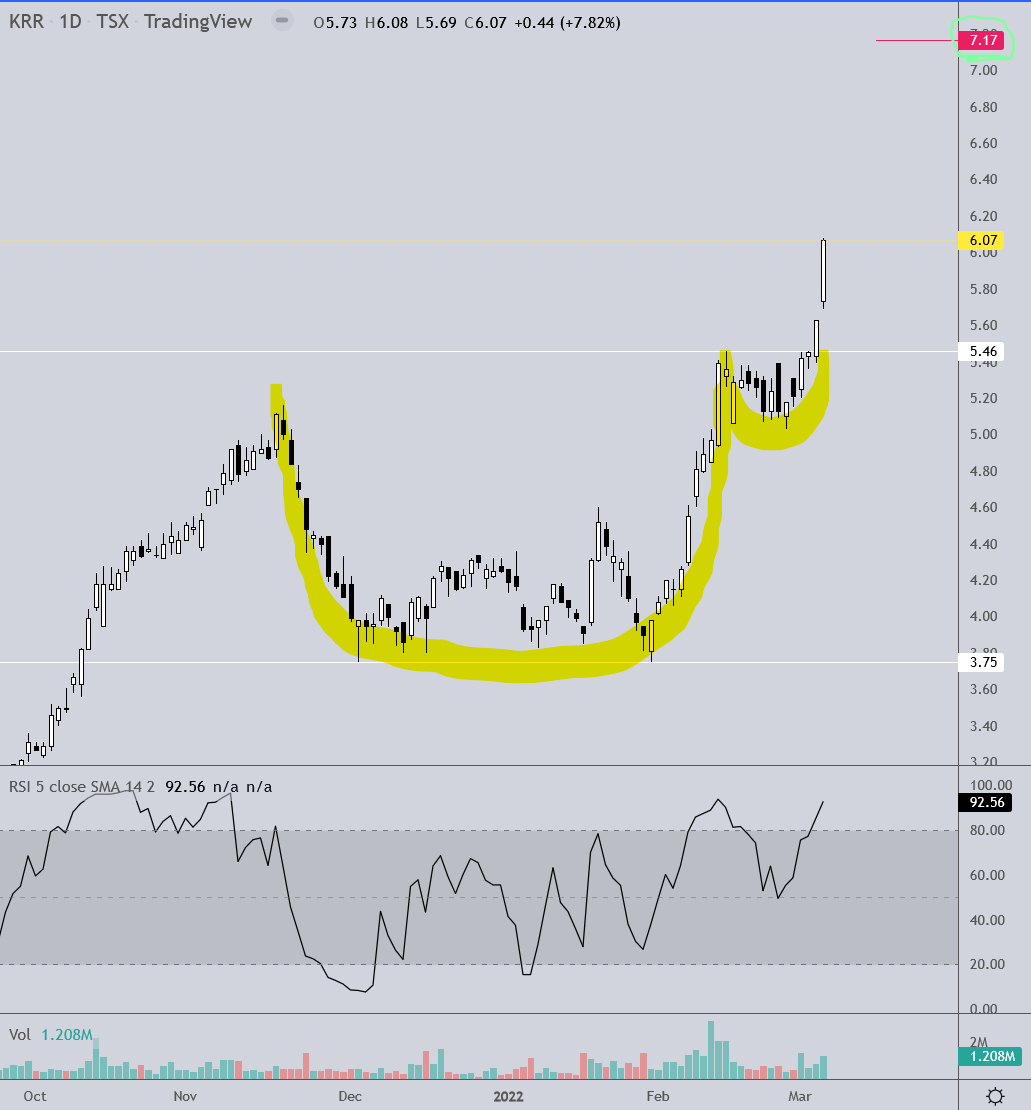
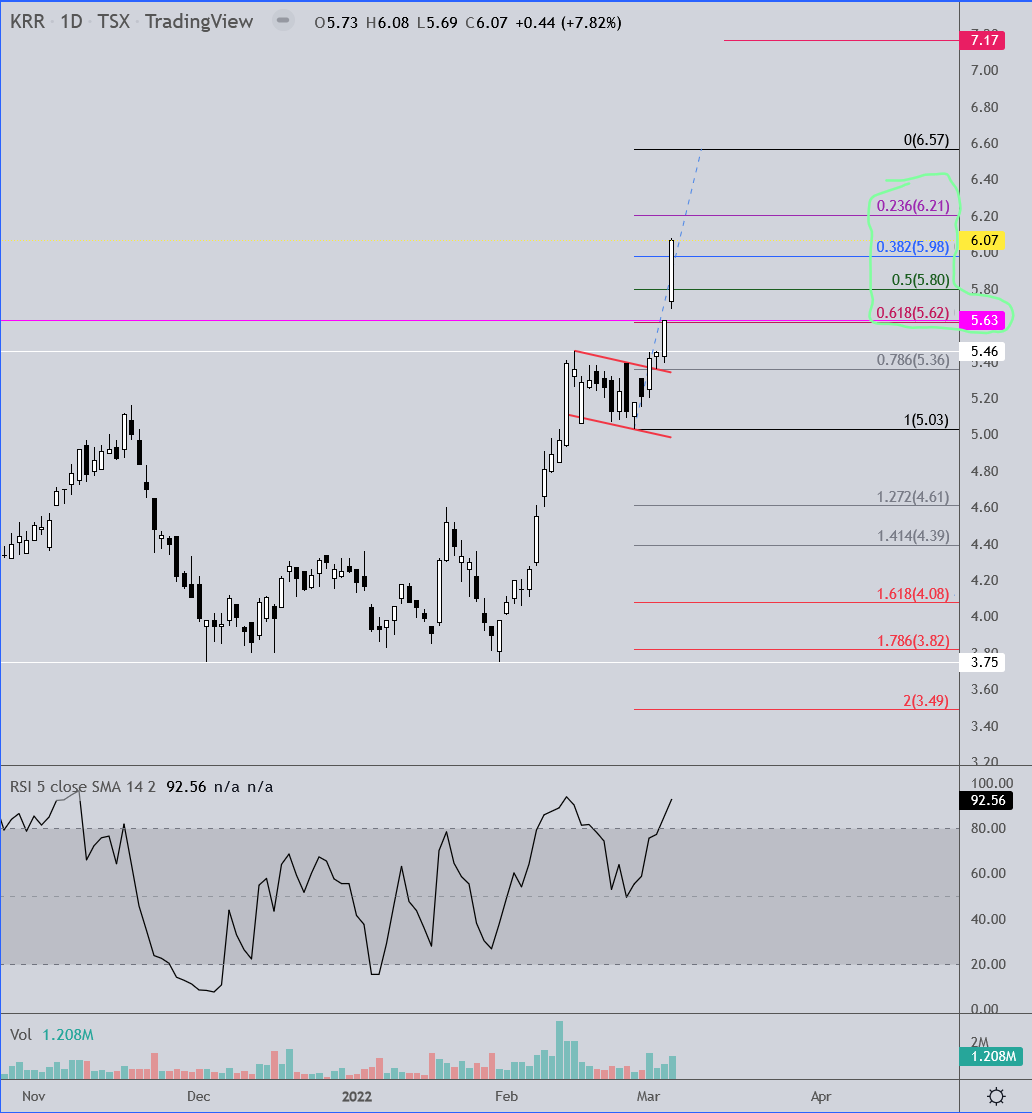
I’d say definitely you’re experiencing the second day of a cup & handle breakout with a target price of 7.17.
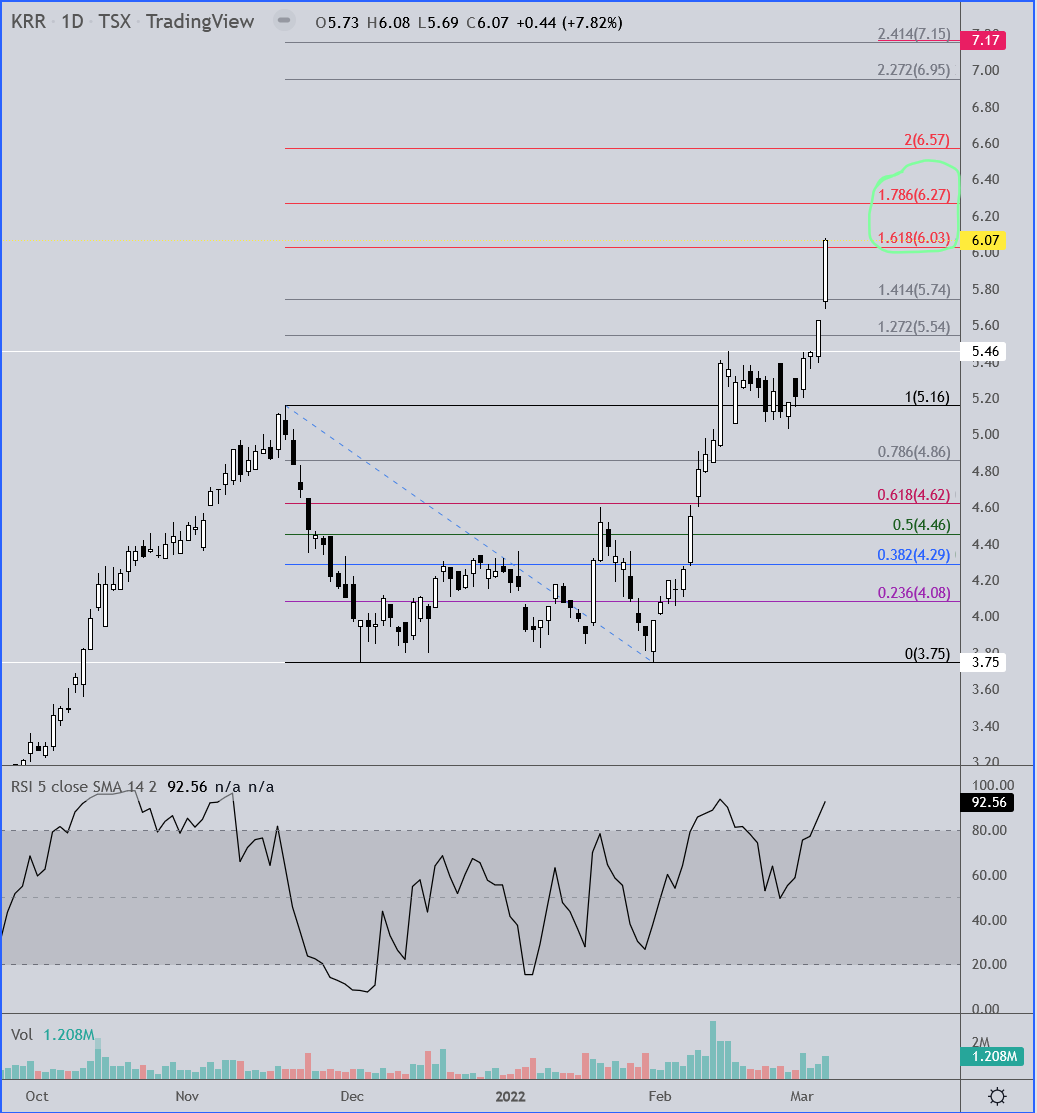
In the likely event that it doesn’t go straight to the target, and since you asked, I’ll attempt to perform the near-impossible price projections. Below is a Fib retracement chart with the extensions. KRR hit the 1.618 extension yesterday. Since there has been two days to this breakout, and the first day was fairly lackluster, I’m thinking there may be one more day, or a partial day, of momo to this move before a retracement. I should have circled the top two red levels on this chart since the 1.618 has already been hit. These are the two levels, or anywhere in between, that I think KRR can get to before a retracement. I think we’ll get there in one of two ways. I don’t think the stock is going to open very near Friday’s closing price. I think the stock will either gap up or down on the open… probably up, but I’ll cover both scenarios.
If it gaps down then keep an eye on support levels because it could have its pullback during the day and resume the uptrend at any point from 2 to 3:30 PM Monday afternoon. If it gaps up at the open (likely imo) watch the 6.27 & 6.57 levels for resistance. It may move up for the first 15 minutes or so before it starts to pull back. Breakouts typically occur over a 3 day period before selling kicks in, and if the stock gaps up I would bet confidently that you’re going to see selling at some point, and likely very early. So now you have the best sense of where to take profits I can give you at this time.
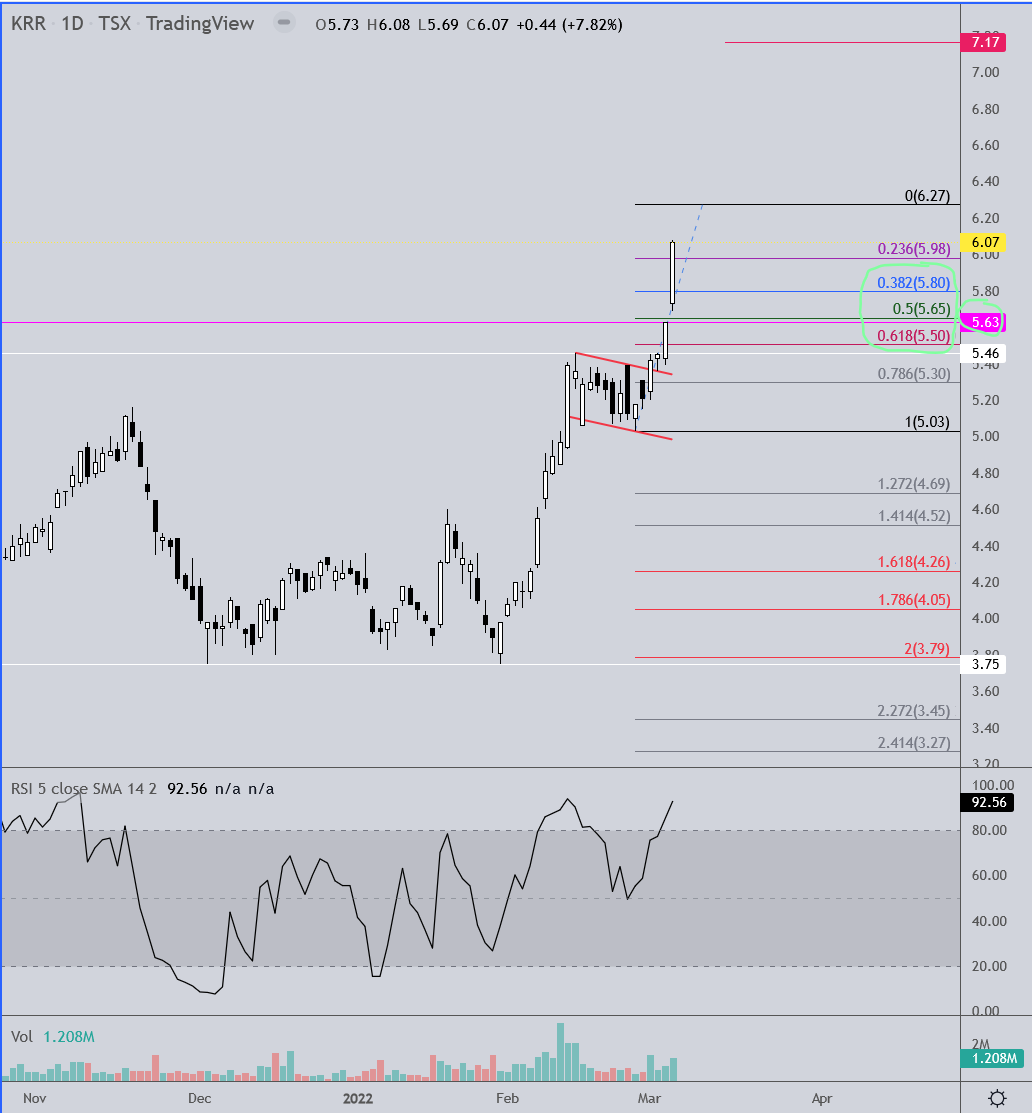
Once enough of a retracement has occurred you can set your Fib retracement grid from the low price on the handle to the new high and use those 4 levels for potential support, along with the pink horizontal line marking the gap support created on Friday’s open. The next two charts are examples of this, with Fib retracements drawn with the assumption that one of the two Fib extension levels are hit perfectly. If I’m around and have time… and providing any of this proves accurate… I’ll do my best to post a chart here with an actual Fib retracement grid and any comments on what I’m seeing.
3 Likes
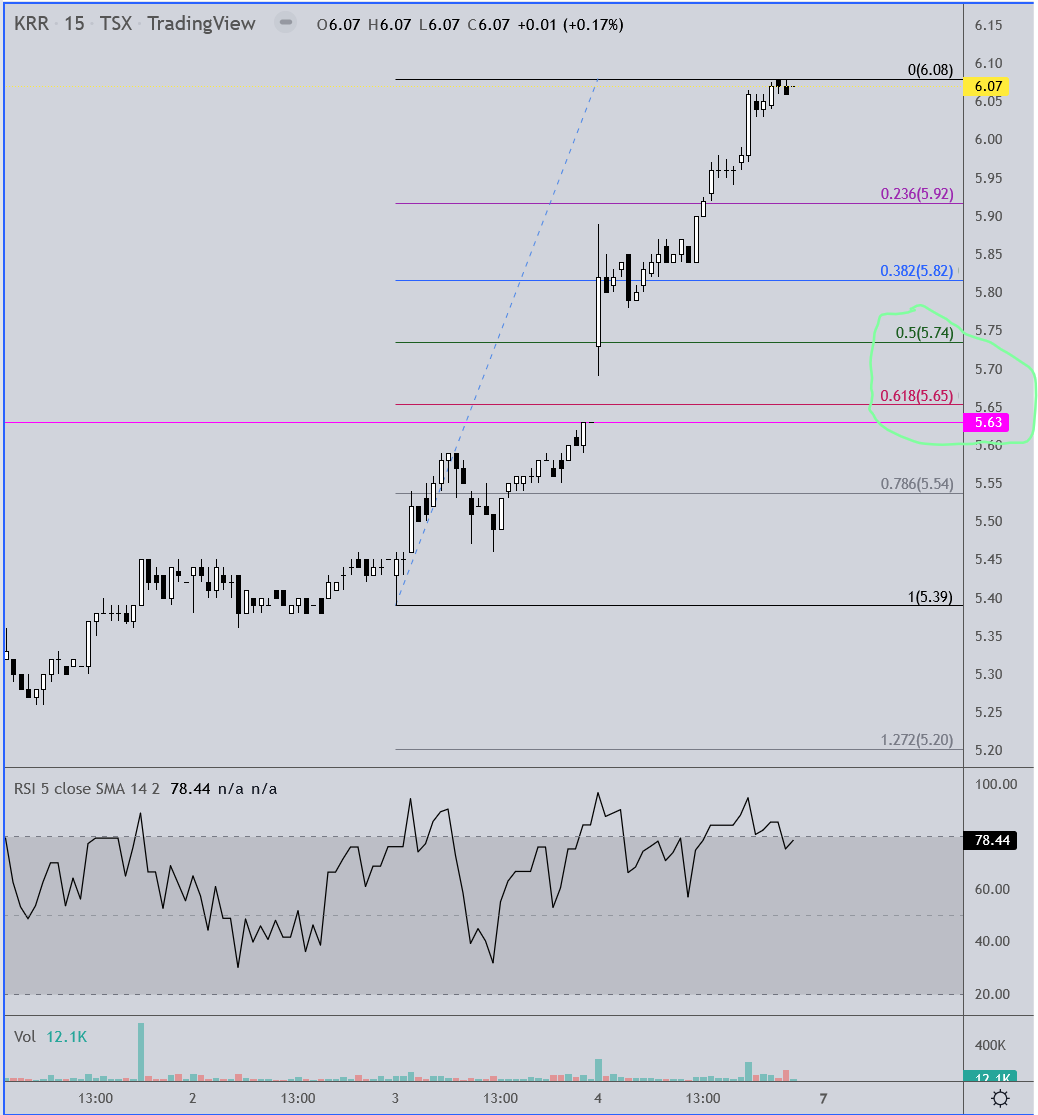
In the event that KRR should open with a gap down, you’re going to have the problem of trying to decide if it is just a minor intraday pullback that could reverse by afternoon and move on to higher prices, or if it is the beginning of a larger retracement. The best way I know to do that is by running a Fib retracement grid over Friday’s price range, and also over the range of the breakout thus far. It’s likely that if the stock is just making a minor pullback then support will be found at the 50 - 61.8% retracement levels at either of those ranges, as I have marked on the following two charts. The first chart covers the range of Friday’s candle, the second covers the entire range of the breakout from the handle.
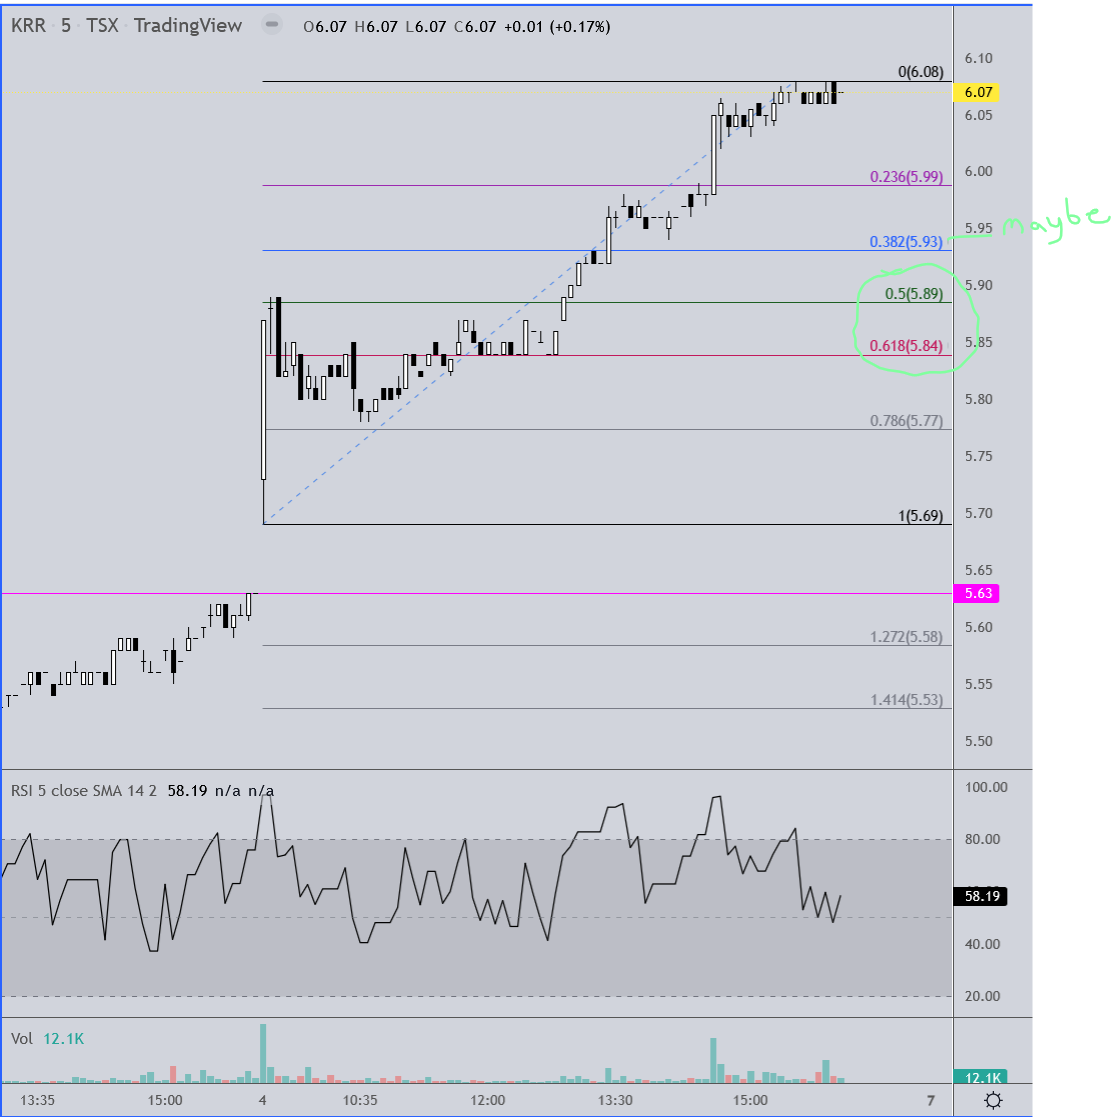
On this second chart covering the range of the breakout, note that the .618 retracement level is two ticks above the gap fill. Great place for support before the next leg up.
2 Likes
Awesome charts and analysis Rich! I definitely appreciate it. I made the conscious decision on Friday to hold through the weekend as there was likely (IMO) a world event that would maintain or increase the POG…that obviously being Russia/Ukraine related. I was also planning on selling half my position at the open. I am up more than a triple on KRR and I’ve taken profits previously.
Thanks again.
2 Likes
My pleasure Rick… and congrats!
I’ve sold about 20% of my position so far. May sell more next couple days depending what gold does. Hopefully rinse and repeat (it’s by far my biggest holding) FWIW
HR,
Glad you changed your mind! I sold a few shares the past two days, but now have changed my mind on trying to trade Karora near term completely, or any of my actively producing miners. This was after listening to a talk by Michael Oliver that appeared just yesterday (March 5). Michael Oliver’s interview really covers a lot of information that needs to be considered in the context of today’s global turmoil and past secular gold markets in the PMs and commodities. Karora is certainly one of my very largest and most profitable equities held in my portfolio. I can take profits elsewhere. I believe Karora’s earlier guidance was a case of a conservative “under promise and over deliver” forward goal. I expect it to do much better than they were thinking at the time. The newly discovered and expanding Nickel resource, as MG alluded to, is a very important component of future growth for this stock. Nickel is greatly important in battery technology, along with lithium (and carbon/graphene). It may be more significant than copper to Electric Vehicle industry growth, but that’s another topic. The need for fossil fuels to sustain industry has been grossly misguided and overlooked in government policies. Again, another topic, but must be considered along with many factors in the overall perspective of where currencies and gold are headed.
Michael Oliver’s interview is well worth listening to in it’s entirety, IMHO, just filter through the commercial pitches. I’m very much looking forward to hearing Karora’s webcast on 3/14/2022 at 10 AM EDT:
Karora Resources Inc. – Fourth Quarter 2021 Results
Use the link below to enter the webcast.
Karora Resources Inc. – Fourth Quarter 2021 Results - 1532514
Also, some of you may remember a short 30 minute video clip that appeared a while back on the old thread. Can’t blame you if you aren’t interested in the keynote speaker’s presentation at a Precious metals Conference back in November 2019. After all, he mostly talked about present history and parallels to the roaring 1920s with it’s rapid social and political change, bubbles, and interventions on monetary policy since 1933, or actually since the FED was created in 1913. If you prejudged the important content and message because of the forum of where it was presented, or that it’s several years old, you may have missed an opportunity to be entertained and gain a new insight. After all, we’ve got a full plate of things in the news; Covid-19, worldwide political unrest, trade relations …. Fill in your own list. There a multitude of competing factors that are rapidly changing. But here’s one of the slides:
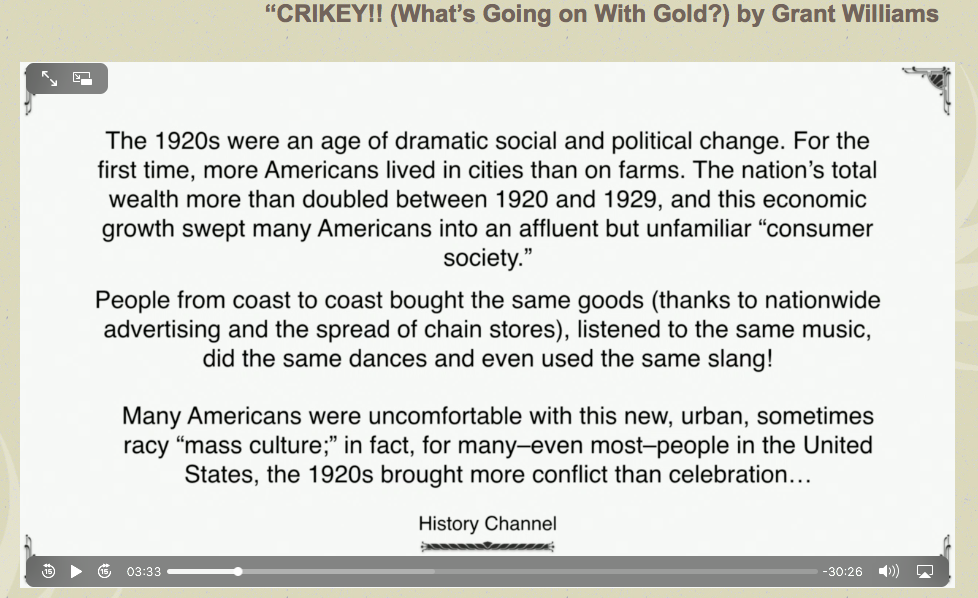
(“CRIKEY!! (What’s Going on With Gold?) by Grant Williams)
Admittedly, I have not done much swing trading and concentrate mostly on long term value plays, along with an overweight share of speculative plays. I will “rightsize” my investment in these more speculative plays depending on how they perform or underperform by the end of the year. Undoubtably, charts and technicals are very important in picking entry and exit points. I prefer weekly and monthly interval charts when I place trades, and usually place trades weeks or months before they play out, if at all. Patience! Shorter term charts and trades can be made hastily, but on trading long positions, I prefer trades on stocks I’ve held a year or more. I don’t mind replacing them at a higher price on any pull backs from where they were sold. I like to trade long positions by trading around a core strategy, stair stepping on increasing price while holding a relatively stable core position if possible.
I’m willing to learn from what you, MG, and TR post, along with anyone else taking time to post. I think miners with a steady cash flow in some of the most stable countries, along with the major Royalty PM miners, will exceed all expectations in this sector for more than the next several years. Other commodity sectors with improving cash flow are also becoming a more important component of my overall portfolio.
2 Likes
TR,
Thanks! Im going with the gap up scenario tomorrow, correction then still up 5% for the day. Might hold off doing anything till Tuesday.
2 Likes
This is almost a certainty!
I saw nickel hit an all time high overnight.
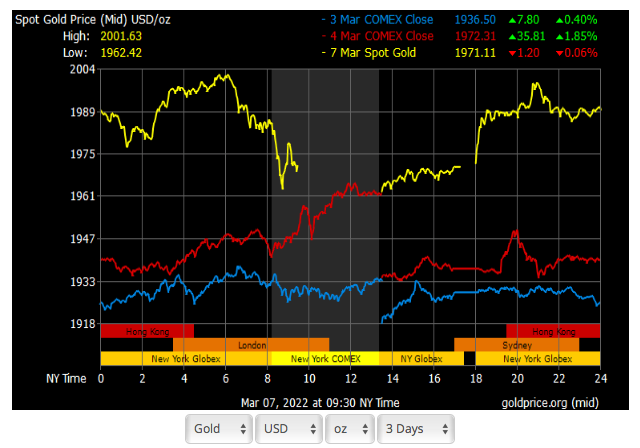
Also Gold over $2K overnight before dropping early this AM.
Count on nickel being a major money maker for Karora in future years.
The Nickel Supply Squeeze Could Send Prices Even Higher
Jan 24, 2022, 11:00 AM CST
- The nickel market is experiencing its most significant supply squeeze since 2007.
- LME stocks have fallen every day since October last year.
- Evan long-term contracts relating to spot prices and battery makers remain at risk of rising raw material costs.
The Nickel Supply Squeeze Could Send Prices Even Higher | OilPrice.com
1 Like
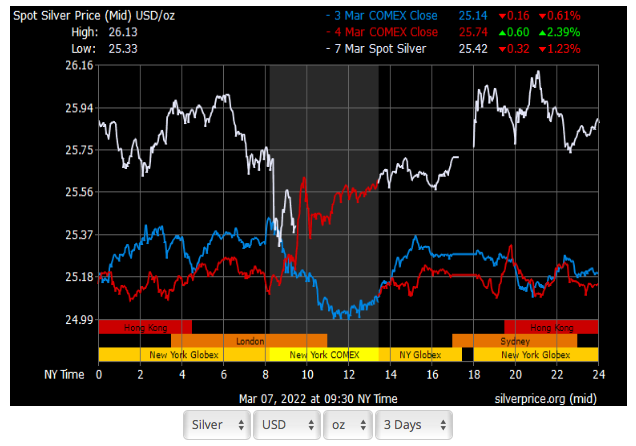
Gold (2001.63) and Silver (26.13) soar overnight before dropping back this morning:
I sold 25% of my KRR position at $6.37. I had a sell order in at $6.25, but the share price seemed to stall at $6.24 which I interpreted as a bullish flag (without having a chart handy). So I pulled that order to see if my hunch played out…which it did. My hunches usually don’t work out like that!
Holding the rest to see what happens next. Earnings on March 14.
1 Like
The small gap down right at the red MA says as of this morning the trend is still strong. Currently we have the convergence of the three shortest MA’s as price has consolidated for most of today. It’s either pushing higher by the EOD or it’s time for a deeper retracement. We’ll know by the close I suspect.
2 Likes
Today worked out as planned on KRR with 5%+ gain. 1 to 3 more up days before correction?
I sold good size position today had to take some profits made mistakes before by holding to long, waiting for a pull back I hope to re-enter.
Great company.
2 Likes
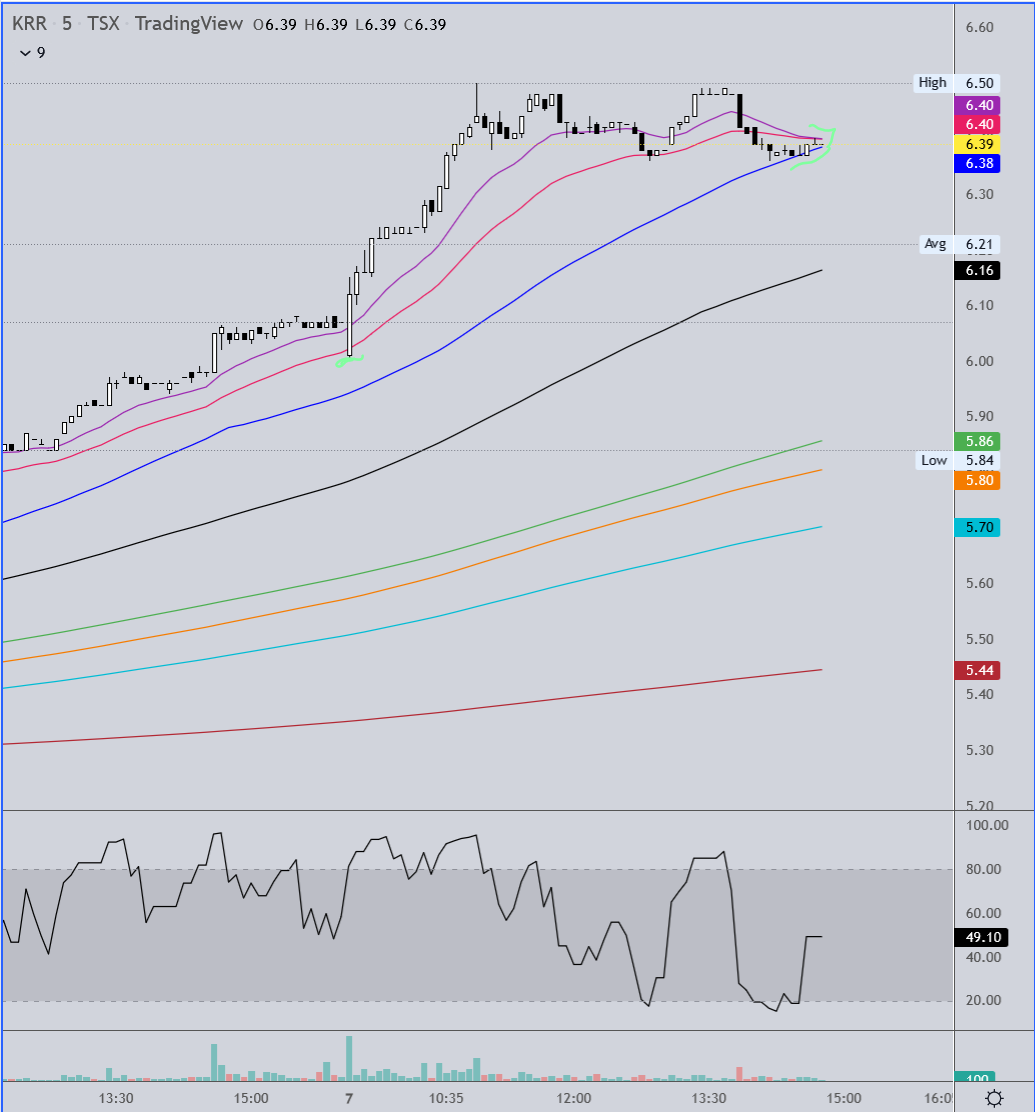
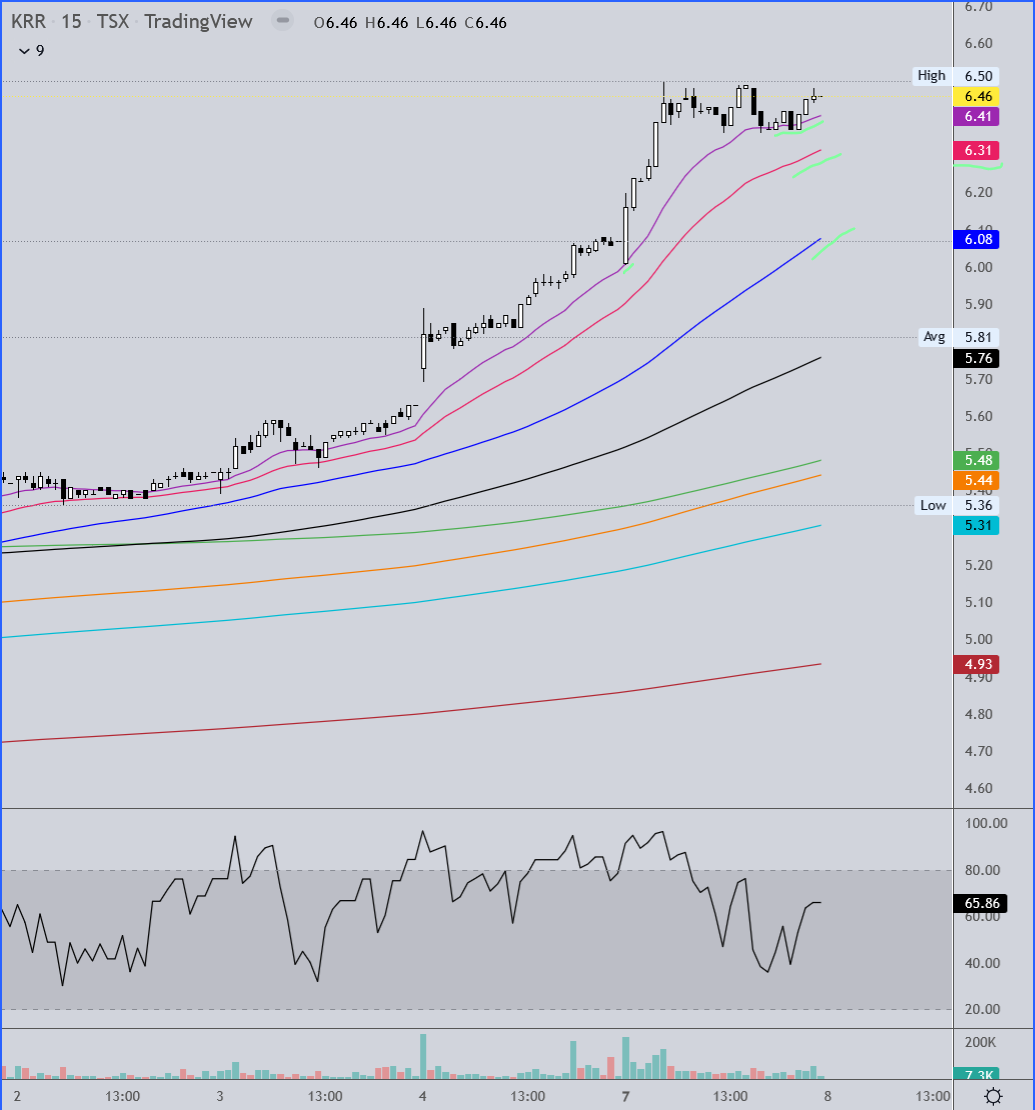
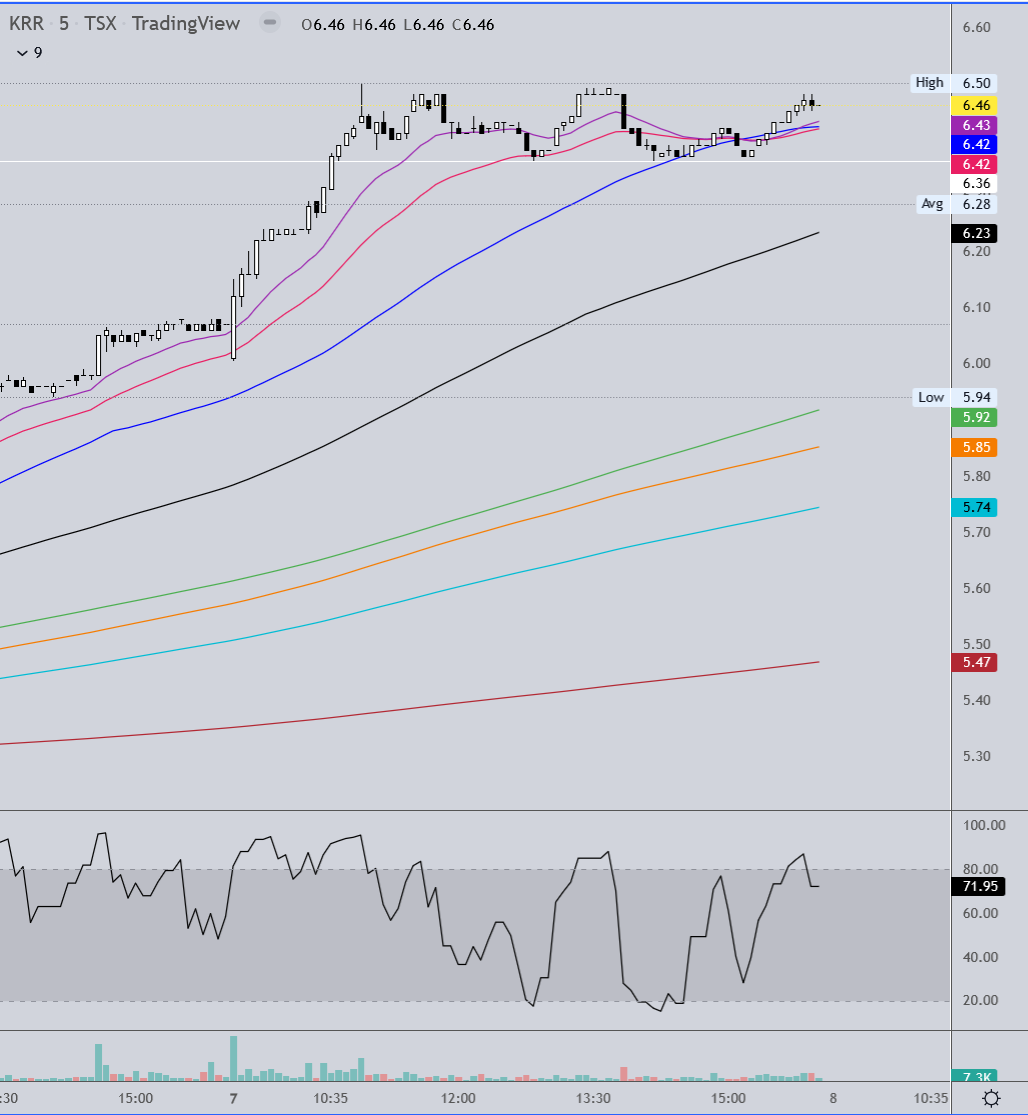
The gap down open today right to the red MA on the 5 min chart was the tell that the trend is still strong. At this point I’m pretty confident you’ll know when a deeper pullback is coming because KRR will likely gap up at the open. Then you have to see if it is going to push higher for the first 15 - 30 mins and then start a deeper retracement or if it is going to start the retracement right from the opening price. The 15 min chart here shows the stock went into a narrow range price consolidation after the first hour and a half of trading. So far the violet MA has been the support line through the whole breakout. It’s the equivalent of a 10ma. The red 20ema below should also be watched.
The 5 min chart shows whomever was accumulating today had 6.36 as their support line in the sand.
Although the daily/weekly/monthly charts are all showing RSI oversold, the candle today is both the most expansive and the highest volume day in the three days of this breakout. Along with the close being just off the high, I’m inclined to think tomorrow will be another day of new highs. Just keep in mind that if you’re looking to take some profits near the highs, tomorrow is day 4 of the breakout, although probably the reason we’ll get new highs to some degree tomorrow is because that first day was pretty lackluster. I’d be willing to bet pretty confidently that if the stock gaps up tomorrow it is likely to begin pulling back at some point. Another consideration is that the 7.17 target of the cup and handle isn’t so far away that it couldn’t hit that target before starting a retracement. It also doesn’t have to hit that precise number, so be flexible.
2 Likes