I had a request for AG, First Majestic Silver, so here it is…
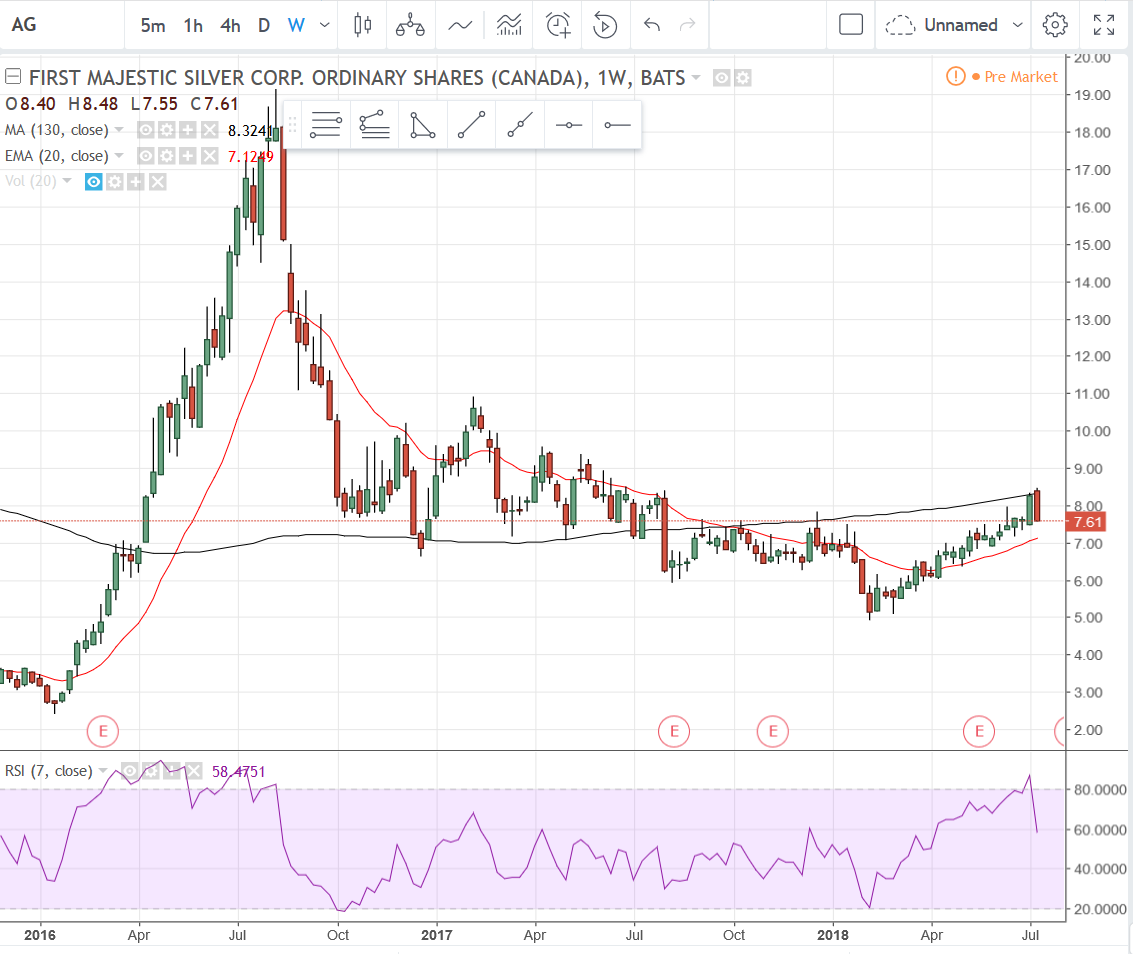
The first chart is the weekly interval. If I’m invested or investing in this (I don’t have a position) there are some very simple things I’m watching. On the first chart, look at the black 130 MA going from far left to right. The first time it was touched it acted as resistance for a month while a flag formed. The breakout occurred on the 5th week and oh what a breakout it was! Then look where it went on the long pullback… the 130 MA again. Took a little dip below it and then popped upward again. It did this 3 more times and then fell through and lost the 130 MA support. When it tried to go higher, on three occasions over the course of about 6 months, the 130 was the stopping point each time. (Hopefully you’re getting my point).
From about February this year AG has made quite a linear move from $5 to about $8.50, where it again hit the 130 MA resistance and has pulled back. Ideally, you want that red 20 EMA to hold as support, or at least the $7 mark. So that’s what I’m watching on the weekly.
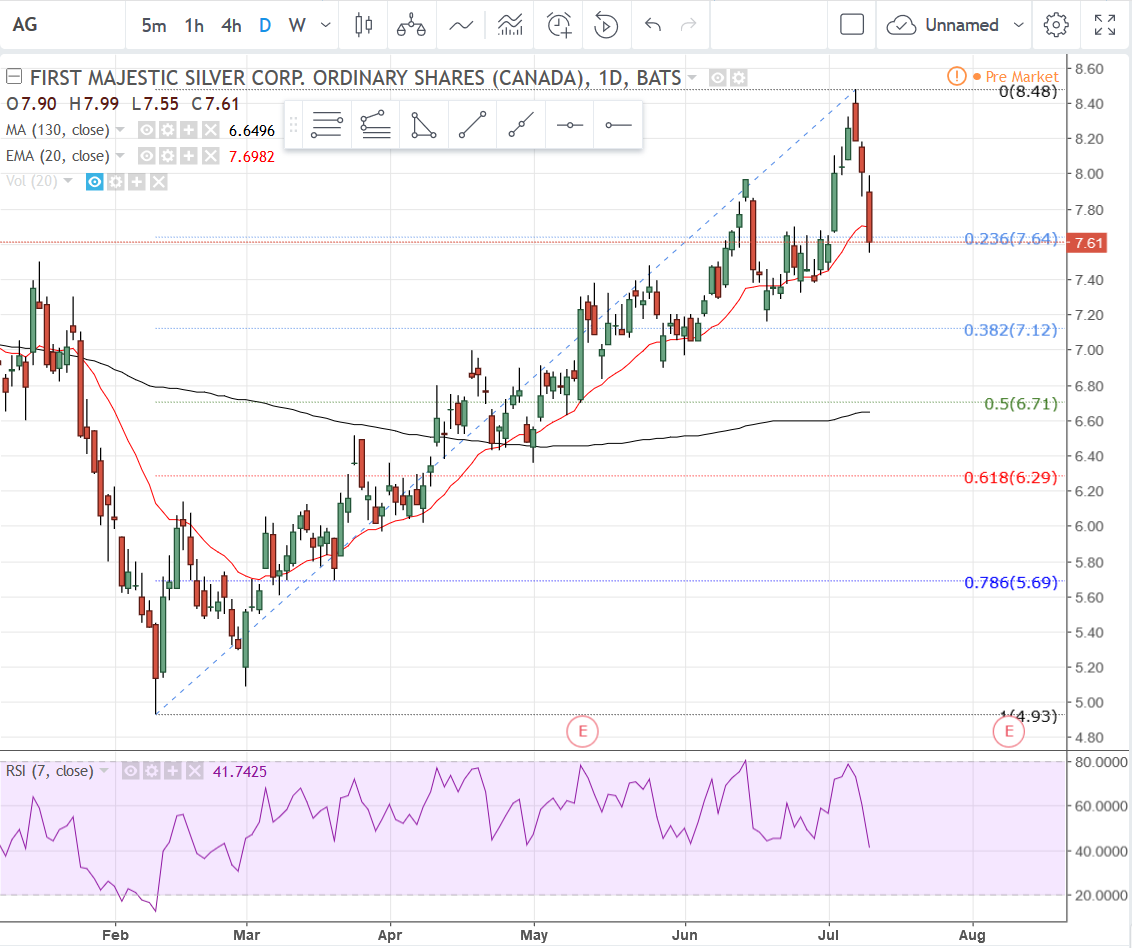
Now here’s what I’d watch on the daily interval. You’ve got the 20 EMA here that has been a decent support area. Today’s candle should be telling because on the run this stock has had this year, any drop below the 20 EMA on the daily interval chart only lasted a day, so if it closes below today, it’s not a good omen unless you want cheaper prices. If it does move lower, watch the Fibonacci retracement levels which are the colored numbers to the far right of the chart, the 50 and 61.8% levels in particular. Also of note, the daily 130 MA is lingering just below the 50% retracement level, so you’ve got a double level of support, which, if it holds, should provide a very nice buying opportunity. If it does not hold and drops below the 61.8% level without showing much strength then I’d be getting concerned if I was long.