My Ms.Cordial addresses me as Mutus Et Surdus if, I start to read her some thing
off Mining Play now a days…?? She also signs to me in the standard New York cabby hand gesture
when I try to interest her into investing more $$ toward MDMN.
MDMN = Bringing people together.
I’m sorry folks. I guess I ate something that didn’t agree with me and was sick as a dog this weekend. I’ll be back when fully recovered… probably tomorrow.
Don’t worry TR…, get well the most valuable aspect in life is health nothing else comes close to it.
2 Likes
Thanks Hulkster.
MUX news
McEwen Mining Files Fenix Preliminary Economic Assessment - Extends El Gallo Mine Life by 12 years
Ditto what Hulk said. On a sidenote only 2 more quarters till MUX’s Nevada mine should come on stream
1 Like
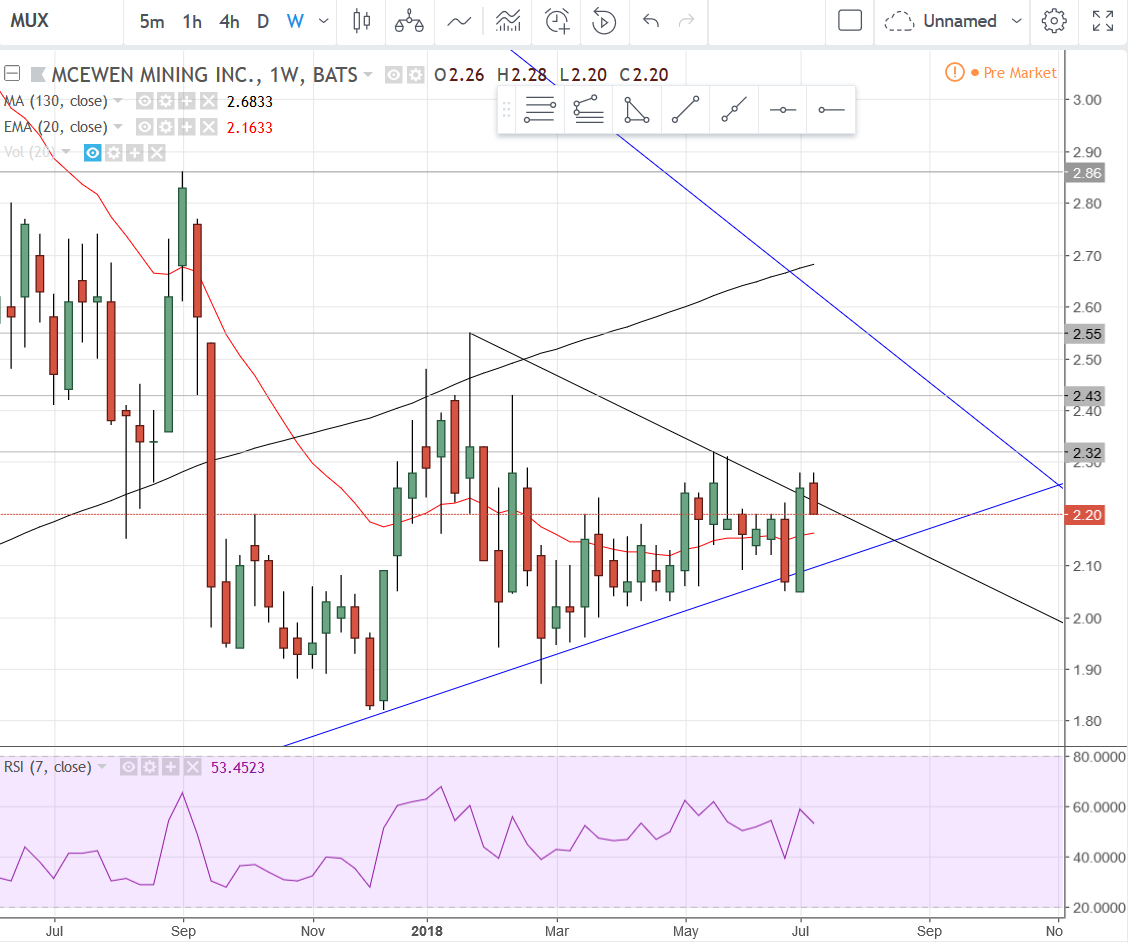
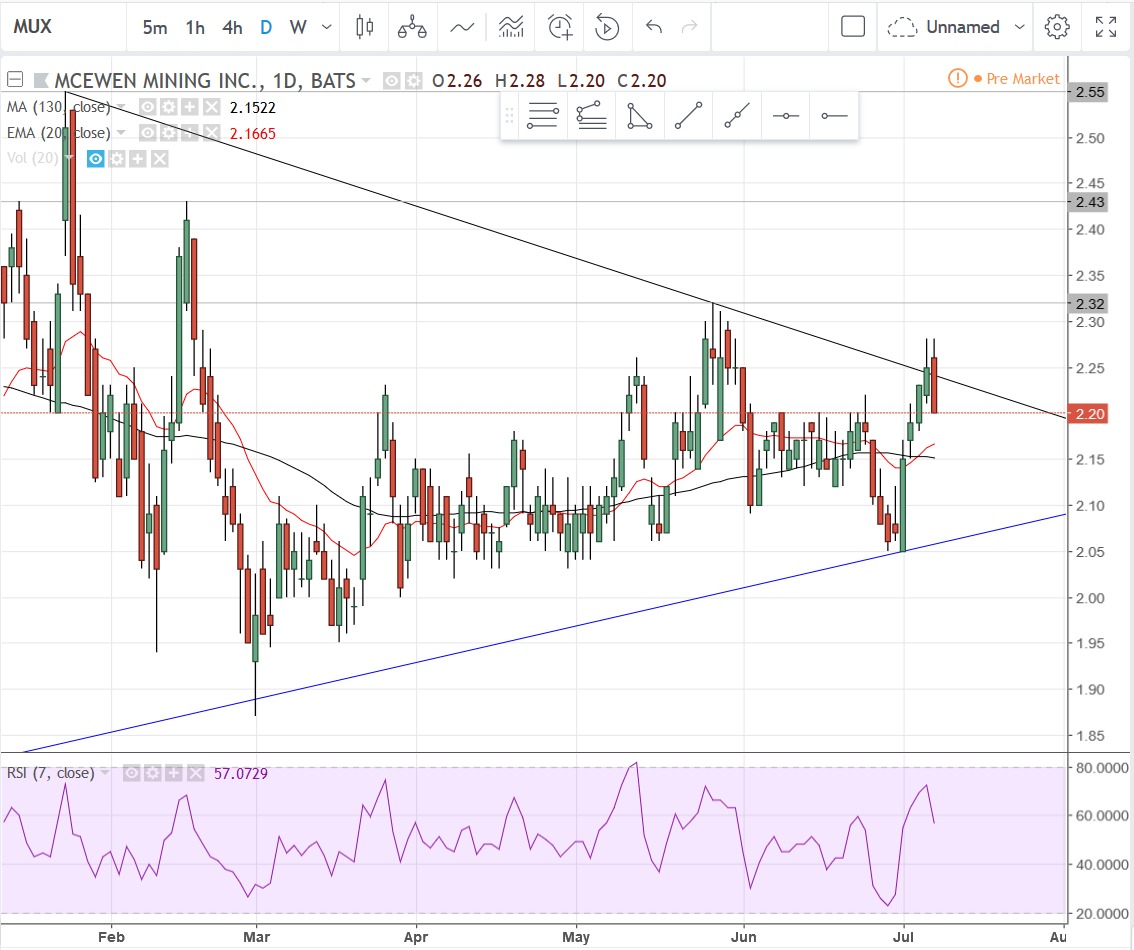
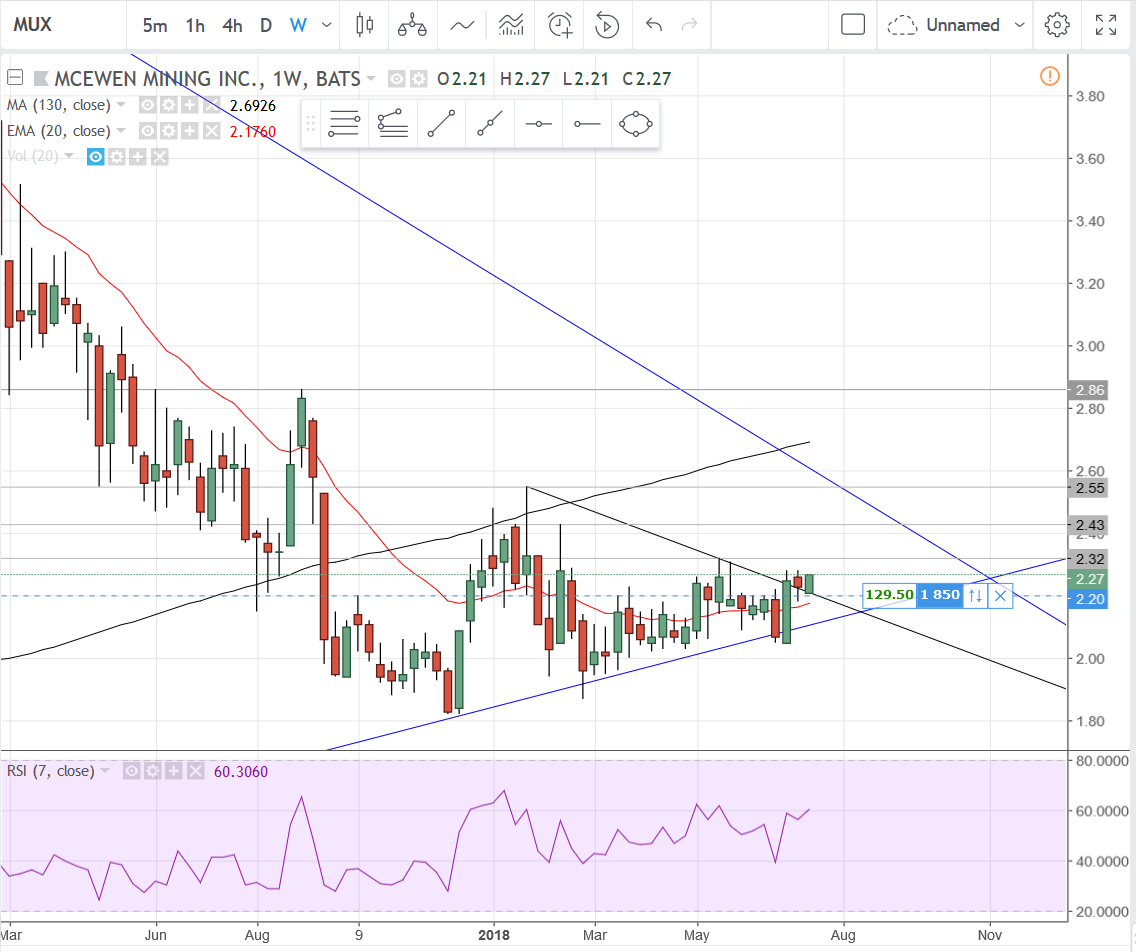
MUX: First is the weekly interval, second is the daily interval. Both show a false breakout of a short term downtrend line. No biggy there. Watch the 20 EMA on both intervals for support. MUX continues to move more or less in unison with gold. There’s not a lot more to say for now. Keep the previously mentioned resistance levels in mind on any upward moves.
1 Like
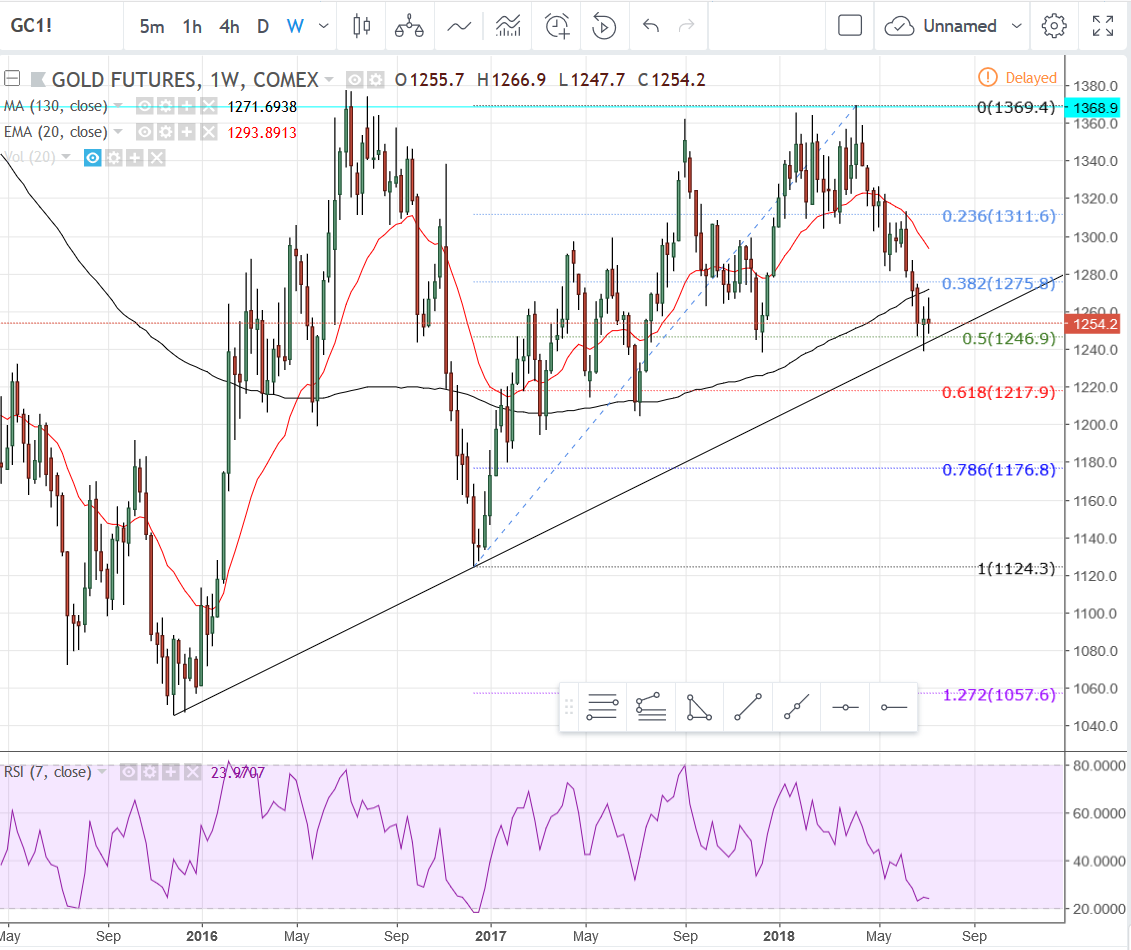
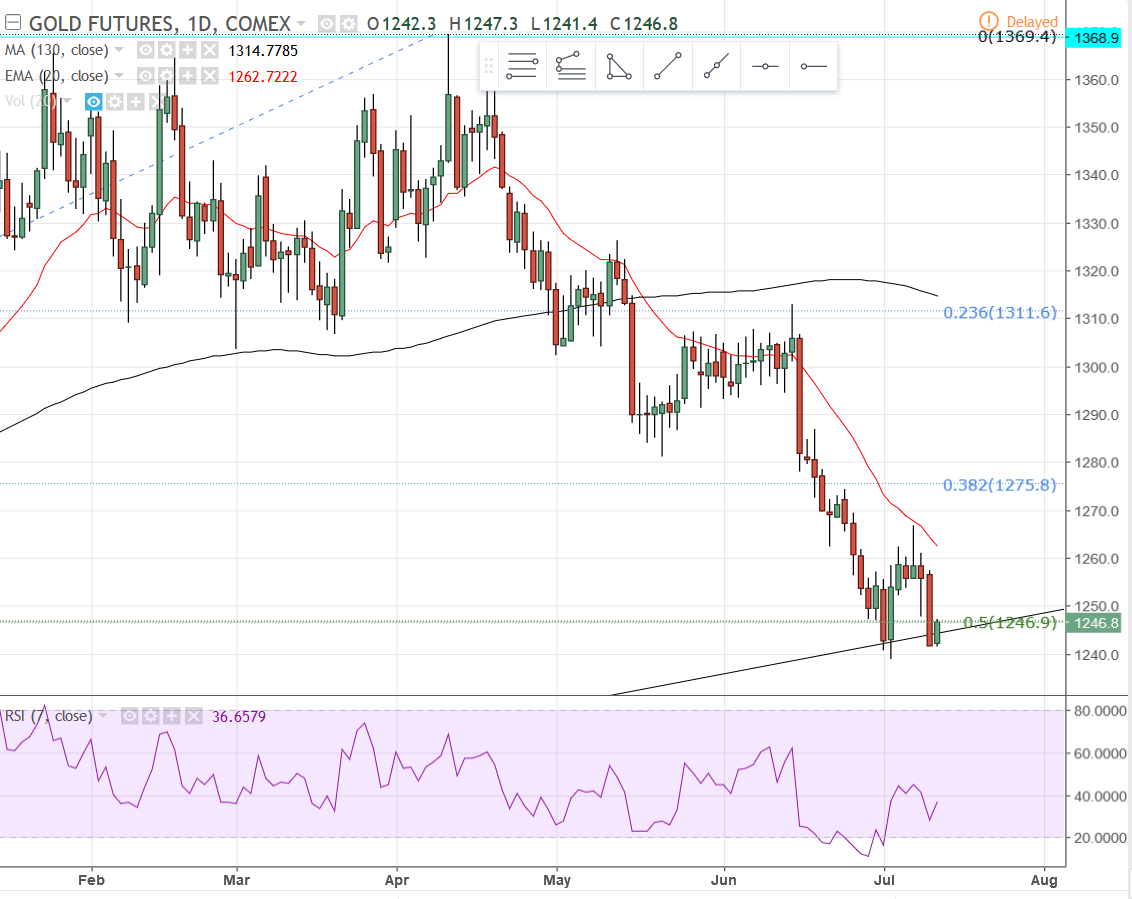
Here’s the weekly interval gold futures chart. Although gold has dropped below the 20 EMA and 130 MA, it’s testing an uptrend line now and the RSI indicator is in oversold territory. It has also tested the 50% retracement level of the last major low from late 2016. If gold moves lower, watch for support at the 61.8% retracement at 1218.
I’ll cover oil and the dollar later on. So far oil is looking like it could go higher, but I’m still anticipating more of a drop for an entry.
2 Likes
Are copper, gold & silver telling us we’re fixing’ to go into a recession??? Oil too??
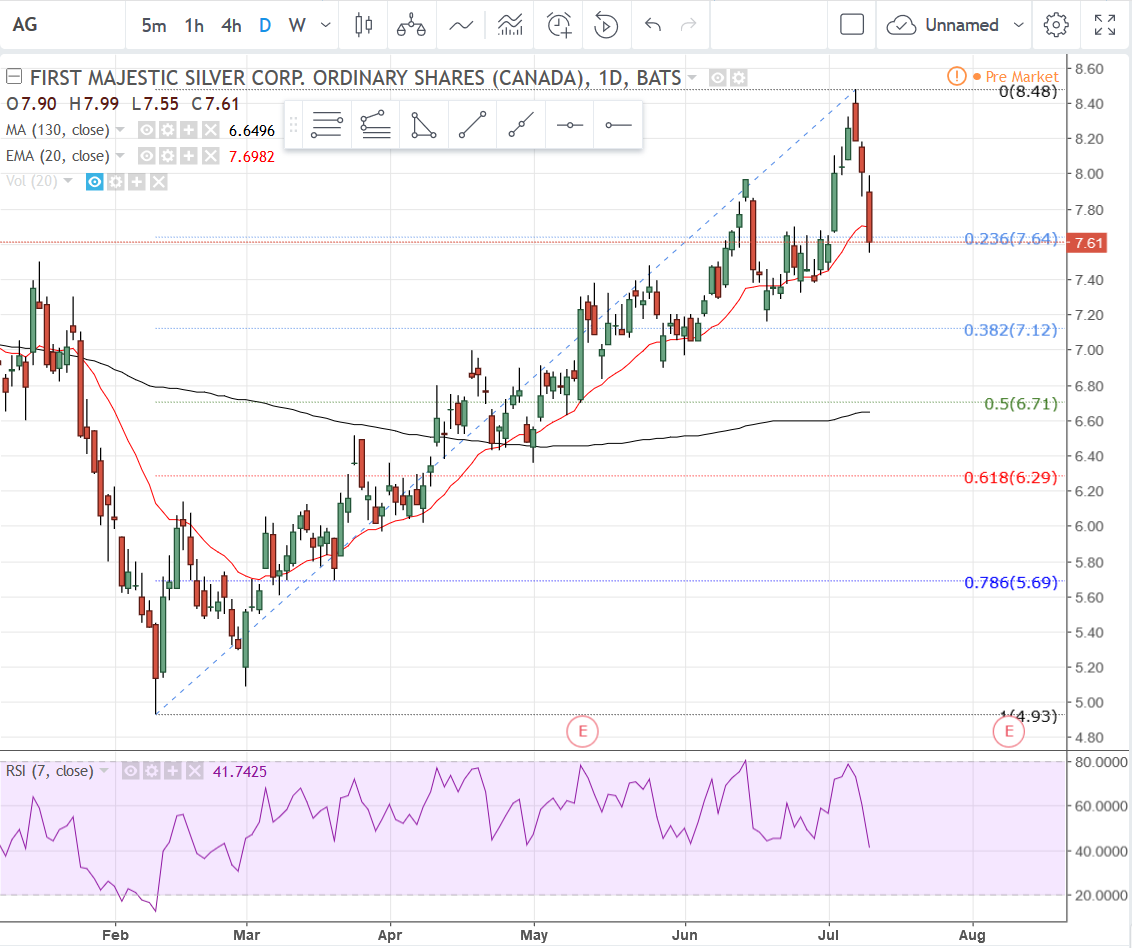
I had a request for AG, First Majestic Silver, so here it is…
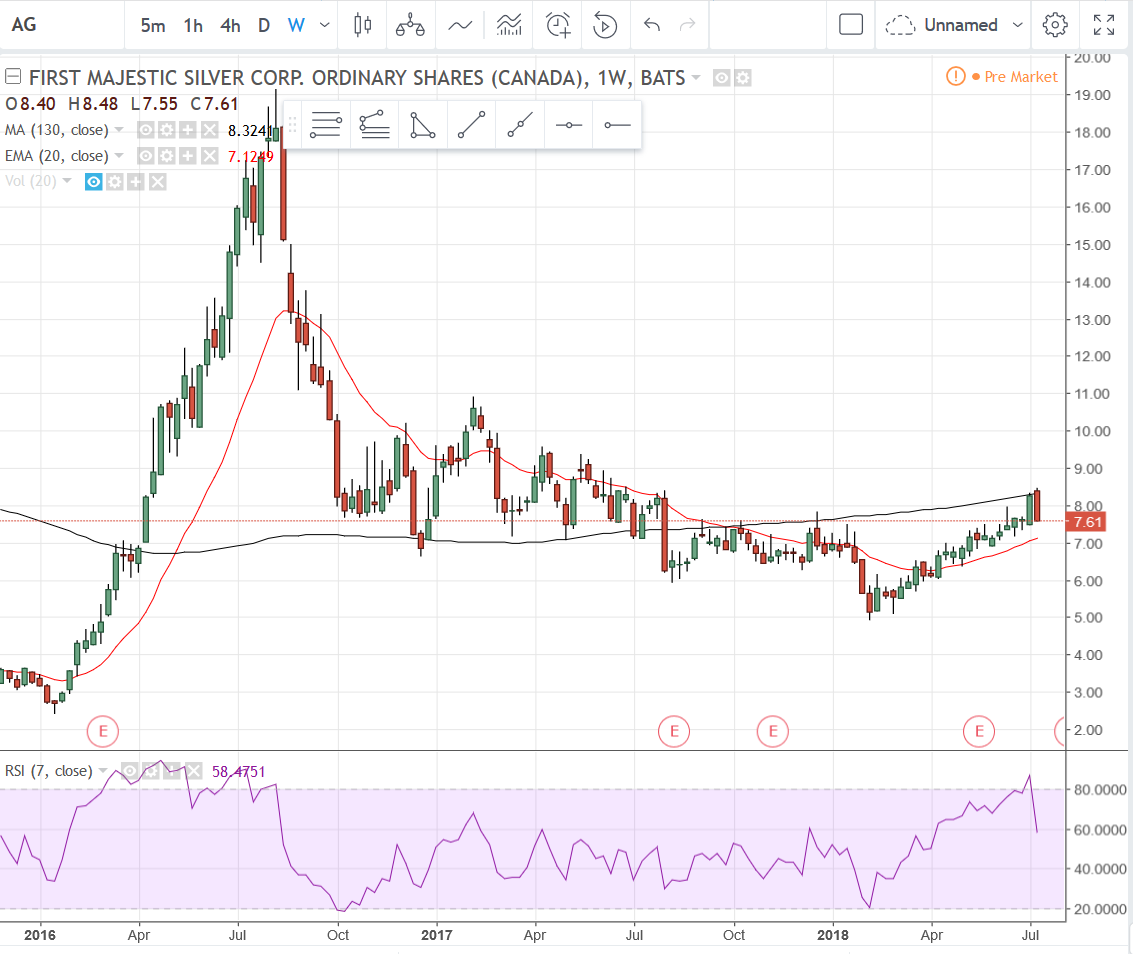
The first chart is the weekly interval. If I’m invested or investing in this (I don’t have a position) there are some very simple things I’m watching. On the first chart, look at the black 130 MA going from far left to right. The first time it was touched it acted as resistance for a month while a flag formed. The breakout occurred on the 5th week and oh what a breakout it was! Then look where it went on the long pullback… the 130 MA again. Took a little dip below it and then popped upward again. It did this 3 more times and then fell through and lost the 130 MA support. When it tried to go higher, on three occasions over the course of about 6 months, the 130 was the stopping point each time. (Hopefully you’re getting my point).
From about February this year AG has made quite a linear move from $5 to about $8.50, where it again hit the 130 MA resistance and has pulled back. Ideally, you want that red 20 EMA to hold as support, or at least the $7 mark. So that’s what I’m watching on the weekly.
Now here’s what I’d watch on the daily interval. You’ve got the 20 EMA here that has been a decent support area. Today’s candle should be telling because on the run this stock has had this year, any drop below the 20 EMA on the daily interval chart only lasted a day, so if it closes below today, it’s not a good omen unless you want cheaper prices. If it does move lower, watch the Fibonacci retracement levels which are the colored numbers to the far right of the chart, the 50 and 61.8% levels in particular. Also of note, the daily 130 MA is lingering just below the 50% retracement level, so you’ve got a double level of support, which, if it holds, should provide a very nice buying opportunity. If it does not hold and drops below the 61.8% level without showing much strength then I’d be getting concerned if I was long.
3 Likes
GOLD
A quick update for now. I feel fairly confident that gold will go higher from here based upon the way it has been toying with that uptrend line. It looks like it’s taunting traders to get short, having two breakdowns, one which proved to be false and the second playing out that way at the moment. It’s hanging right around that 50% retracement level so far. I’ll update probably this weekend, barring I stay away from mayonnaise (the cause of last weekend’s yuckiness).
5 Likes
Hey TR - thanks for the charts and all useful info provided. Johnny Mac~
2 Likes
Hi T-Rick …I have been on these boards for over 10+ years or more. I mostly stay on the sidelines as my writing skills sometimes lack compaired to some of our more educated posters.
I am one that reads and comprehends well they say, just lack writing skills.
So I DO enjoy reading all of these boards. The are very informative to my mind.
I find your posts to be amongst some of the best. I am but a small fish in this investing pond, but
have been in this pond since high school 1969 a teacher wanted to give us (kids) some
knowledge about compound interest, and compound debit. A great guy, schools need more like him.
He showed use the stock market page of the newspaper, and said to pick a couple and follow them.
My father Dad went farther and said "lets put some moneys into some of your picks.
So that was the start. I still try my educated luck. at the market once in a while… hell that’s why I still hold MDMN CDCH. Would love to know more on how it works… Just don’t have the time.
So when I see and read your postings, I feel like I have a better understanding of how the
racket works. So you get a big “YES” from me. Keep it coming. Ill read it all.
Take care… Dj.
2 Likes
I have no idea with regards to charts but I appreciate your renewed enthusiasm. I will look forward to your postings once M/C is worthy.
McEwen Mining Reports Q2 2018 Production Results
4 Likes
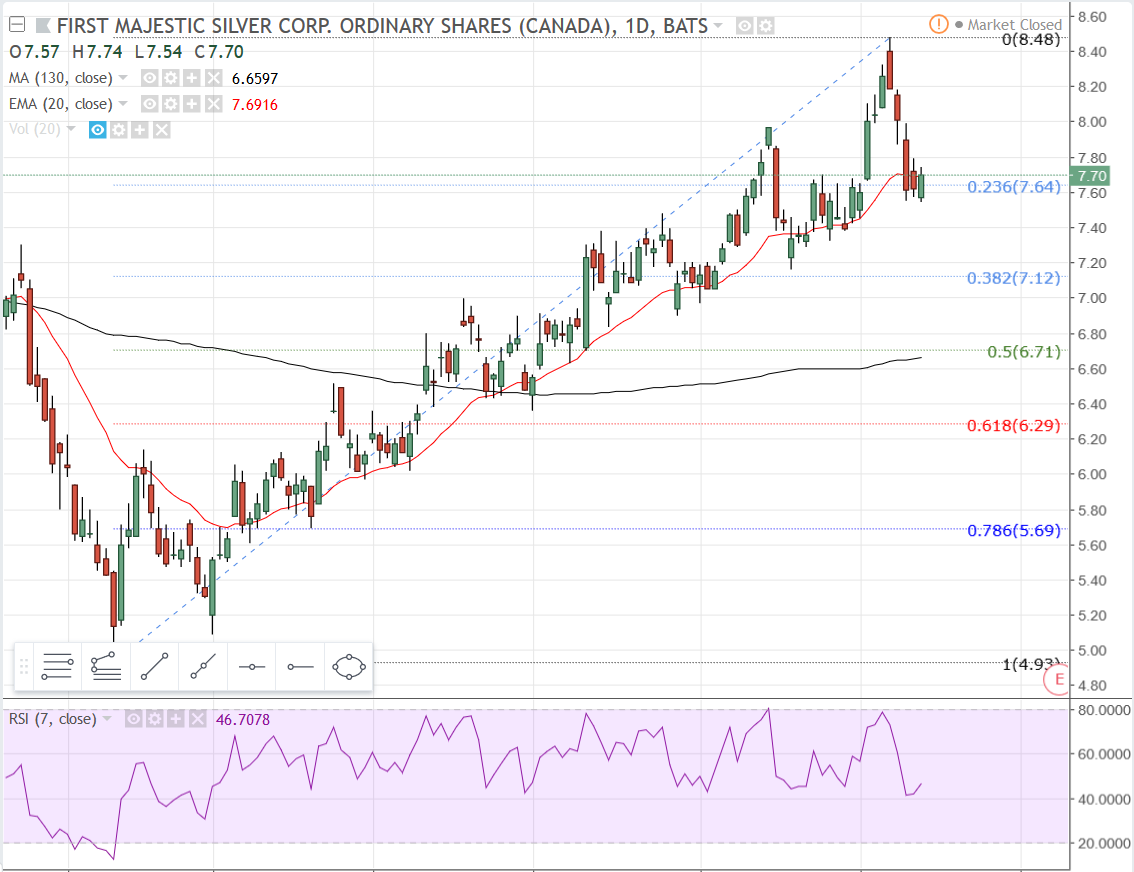
AG Update
Nothing new to report on the weekly interval. Price is sandwiched between the 130 MA and 20 EMA in a range between 8.32 and 7.13.
On the daily interval it appears to be repeating what it has consistently done since it got back above (for the most part) the red 20 EMA. It teases a break of support only to turn around and make new highs. I don’t know how long this pattern will continue, but the formation of the last two candles is consistent with what it has done on the previous three lows, where it looks like it makes a bear flag and then moves higher out of it. Silver futures are up a little this morning, so perhaps that bodes well here.
If there is a drop lower, the last swing low was right around where the 38% retracement sits, and below that is the 130 MA a smidge below the 50% retracement.
2 Likes
Gold Futures (GC)
Here is a weekly interval chart of gold. What is interesting to me is that the uptrend line now appears to have become resistance this week. Are we headed for the 62% retracement? I don’t know but that RSI indicator at the bottom of the chart is pretty low. Perhaps I’m being too optimistic, but I still think this price action is to get bears loading up only to take them out and squeeze them higher. Otherwise, watch for the 62% retracement level.

I’m not going to post the daily interval, but the RSI is showing divergence, another sign of potential reversal, in this case higher prices. We’ll see.
3 Likes
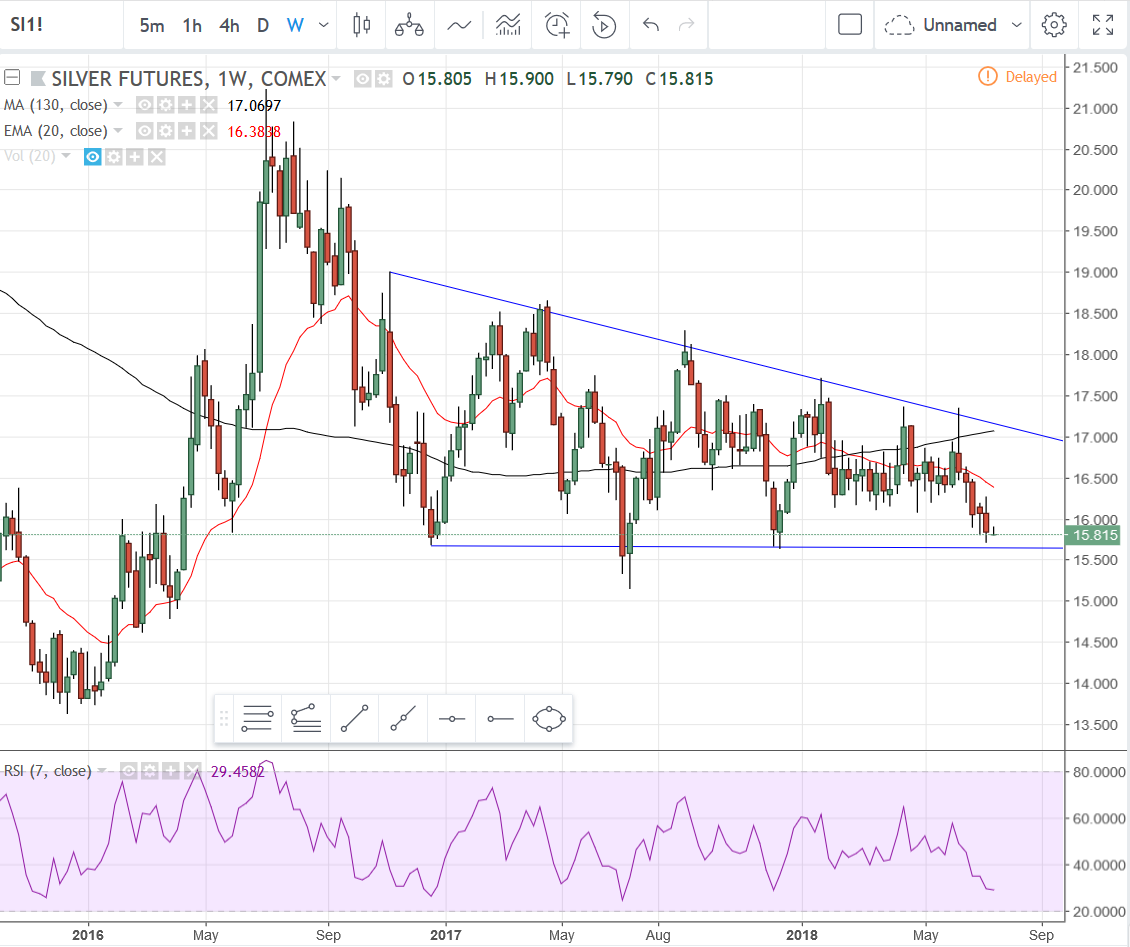
Silver Futures (SI)
This is the weekly interval for silver futures. Silver has become incredibly boring. A few years ago I traded it exclusively and was doing very well, and then they raised the margin to such preposterous levels that all of the relatively “little guys” like myself gave it the finger and moved on. Now it’s not worth much of anything for trading, even though the margins have been dropped to more reasonable levels.
This weekly interval chart is showing a long narrow price consolidation with 15.50 basically being the floor. This formation within the blue trend lines makes me think it’s a bit of a bullish wedge formation, in which case there will be an eventual launch back to previous highs at $20 - $21, but there is so much price manipulation in gold and silver that it’s hard for me to literally bet on it.
4 Likes
TR - love this type of lesson. Tks, Johnny
1 Like
The weekly interval MUX chart looks like it might be ready to make a move higher out of a flag formation. The black downtrend line looks to be potential support now along with the red 20 EMA turning upwards just below the trend line. Now we watch those support levels along with the three grey overhead resistance lines at 2.32, 2.43, and 2.55, along with the blue long-term downtrend line.
3 Likes