Thanks, that’s a huge help!
Anyone following this story on Gold and repatriation to Germany ahead of schedule?
Short Kitco story and Rickards interview video:
‘Weird’ Things Happening In Gold, Expert Sounds the Alarm
Aug 30, 2017
Guest(s): James Rickards
Two unusual stories are unfolding for gold – one strange and the other truly weird, this according to bestselling author Jim Rickards. “These stories explain why gold is not just money but is the most politicized form of money,” Rickards, the author of Currency Wars, said. “They show that while politicians publicly disparage gold, they quietly pay close attention to it,” he added. The first strange gold story involves Germany and its repatriation of gold from New York and Paris. Rickards explained how this move was much more political than anything. The second weird event for Rickards is Treasury Secretary Steve Mnuchin’s visit to Fort Knox. After Mnuchin tweeted that all $200 billion dollars worth of gold is still there, Rickards said a few red flags went up for him. “Mnuchin is only the third Treasury secretary in history ever to visit Fort Knox and this was the first official visit from Washington, D.C., since 1974. The U.S. government likes to ignore gold and not draw attention to it. So why an impromptu visit by Mnuchin.”
Videos
Rickards explains how this affects the gold market and price of gold.
Re the surge in gold, copper, etc: It isn’t just gold, silver, copper, it’s the entire commodity complex. Why? Because the dollar has fallen so rapidly in relation to the Euro and Yen. If the dollar falls, money knows the commodities priced in dollars will rise in dollar terms, so get out of dollars and into commodities. Interestingly even with bounces in the USD the past couple of days, the commodities have held steady or continued to rise. The $CRB commodity index shows the sudden move:
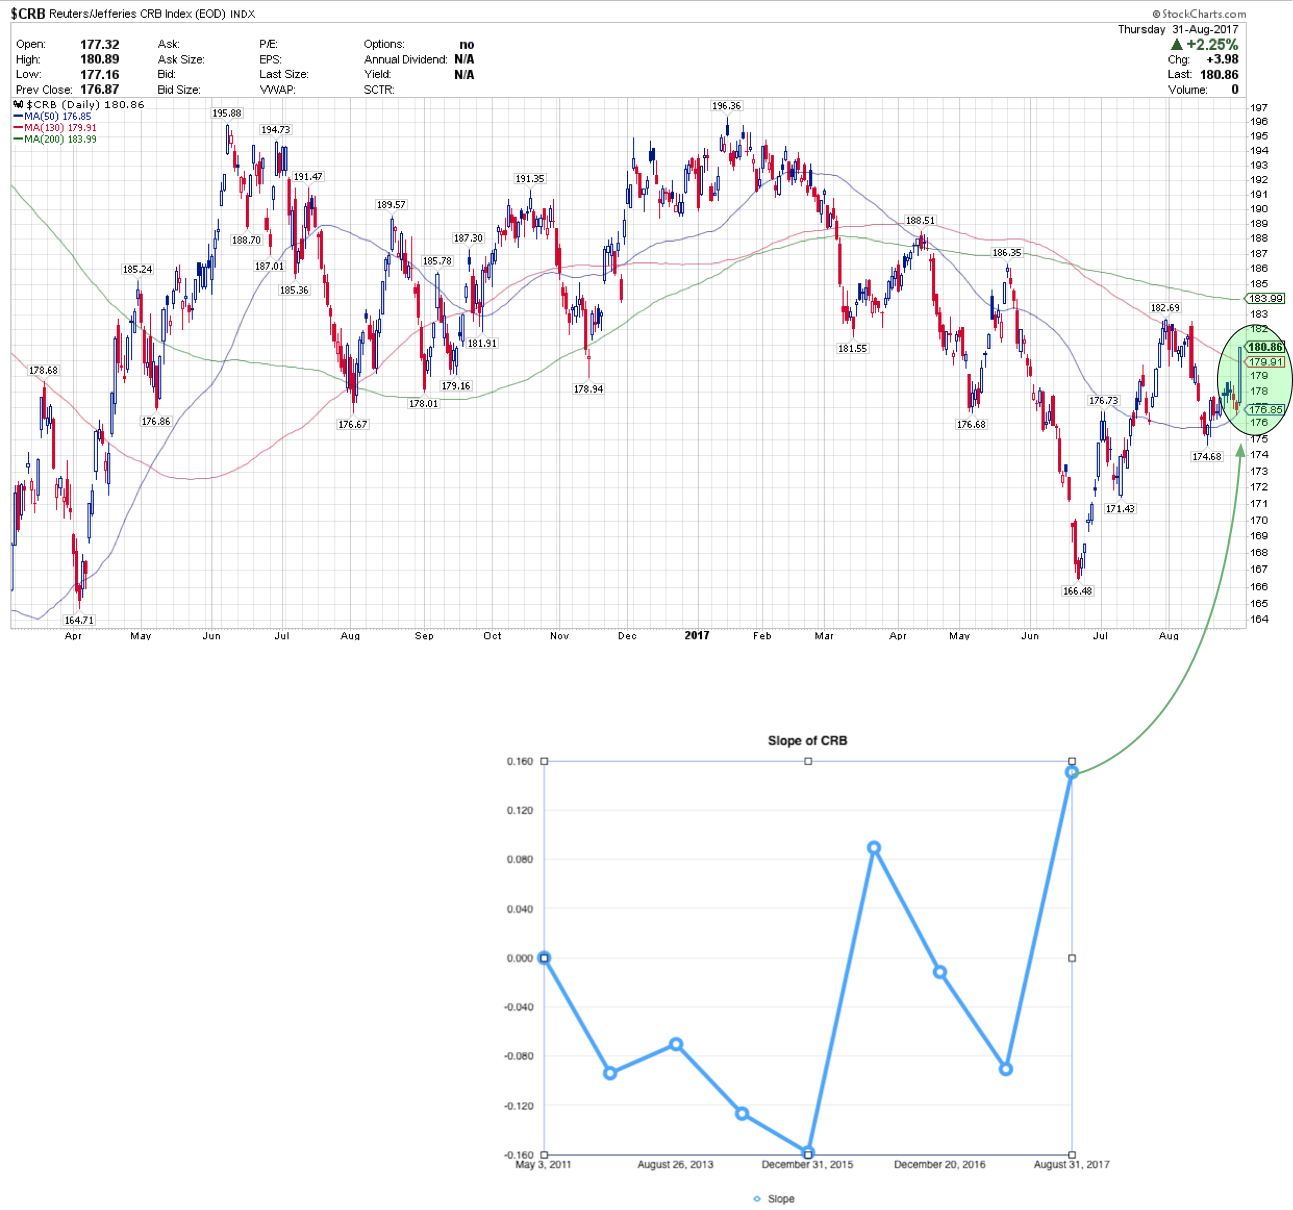
The bottom chart is a chart of the slope of the $CRB index which I’ve kept for the past several years since part way into the post-2011 commodity crash. Negative numbers mean commodities are falling, positive numbers mean they are rising. This is by far the strongest positive move we have seen since 2011. It is possible this is the breaking point of the downward post-2011 trend and that the end of 2015 was truly the bottom and we just confirmed it in June 2017 and have now bounced off of it.
FISHING FOR ALTERNATIVE EXPLANATIONS:
-
If this bounce is based upon macro economic conditions then it won’t last long most likely. The demographic and debt burdened western economies are almost certain to not show any new sustained major new growth driving demand for commodities.
-
However, an alternative interpretation is that the fantastic monetary inflation caused by post-2009 QE, and heretofore contained in the worlds of equities and bonds and high-end real estate, could start to leak out of those domains and start a price inflation in commodities even without increasing commodity demand just because money is afraid the other markets have maxed out and there is less risk in owning commodity assets.
If this is some type of large Chinese trade / financial system unwind then beware of what happens on the other side in a month or two. This could be a giant head fake.
1 Like
Agreed CHG. Either way, post QE risks and US dollar weakening is a major reason I like the idea of being diversified in Canadian and Australian commodities and exchanges. There is wide monetary system turbulence as you noticed early last year.
I posted a couple articles on the “old site” last year that is now archived in tapatalk where your old logins still work (https://www.tapatalk.com/groups/theminingplay/general-discussion-april-2016-t103.html). There were quite a few posts of interest that signaled a couple of important changes in the currencies and gold markets that may be coming to fruition. Apologies for the long posts here, but hopefully everyone is following all this and staying diversified with events occurring outside the US. Here are a couple of the more important posts with links:
From Apr. 7, 2016:
Will April 19 begin a new era for price setting in the PM market?
A couple of articles that may interest a few here:
Shanghai Shock April 19, 2016: Yuan Based Gold Standard
Shanghai Shock April 19, 2016: Yuan Based Gold Standard. – Political Vel Craft
How Much Will the Shanghai Exchange Effect Silver?
http://www.silverdoctors.com/silver/silver-news/how-much-will-the-shanghai-exchange-effect-silver/
From Apr 15, 2016 - Excerpt from another article commenting on the SGE and London Gold Fix:
Will the SGE gold benchmark fix the fix
https://www.sharpspixley.com/articles/lawrie-williams-will-the-sge-gold-benchmark-fix-the-fix_248398.html
…Will this change the gold market – probably not in any significant way initially, but it may well lead to a system which gradually drags price initiation away from the COMEX paper gold market, which can only be positive for the gold sector. However, as we have noted before, the vast majority of the SGE benchmarking members are Chinese, and thus effectively state-controlled, which could make market manipulation to an agenda which suits the Chinese government, whatever that may be, a distinct worry as far as the international financial community is concerned. For example, with China currently seen to be building its gold reserves it may suit the Chinese to hold prices back while it is so doing, but once it has achieved its reserve objective it might then suit it to see prices rise – perhaps sharply. To those who believe the LBMA gold price is something of a fix already then this could be out of the frying pan into the fire. But then governments are always totally honest with their announcements and data aren’t they?! So no worries there then!
With gold on the move last summer I posted this very informative link:
Five Signs of China’s Growing Influence in the World Gold Market
And July 30 last year this was posted which all ties in the world currency uncertainties and the Fed, Central banks balance sheets, IMO.
Fund Manager Warns Japanese Launch of Physical Gold Exchange Is Signaling The End Game
Posted on July 29, 2016 by The Doc
Japan announced last week that its TOCOM commodity exchange would begin trading physical gold – like the Shanghai Gold Exchange – on July 25th.
The news of this event was largely muted in the western financial media and even the alternative media blogosphere largely seems to have overlooked the news release. But this is a highly significant development because it signals a subtle shift in Japan’s economic and monetary focus from west to east.
It will also create an big upward price-readjustment in gold and silver…
Submitted by PM Fund Manager Dave Kranzler, IRD:
On a side-note, it’s important to know that late July/early August is seasonally the most quiet part of the year for the biggest eastern hemisphere gold accumulators. And we’re going into the “roll” period, when the bulk of the massive blob of August paper gold “rolls” into December, the next “front month” for Comex Paper gold. Having said that, China has actually slightly increased its gold imports this month. India has been in hibernation since March 1 but it’s biggest seasonal buying period starts in about four weeks. Unless smuggled gold into India is significantly greater in volume than anyone understands, India’s demand will be somewhat price inelastic and its elephantine appetite for gold will have a big impact on the price of gold.
This leads us to Japan. Curiously, Japan announced last week that its TOCOM Untitled commodity exchange (Japan’s less corrupted CME-equivalent) would begin trading physical gold – like the Shanghai Gold Exchange – on July 25th – TOCOM Physical Gold. It also announced that it would be introducing a delivery-at-settlement option for its current-month gold futures contract. That is, TOCOM gold futures buyers will now have the ability to take delivery of physical gold via TOCOM’s paper gold.
The news of this event was largely muted in the western financial media and even the alternative media blogosphere largely seems to have overlooked the news release. But this is a highly significant development because it signals a subtle shift in Japan’s economic and monetary focus from west to east. It will also create an big upward price-readjustment in gold and silver.
The significance of Japan’s TOCOM exchange shifting from all fiat paper contracts to a physical gold trading and settlement operation is reinforced by the fact that two days ahead of the announcement it was reported that Tanaka Kikinzoku Group – Japan’s leading precious metals trader, refiner and manufacturer – acquired Swiss-based Metalor Group, one of the world’s largest refiners and supplier of precious metals-related products – Tanaka Buys Metalor. Furthermore, in March 2015, Japan’s Asahi Holdings – a collector and refiner of precious metals – closed its acquisition of Johnson Matthey’s gold and silver refining business. JM is one of the leading producers of refined precious metals products, including LBMA-quality 400 oz gold bars.
Now that Asia and Russia are no longer funding the U.S. Treasury debt printing press, the Fed will be forced to begin hyperinflating the money supply to keep the Government funded. This fact is underscored by the Cleveland Fed President’s – Loretta Mester, a voting member of the FOMC – recent comment about “helicopter money.”
While the Japanese continue to endorse the U.S. Government’s use of the yen as a de facto printing press which enables the Fed to manipulate the U.S. stock market and to fund U.S. Treasury’s unrestricted issuance of debt, they see the proverbial writing on the wall for the western monetary and financial system. Japan has been quietly pivoting economically toward China for a couple years.
This abrupt transition into the physical precious metals market signals Japan’s move to integrate its financial markets and economic system into the developing eastern bloc monetary system, which **appears as if it might eventually be seeded in gold. It likely signals the end-game for the United States.
http://www.silverdoctors.com/gold/gold-news/japan-is-signalling-the-end-game/
Hopefully those that can still log into the old site, even though it does not appear to still be active, will review some of the thoughts and information posted there. The IMF through the allocation of SDRs exchange rates of the five major reserve currencies were based on a fixed weight of Gold. That has actually changed and significantly affects International trade of major corporations and thus commodity prices. Note that SDRs are not currency, but a “Special Drawing Right” for the use of currencies of the IMF members in world trade and financial systems. The IMF adopted a new weighting formula in 2015 that was revealed Oct. 1 last year (2016) with the Chinese renminbi at 10.92% While China continues to accumulate gold, with the next SDR allocation change not scheduled until 2021:
http://www.imf.org/en/About/Factsheets/Sheets/2016/08/01/14/51/Special-Drawing-Right-SDR
“The number of voluntary SDR trading arrangements now stands at 32, including 19 new arrangements since the 2009 SDR allocations.”
Why? Does this tie in with Germany and its repatriation of gold from New York and Paris ahead of schedule? Completion of the returning gold was originally 2020. Is this timed for Germany’s elections? Is the EU taking a stronghold position on the post Brexit negotiations in Brussels that have gone poorly with no real progress? Is it an arrangement with the IMF to dial back use of the dollar in world trade? China is playing the “long game” with a focus of dominating trade with a reserve currency strongly backed with gold. It is all of the above, IMO. Politics is behind much of what is occurring in more than just the US. Uncertainty is worldwide.
Inventus Mining (IVS. And GNGXF) showing a bit of interest today and the last couple o weeks on the heels of another non-brokered private placement ($500K) by Rob McEwen that had very fair and favorable terms to Inventus shareholders. We’re still waiting to see who bought the other half of the $1 million private placement…perhaps Sprott or Osisko adding to their ownership positions.
GNGXF is up to .1855 (up 47% for the week) and V.IVS is up to .225 on 260k traded this morning. That’s considered very good volume on this lightly traded issue. Based on history, it smells like news is in the offing.
1 Like
What grabbed me is that during their initial bulk sampling program gravimetric concentration resulted in reduction to 2.7% of the original mass with a 68.8% of the gold content recovered. They felt this could be improved upon using additional sorting before refining the recovered/debulked ore. IVS.V shows a +19.83% just this morning on that 260k volume.
1 Like
Here’s a monthly interval chart of oil futures. See anything interesting?
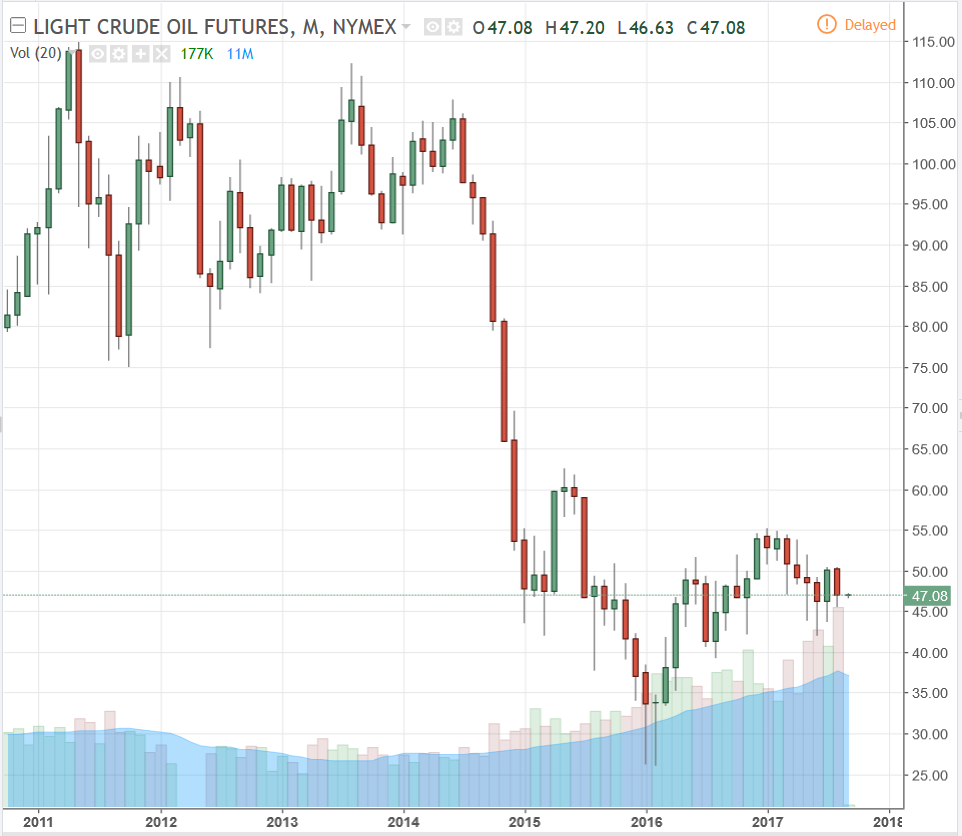
Here, let me help you out…
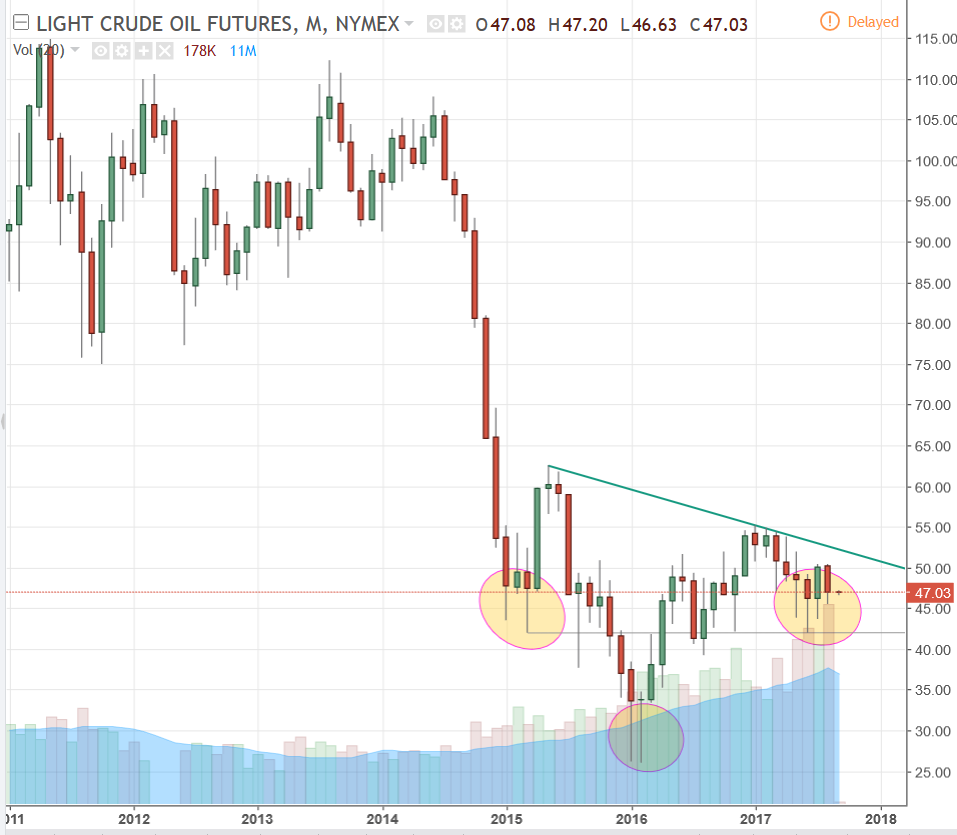
It’s an inverted head & shoulders formation which is bullish. The only thing I don’t like about it is that it would be much nicer if the green line, the “neck line”, were straight across instead of sloped.
If the formation proves true we’ll be seeing oil prices back in the upper 70’s within a year. Note I said within A year, not THE year. I’ll update if the formation proves wrong.
2 Likes
Not to be too speculative here, but if one follows what Jim Rickards has been saying lately, the IMF may well revise how it handles SDRs much sooner (this year?) than the reallocation for members scheduled for 2021. He has predicted changes for this year which would favor other currencies in the “basket of currencies” used for world trade which would further weaken the dollar as countries cash out of their dollar denominated reserves.
IVS.V finished up 23% at the high of day (.23) on volume of 465K…which is significant volume for Inventus. Kaiser Research issued a “Bottom Fish” Recommendation Strategy for Inventus on Thursday which may have contributed to today’s price action.
1 Like
These stocks can be very volatile.
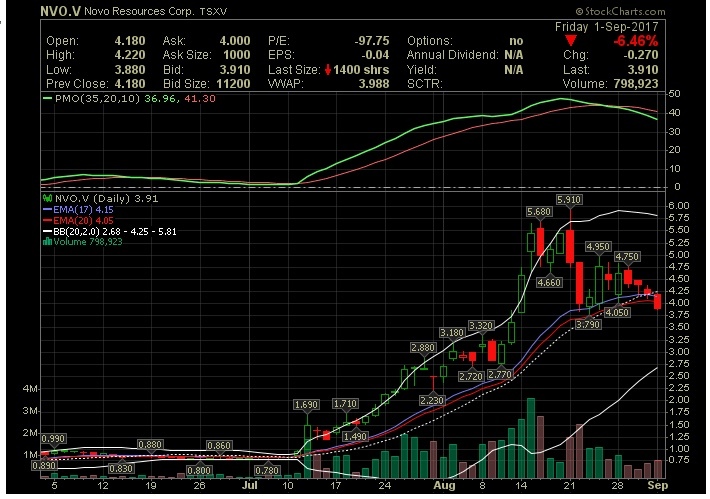
TORONTO, Sept. 1, 2017 /CNW/ - Newmont Canada FN Holdings ULC (“Newmont Canada”) announced that on August 31, 2017 it sold 11,830,268 common shares (“Shares”) in the capital of Novo Resources Corp. (“Novo”) (TSX.V:NVO) representing approximately 9.9% of the total Shares outstanding through a private agreement for proceeds totalling CDN$18,928,428.80 or CDN$1.60per Share. Newmont Canada’s percentage ownership of Shares reduced from approximately 14.9% (17,760,000 Shares) to approximately 5.0% (5,929,732 Common Shares) as a result of the transaction.
Newmont Canada has no current intention to acquire any Shares, but may, depending on market and other conditions, acquire beneficial ownership or control of the Shares or other securities of Novo whether through market transactions, private agreements, treasury issuances, exercise of convertible securities or otherwise.
Neither TSX Venture Exchange nor its Regulation Services Provider (as that term is defined in policies of the TSX Venture Exchange) accepts responsibility for the adequacy or accuracy of this release.
SOURCE NEWMONT CANADA FN HOLDINGS ULC
Gold will go up again this week, North Korea just conducted a sixth nuclear test.
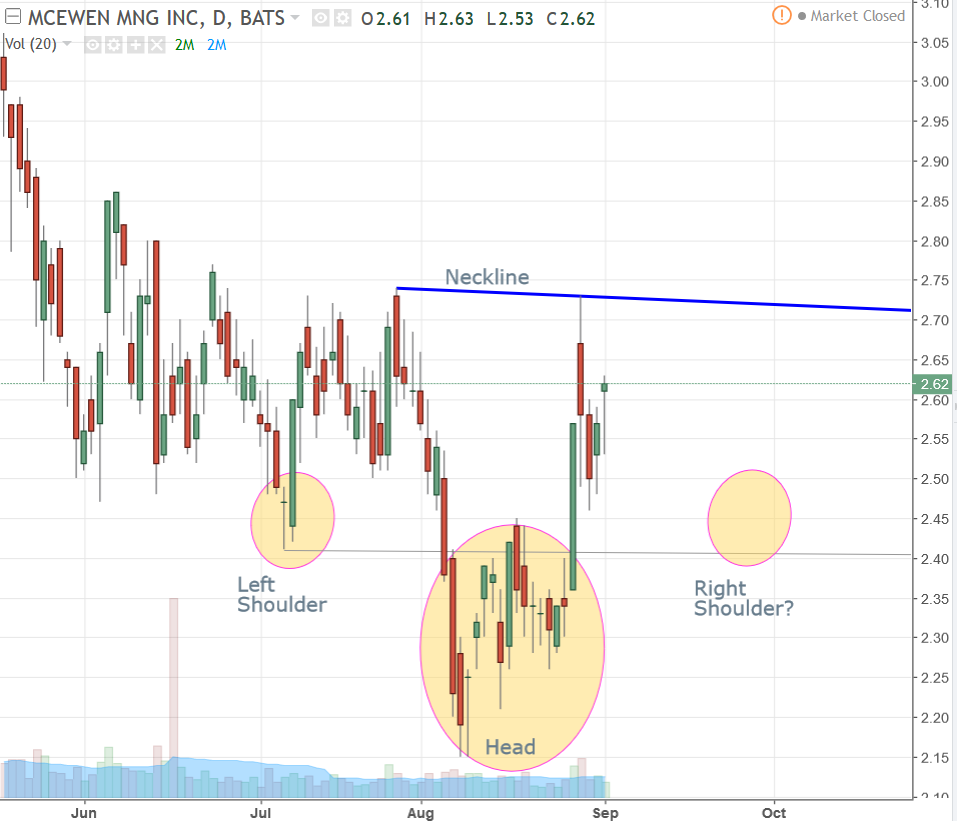
MUX inverted Head & Shoulders?
This is fairly thin speculation but something to keep an eye on just in case. The chart is a daily interval and I’ve highlighted what I’m seeing. This is far from being the prettiest inverted head & shoulders formation I’ve seen, but there is enough potential to point it out. I wouldn’t be putting any significant money on it, especially since I’m projecting the potential for a formation which hasn’t even finished forming yet. What you want to watch for now is for that right shoulder to form on a drop that would ideally occur right around the last week in September or the first days of October. Then a move up to the neckline which occurs on, preferably, higher than average volume. Increased volume on the formation of the right shoulder is important as it’s a major aspect that legitimizes the head & shoulders formation.I’ll update as long as something new doesn’t come into my life to pull me away.
Awesome. Definitely something I’ll keep my eye on.
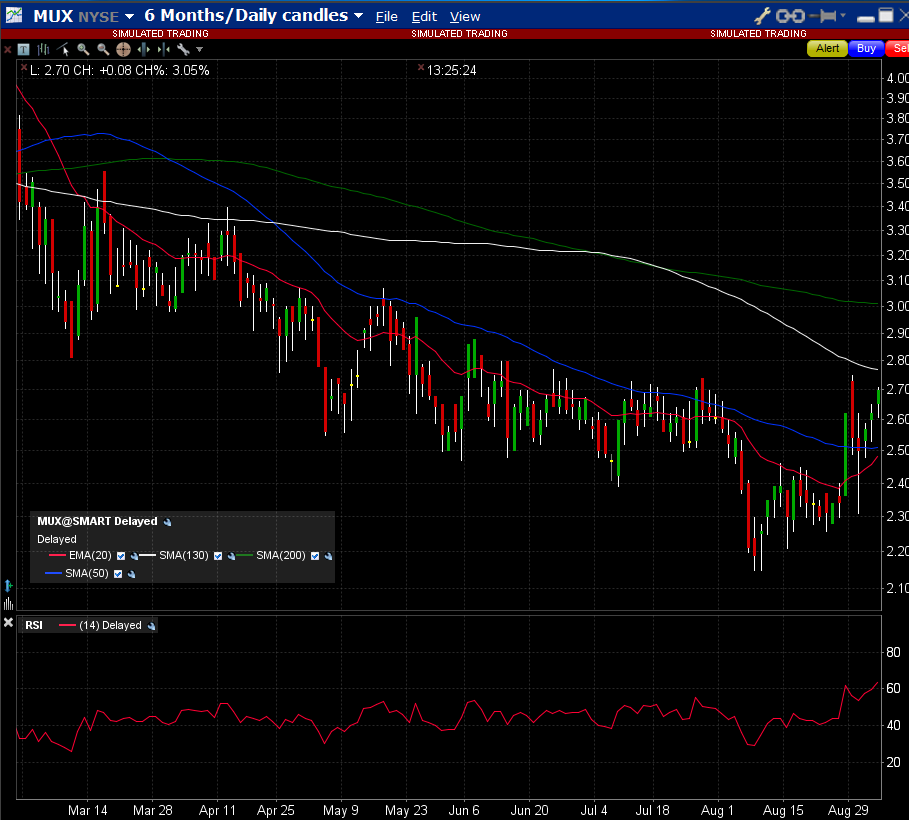
More MUX
This is a daily interval with my favorite moving averages.The red 20 ema is turning north and soon to cross up over the blue 50 ma. For now MUX is finding resistance at the white 130 ma which, if you follow it to the left of the chart, has been the point of resistance where MUX pulls back from each time it has tested it since early March/late April. The green moving average above is the 200 ma, which will probably offer some resistance initially if MUX makes it that high on this current push.
1 Like
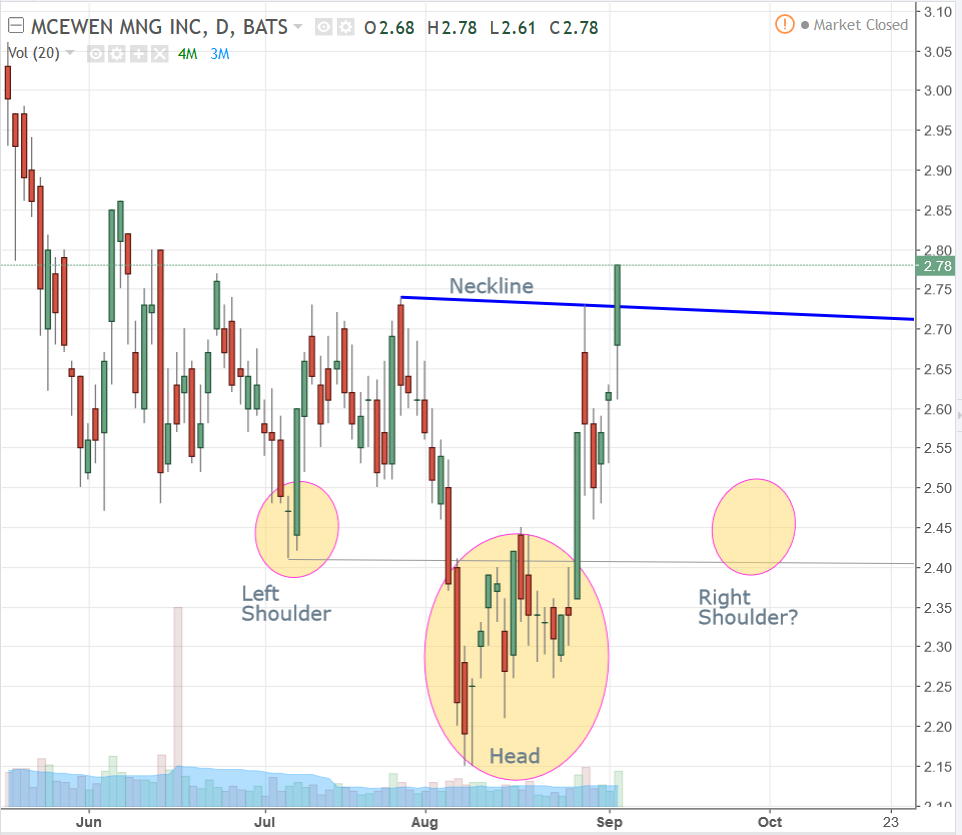
MUX closed above the neckline from the head and shoulders chart I posted. Not likely for that formation to play out now. FYI, if you look at the chart I posted earlier today, MUX closed right at the white 130 ma. Tomorrow will be interesting. Will the MA be resistance and drop the stock from here, or will it blow right through it tomorrow? Stay tuned.
1 Like
Barkerville drills 11.55 m of 53.26 g/t Au at Cariboo
A previously unidentified corridor of high tenor veining has been discovered in Phase II drillhole IM-17-131 which intersected 53.26 g/t Au over 11.55 metres in the Shaft Zone at a vertical depth of 400 metres below surface. This infill drilling discovery is situated 12 metres below drillhole IM-17-138.
Further downhole, IM-17-131 also intersected 12.85 g/t Au over 20.00 metres which correlates spatially very well with IM-17-138 having intersected 6.67 g/t Au over 17.10 metres. These new intersections are situated proximal to previously reported drillholes IM-17-124, 18.84 g/t Au over 30.85 metres and IM-17-078, 11.42 g/t Au over 28.55 metres.
Additional new mineralization was also discovered by IM-17-138 grading 9.18 g/t Au over 7.40 metres at a vertical depth of 600 metres below surface. These wide corridors of sandstone hosted veining are open for expansion in all directions.
2 Likes
This is a monthly interval chart of gold futures. For those of you who want a simple opinion without all the in-depth explanation, what this chart is showing me is that gold is nearing some major resistance just below 1360 and that it’s probably due for a pullback. For a long-term investment it’s probably not a bad buy, but if I’m a buyer this chart is telling me that if I am patient there’s some decent evidence that I’ll be able to buy at least $40 - $50 lower later this month or next month. For those of you who want more depth, here you go…
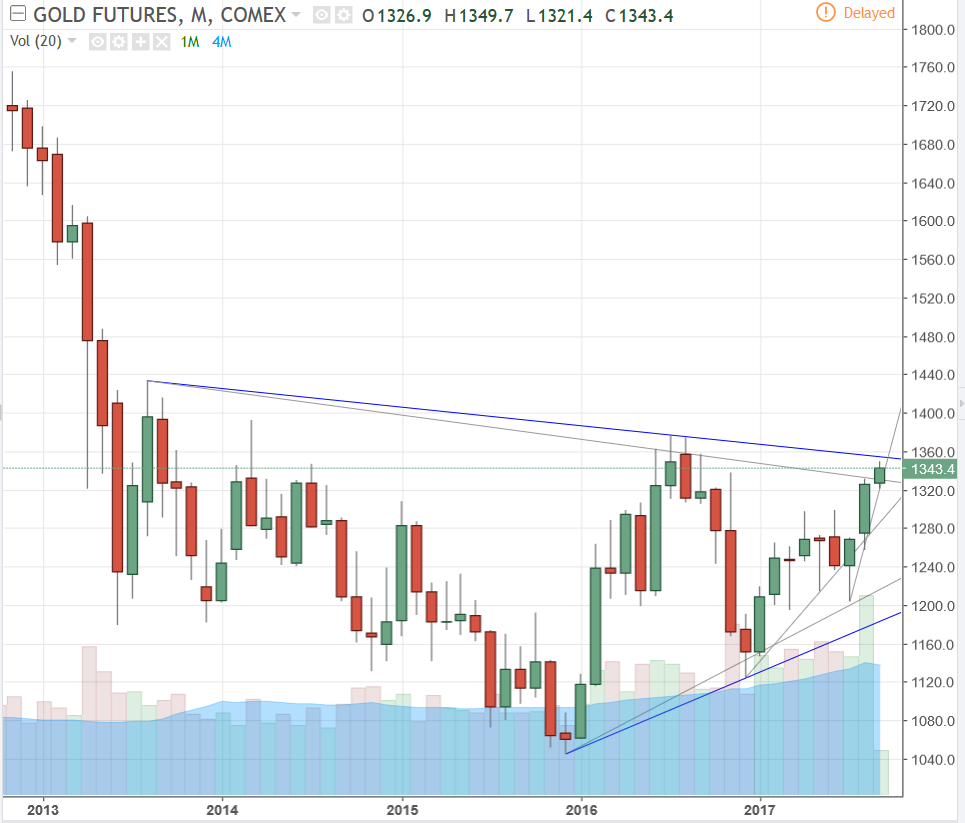
All this chart shows is what I call major and minor trend lines. The majors are in blue, the minors are grey. When the majors are breached I look at it as a major breakout or breakdown in support or resistance, obviously based upon which direction the price is going. The minor trend lines are used as areas of support/resistance to keep an eye on. I think if you study each line closely it’s fairly simple to see what I’m doing, but it probably helps to know that sometimes drawing trend lines off of the candle bodies, which is the colored part, and kind of ignoring the wicks, can offer some useful information. This can be done on any time frame and is very useful for finding “hidden” areas of support and resistance. It also points out the importance of patience and not being sucked into taking a position one way or another just because a trend line gets broken right away. Always wait for a candle to be completed instead of speculating and jumping to conclusions. Even then, as this chart illustrates, price movement isn’t going to go the way you think just because a trend line is breached.
Anywho, there’s actually a lot of info to be gleaned from this chart. The most obvious is that the price of gold is nearing overhead resistance of that upper blue major downtrend line. Secondly, if you look at the grey minor downtrend line where last month’s candle found resistance, this month’s candle has thus far pushed through it after opening below it. Now, as I wrote about in the first paragraph, you have to keep in mind that this is a monthly interval, which means that the current candle, although bullish looking right now, still has three weeks of price movement to go through before you’re going to get the true story from it. What could very well happen is that gold hits the major resistance line and drops so that, by the end of the month, that candle could be a long, red, bearish one. If that were to happen, then what is currently a little green candle body would be a wick, and when I do my analysis on it my comment would be that price pushed up through the minor downtrend resistance line but that that line is still relevant because the entire candle body ended up closing below that line. In other words, as far as anyone knows, this current price movement of gold could be a suckers rally that baits in bulls and then traps them in a situation where it would end up that they bought high. It’ll be very interesting to see where gold ends up by the end of this month. Ultimately I don’t know what it is going to do. My long-term bet is bullish on gold, but I wouldn’t be surprised if this current month’s candle ends up red with what is the current short green candle body being reduced to a wick. I’ll follow up on it if I am able.
Another thing for anyone who is interested… Notice that there are four uptrend lines and that each newer line, (the shorter it is the newer), has a higher angle. This supports a bullish view of gold, but it is also at least a short term indication that gold could be in for a pullback. Too high, too fast is usually not a good thing in the markets because “what goes up (usually) comes down”… and at the same or faster rate than it went up." You can see that each of the minor uptrend lines have been breached, so again it is important to wait for the candle to complete before using it to make any determinations.
Please keep in mind that in spite of all I’ve written above, I could just as easily be wrong and gold hits 1500 next week! So if you should choose to make investment decisions based upon these posts, I accept no responsibility if you lose money… or even if you make money.
3 Likes
Leon, ANX was an interesting “recommendation” from last summer. It had a nice move today, some interesting drill results from summer.
Even more interesting was the “most undervalued gold mining stocks” blog link you provided.
Anyone else make use of this link from last summer?
Hey Rich, stay safe in FL, or rather, get a move on outta there.
Thanks Rick. No worries here. Current projections show us only getting brushed by the very edge of it. We’re flexible and mobile enough to get out if necessary.