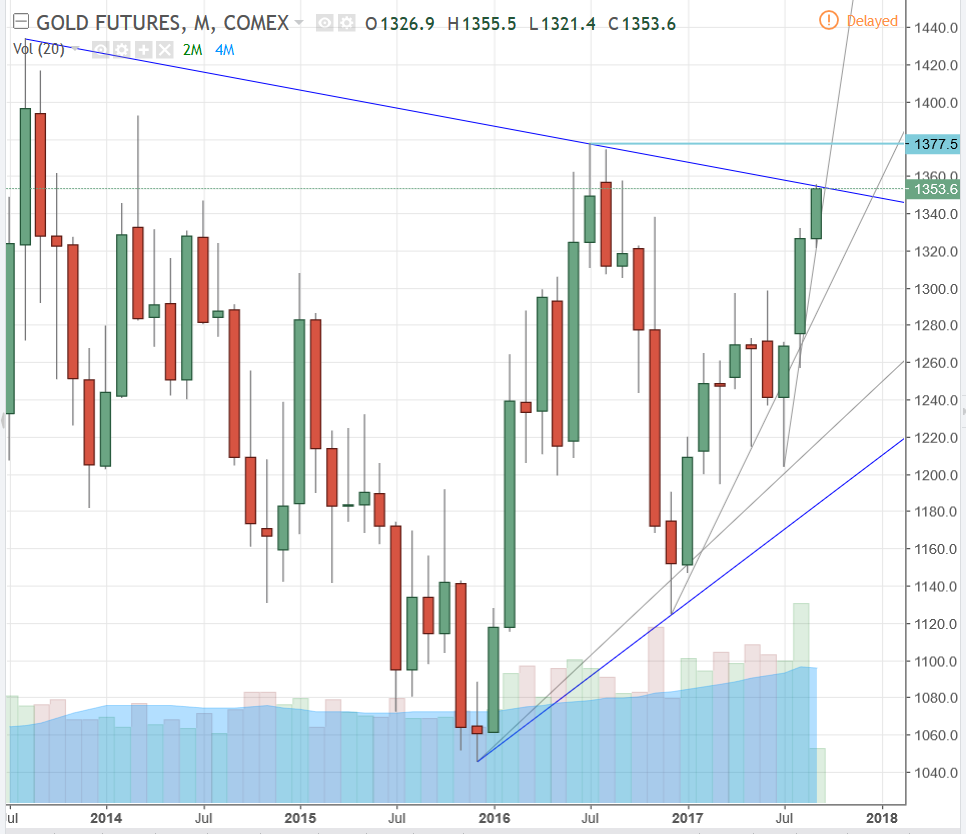
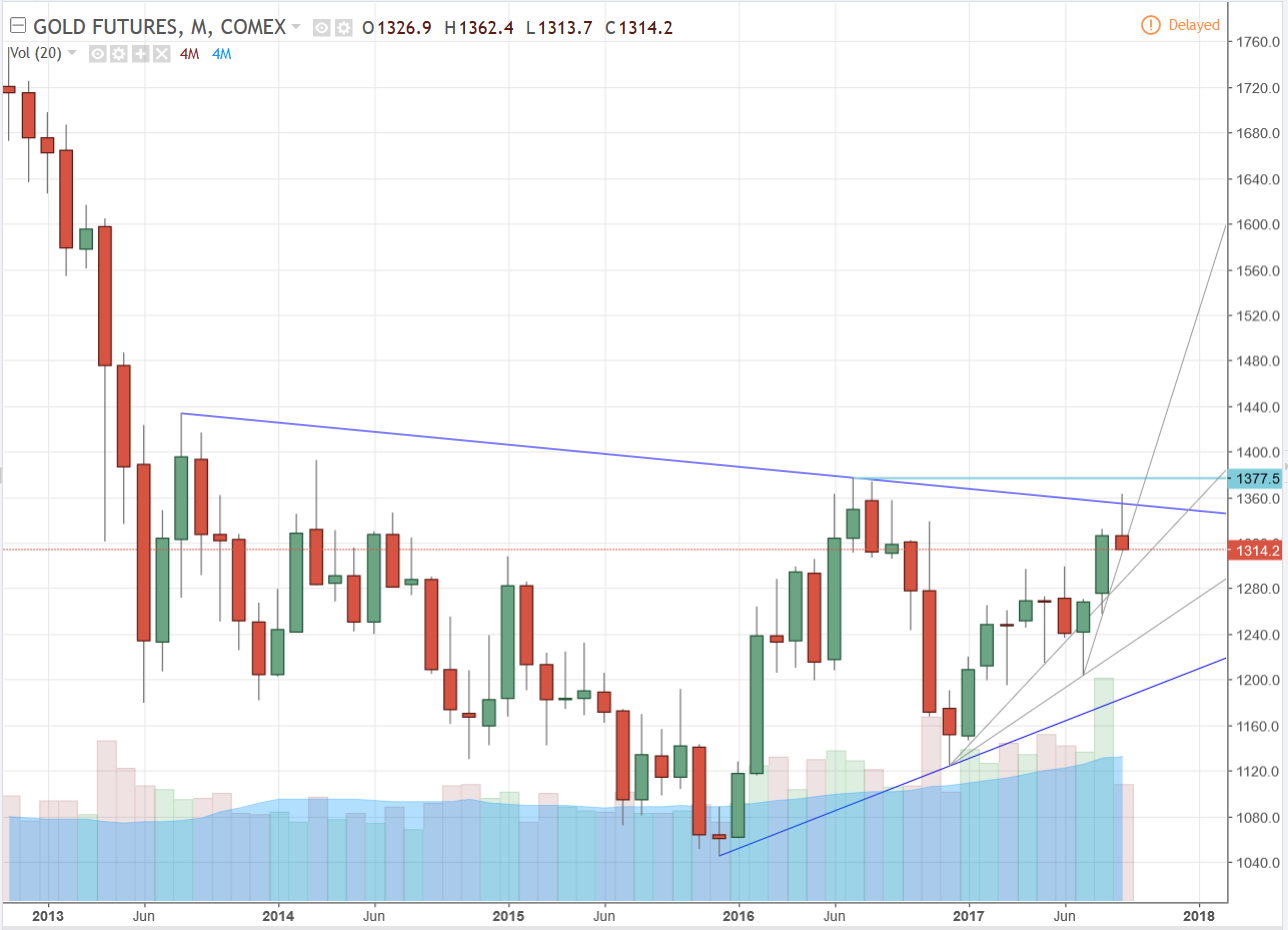
Here’s a magnified update of the monthly gold chart I posted this morning. Gold moved up today and tested the major downtrend line, (overhead resistance), perfectly. It’ll be interesting now to see how this candle ends up at the end of the month. The angle of that shortest uptrend line is so steep that I don’t think it will maintain support next month, but then again there is the potential for such bad news out there that this angle could stay as support for some time to come. Guess we’ll just have to wait to find out.
Hey folks, I’ve had a couple PM’s and calls so I decided it would probably be the considerate thing to put up a post for anyone who has any interest or concern in regards to my growing relationship with Irma. She’s only projected to be a cat 1 or 2 by the time she reaches my area, so anyone who has concerns, thanks but no need. Wind surges are likely to be in the 70’s - 80’s and this house had handled those fine several times during my time here. In the event that things get worse I have a neighbor whose house is built like a concrete bunker and they offered to take us in if needed.
If I lose power, and it’s increasingly likely after Saturday evening, it may take days or more than a week, but when I’m back up I’ll catch up with the charts.
Thanks to those who have shared concerns or do so in the future. I’m quite confident that I’ll be fine and back to same-o, same-o soon enough.
Take care!
8 Likes
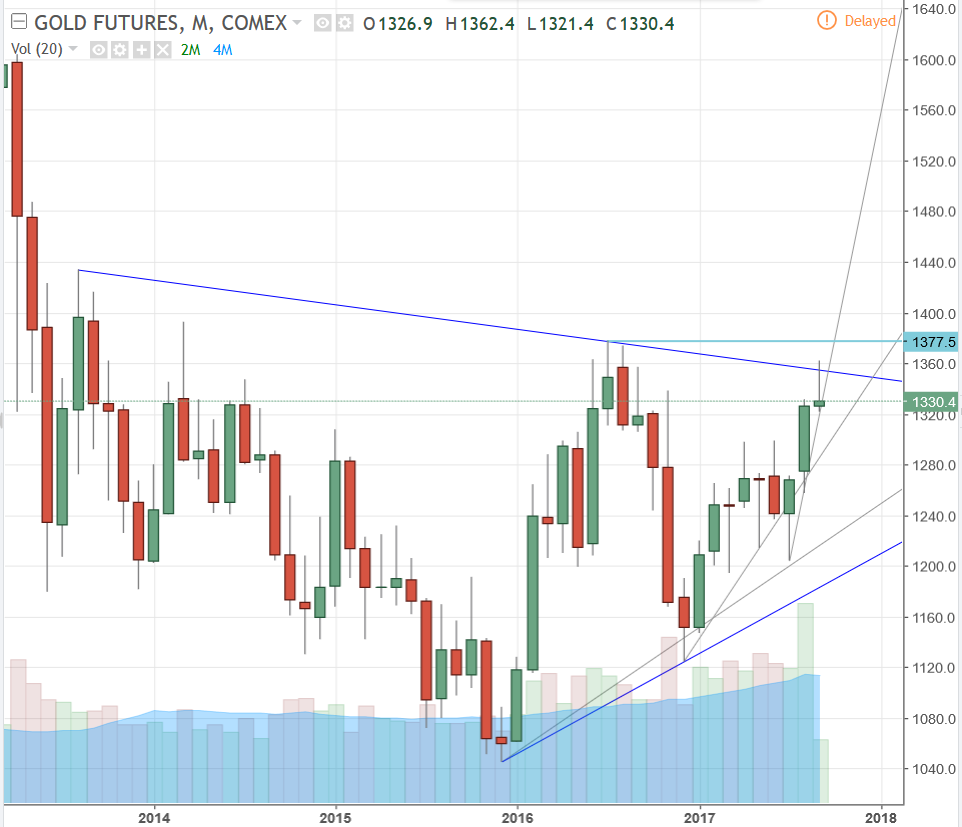
Here’s an update of the monthly gold futures chart. Back down below that major resistance line… for now.
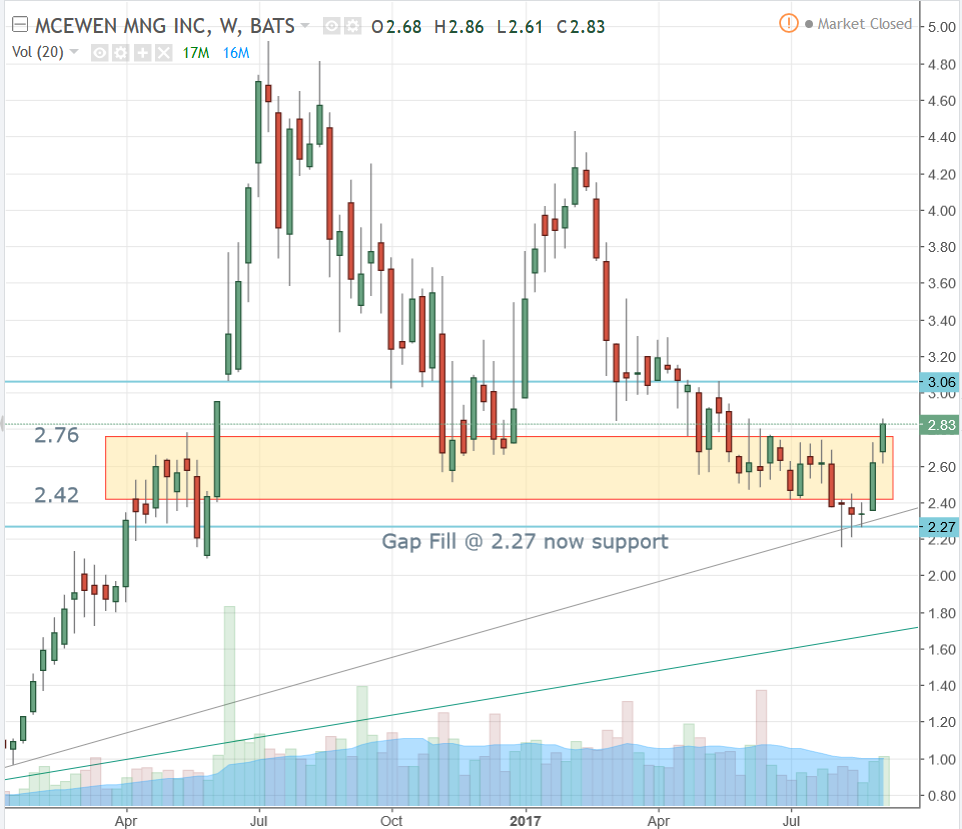
Here’s an update to the weekly MUX chart. MUX closed above the top of the resistance zone at 2.76. Next resistance to get through looks to me like 3.06.
Here is an update to the monthly gold chart…
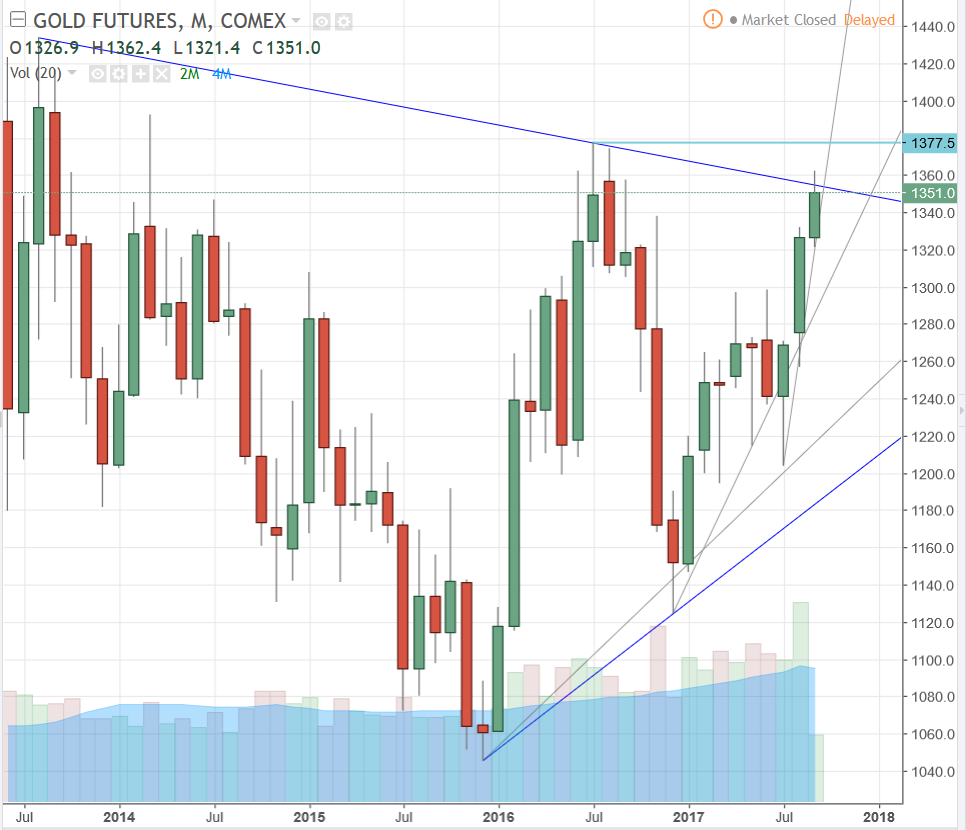
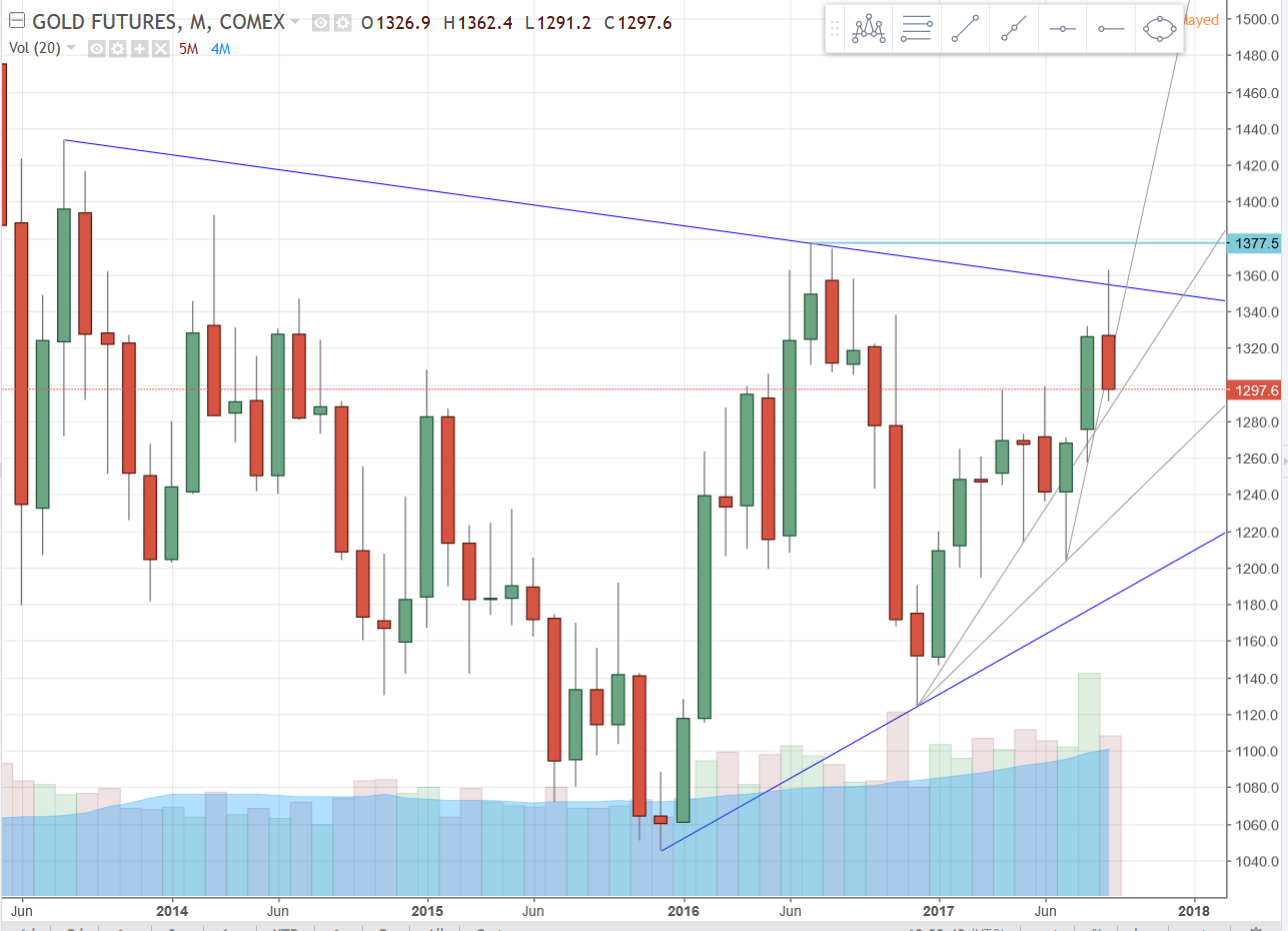
Gold penetrated the blue overhead major resistance line and has since pulled back considerably. The next thing to watch for is the probable test of the first minor downtrend line which would bring this candle to its lowest price. Because this first minor trend line has such a steep incline it wouldn’t surprise me if gold eventually breaks down from the low of this current candle and at least tests the next minor uptrend line, which would be close to undoing three quarters of last month’s gains. But, for now, the first uptrend line is still intact so that’s where we’re at.
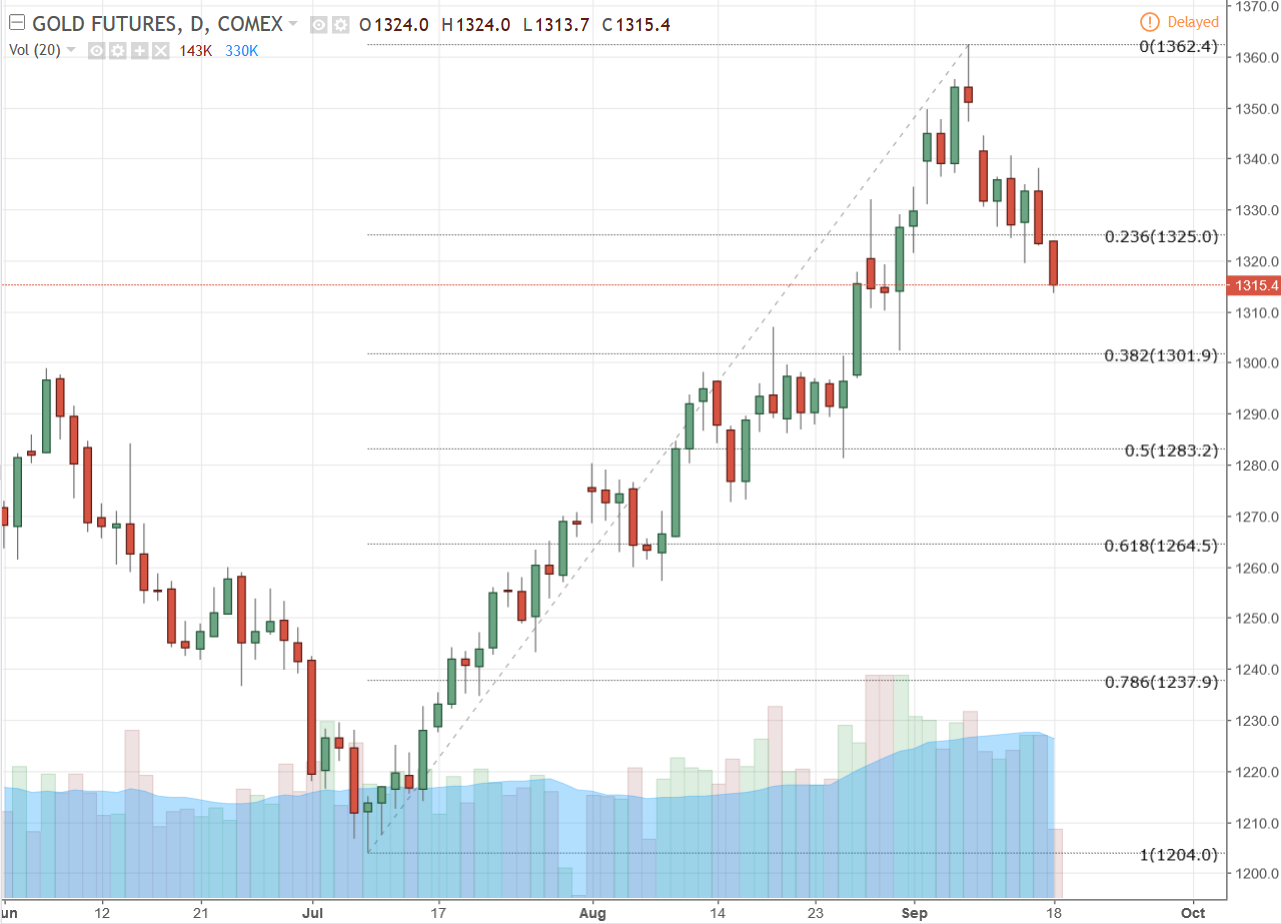
Here’s a couple of Fibonacci retracement charts with price levels to watch for support on the gold pullback. They are both daily interval charts which are the same except for the price range the Fib retracement grid is covering. In both cases, and typically in all cases concerning Fib retracements, the stronger the chart is trending the shorter the retracement will be. Usually bounces will occur somewhere around either the .382, .5, or .618 levels.
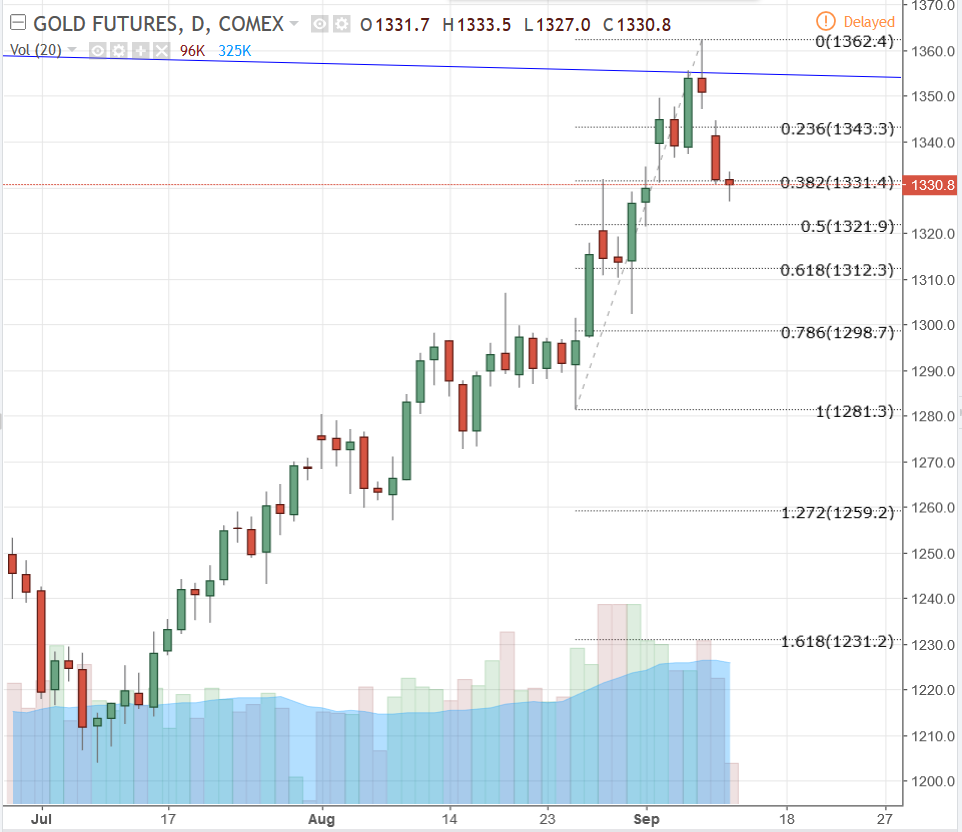
The first chart is drawn from the last major drop gold had after a period of consolidation, so it’s a solid base from which to draw the Fib. grid. At this time, gold has about 40% of this price range and has bounced a little back up to the .382 line. If you look at the last 5 candles here it has so far made a bullish pennant formation, from which gold may break higher to levels around 1400. If not and it continues to drop, watch the 50% area at 1321.9 for the next support.
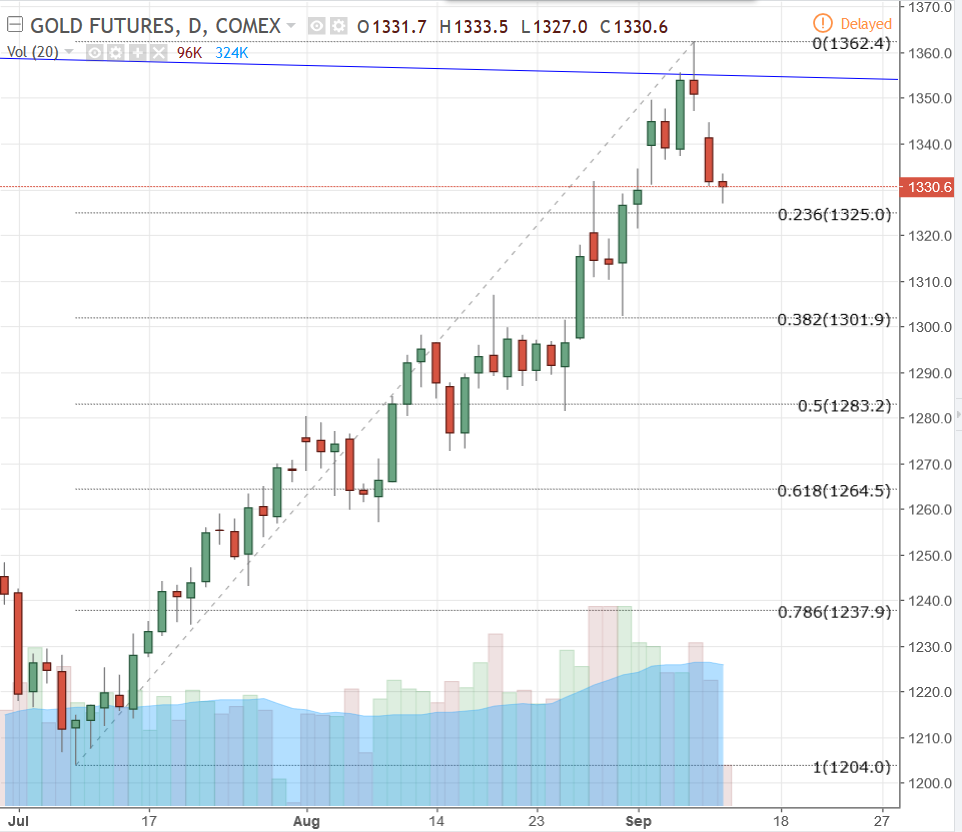
The Fib grid on the second chart covers the entire uptrend from 1204 in early July to the 1362.4 high from three days ago. Here you can see that gold has retraced about 25% of this move thus far. If the retracement doesn’t go below the .236 level and the previously mentioned pennant formation plays out, obviously gold will still be in a very strong uptrend. If it does fall lower and bounces from anywhere at or above the .618 retracement level it won’t be considered bad, but the strength of the uptrend will have weakened.
2 Likes
Wash, Rinse, Repeat … and the COMEX!
… or is it Rinse, Lather, Repeat! lol
I hadn’t seen this analyst’s comments before. I think it’s a fairly clear, albeit wordy explanation.
Very lengthy article building up to what I tried to capsulize in a couple of key excerpts shown below (read the entire article to capture the more subtle aspects of what he is saying):
Eight Crooks Against The World
Theodore Butler | September 8, 2017
…I’d like to share what may be a different way of looking at the gold and silver market, but still remain focused on what has been the primary driver of price – changes in the COMEX futures market structure. It has become fairly common knowledge that prices rise when the managed money traders buy and prices fall when these traders sell. So great is the effect on price of this COMEX derivatives positioning that it is discussed in more commentaries than ever before. And that is due to what has become a clearly observable pattern of cause and price effect.
…What kind of rational market system would pit and favor the short paper positions of just 8 traders, holding less than 0.1% of the position held long by all the gold holders in the world, to continually set the price? Sadly, this is the market system in place. And here’s another oft-asked question of mine – what would the price of gold be if these 8 paper shorts didn’t hold such a large concentrated short position and needed to be replaced by many others convinced the price of gold was high enough to be shorted?
The numbers in silver are even more startling. Eight large commercial traders held 48.2% of total open interest (182,823 contracts) net short, or 88,121 contracts, the equivalent of 440 million oz. Not only is this more than 50% of world annual mine production (870 million oz) compared to 26% in gold, the concentrated net short paper position of just 8 traders is around 25% of the world’s physical silver inventory of 1.5 to 2 billion oz (in 1000 oz bar form). Where the concentrated gold short position was ridiculous in that it was only 0.1% of the total amount of physical gold in the world, yet still dictated prices; the concentrated short position in COMEX silver is much more manipulative in that it is much larger and even more ridiculous.
I hold that “ridiculous” is the correct word in this case because what else could describe a circumstance where 8 large market crooks, acting in obvious collusion, could come to control and dictate prices to the rest of the world?
http://silverseek.com/commentary/eight-crooks-against-world-16846
The article was originally referenced here:
A little pull back is always healthy, don’t like huge pull backs for no logical reasons.
I show spot gold low today hit 1321.49 ( closed higher ? ) - interesting to see which way it goes the rest of the week. To summarize what the links I posted about COMEX short contracts is that 8 major banks act in unison to create a large concentrated short position. The “trick” used by these same banks, that make it profitable for them to repeat over and over, is that they do not act in unison to cover their short positions! These concentrated short positions create what is called a “primary trend” in the following excerpt cited. This brings the importance of Fibonacci retracement charts into play. The previous link(s) to the article I posted does not mention Fibonacci at all, whereas the following site goes into great detail:
Fibonacci ratios, when applied to trading stocks, correlate two trends; let’s refer to them as primary and secondary. The primary trend refers to a trending move in one direction while the secondary trend will refer to counter trend moves in the opposite direction. The three most common fibonacci retracement levels are 38.2%, 50%, and 61.8% of the primary trend and most basic stock charting applications will use these as standard levels. These fibonacci retracement levels act almost as magnets once the counter trend rally takes place. These are very common, however, there are a few other fibonacci levels that can provide resistance.
Three Fibonacci Trading Strategies + Infographic & Video | TradingSim
Barkerville Gold drills 8.6m of 17.45 g/t Au at Cariboo
Additional drilling results from the continuing 130,000-metre phase 2 Island Mountain exploration and infill
drilling program at Barkerville Gold Mines Ltd.'s flagship Cariboo gold project have expanded a veining corridor at depth in the Shaft zone.
The Company is currently exploring and delineating the Valley and Shaft Zones with nine drill rigs, while drill ten is expanding the known mineralization on the BC Vein. Detailed drilling results, a drill hole location plan map and vertical section are presented at the end of this release. The exact geometry and hence true width of the mineralized
zones cannot be assuredly concluded at this time therefore core lengths are reported.
Highlights:
IM-17-123: 5.76 g/t Au over 20.30 metres
IM-17-140: 16.79 g/t Au over 4.00 metres
IM-17-141: 6.09 g/t Au over 20.40 metres
IM-17-141: 11.17 g/t Au over 3.40 metres
IM-17-143: 7.09 g/t Au over 34.30 metres
IM-17-146: 17.45 g/t Au over 8.60 metres
Drilling Expands Shaft Zone Corridors to Depth
The Company is pleased to report that Phase II step-out drillhole IM-17-143 has expanded to depth one of the Shaft Zone veining corridors intersecting 7.09 g/t Au over 34.30 metres at a vertical depth of 425 metres below surface. This occurrence is located 50 metres downdip of recently reported drillhole IM-17-131 which averaged
53.26 g/t Au over 11.55 metres, 390 metres vertically below surface and represents an area at depth open for immediate expansion.
Located in the southeastern portion of the Shaft Zone at a vertical depth of 300 metres below surface, IM-17-146 has discovered another new occurrence of high tenor veining grading 17.45 g/t Au over 8.60 metres. Again, this new area is open for expansion along vein strike and to depth due to the scarcity of drilling in this area.
“The Phase II drilling program at Island Mountain continues to yield strong results with respect to expanding upon the sizeable, high tenor vein corridors that are potentially amenable to bulk underground mining methods”, remarked Paul Geddes, P.Geo, the Company’s Vice President of Exploration. “As we continue to infill the Shaft Zone and
expand the known corridors, we are not only demonstrating the continuity but the size of this impressive gold system.”
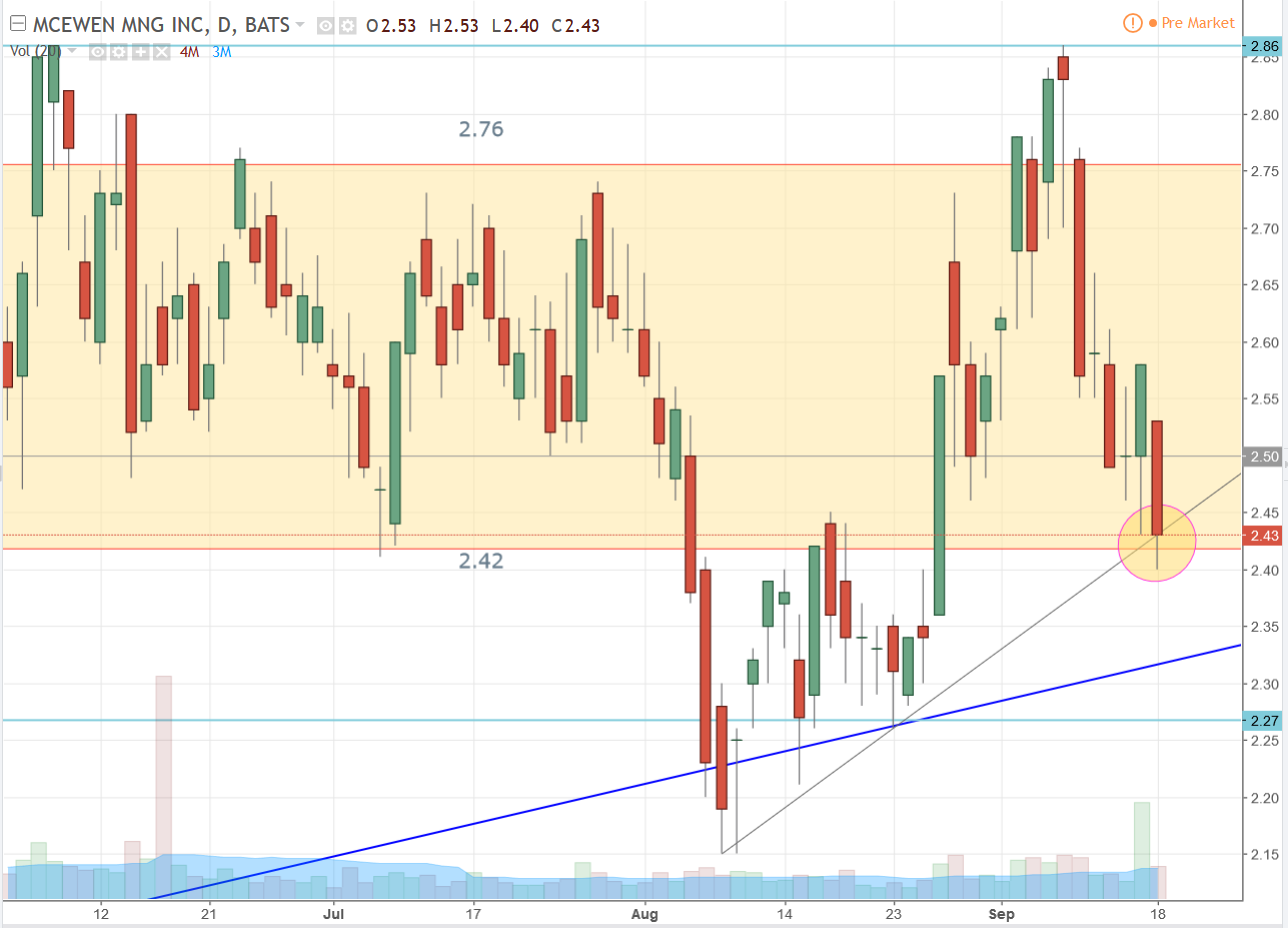
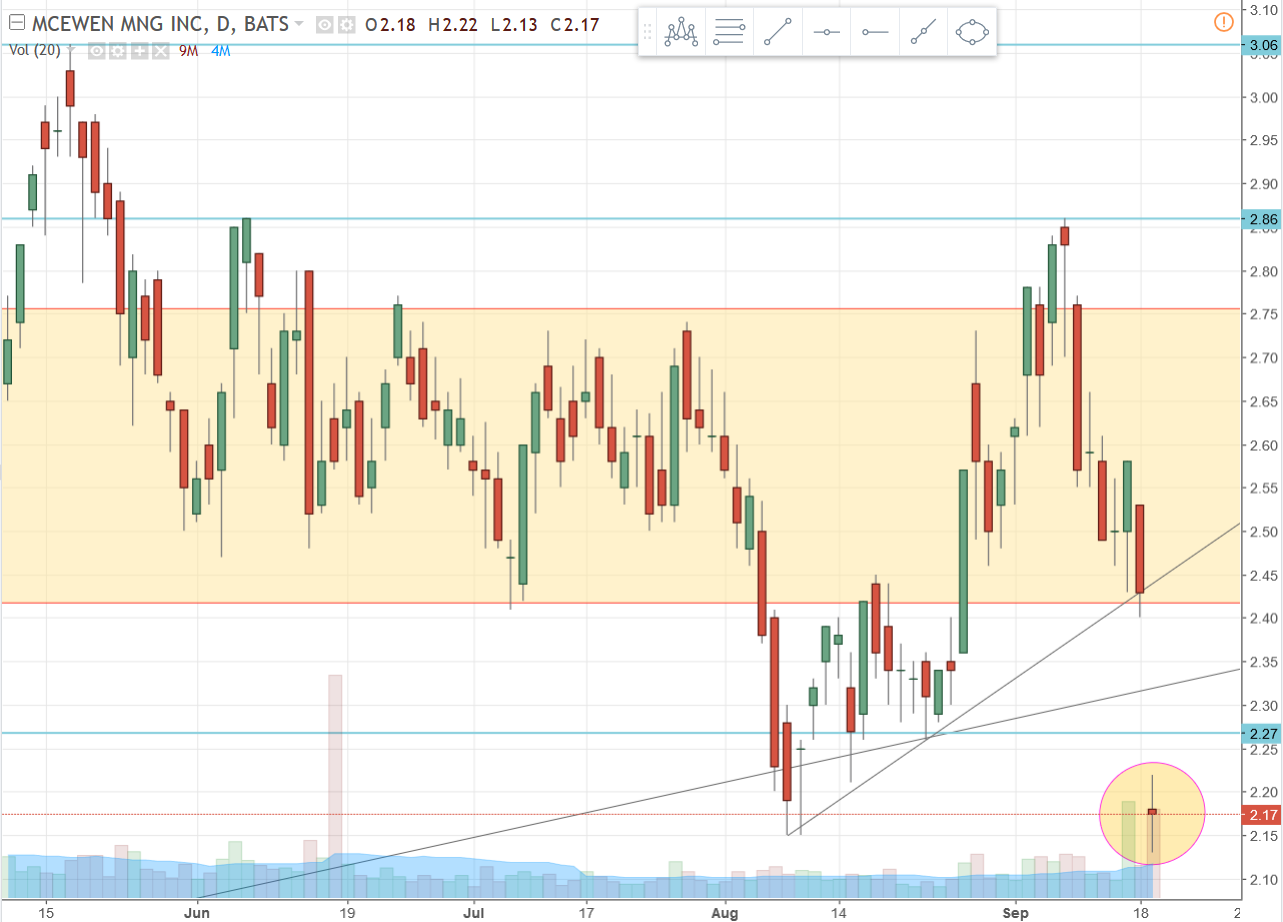
Here’s an updated daily interval chart for MUX.
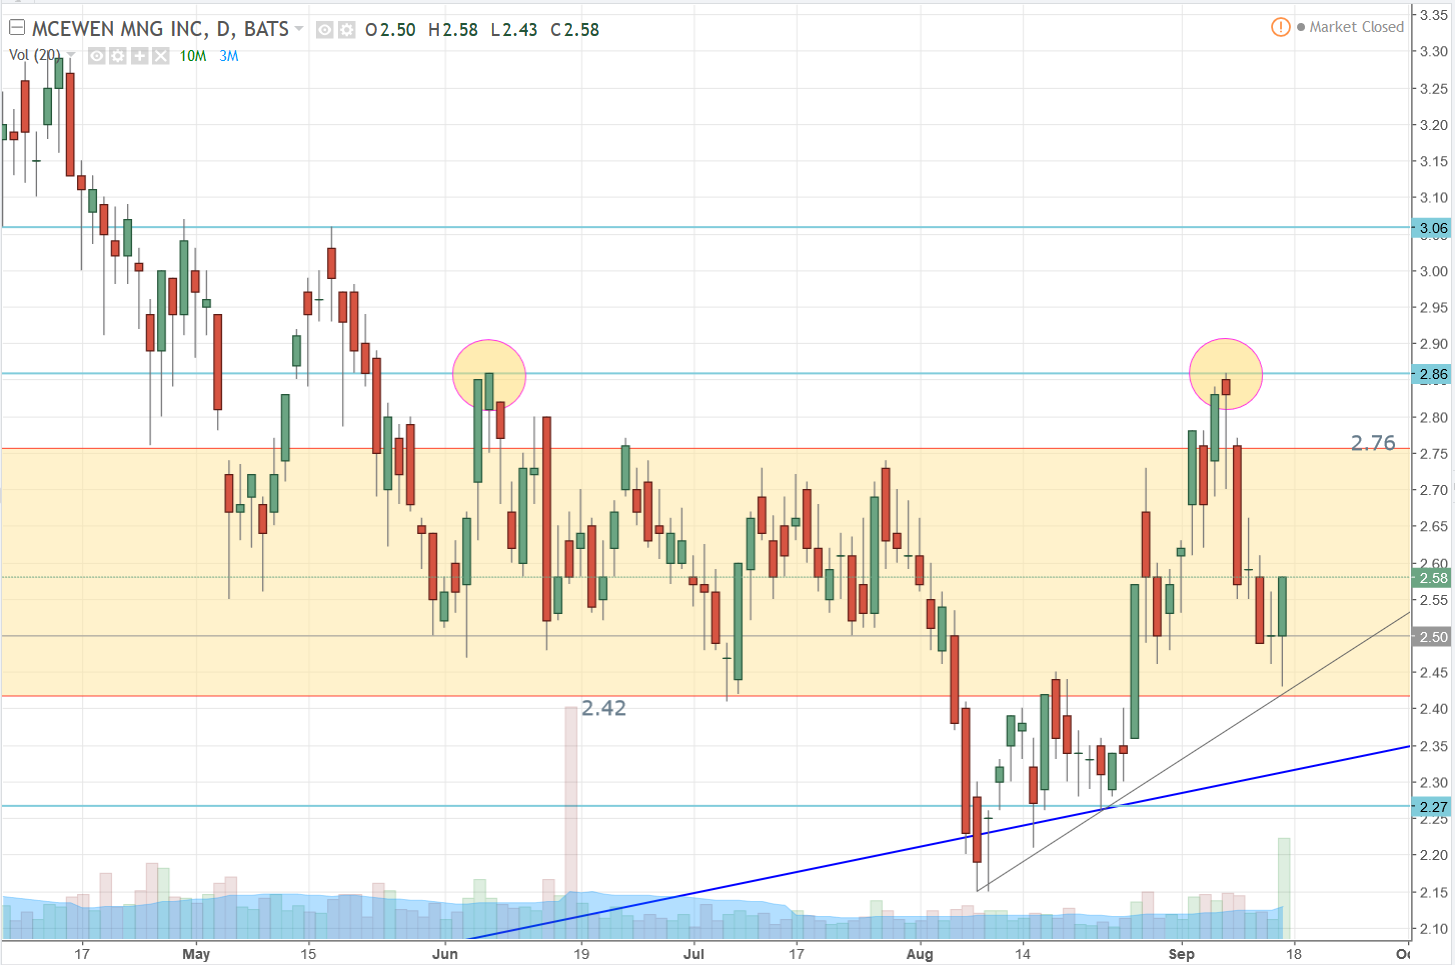
In my last update for MUX I posted a weekly interval and drew the next overhead resistance at what appeared to be the last swing high (for the weekly interval chart) at 3.06. Well this is why it’s important to look at many time frames. In this daily interval you can see where I clearly marked 2.86 as the last swing high and that is exactly where MUX went and dropped from over the past week of trading. It fell all the way back to the bottom of the highlighted trading zone I’ve had on the chart for a few weeks now. Also notice that MUX is making a new, slightly steeper, uptrend line which it bounced from yesterday afternoon. As that trend line is tested and holds as support I’ll adjust it.
If MUX is beginning a new bullish trend, we want to see a move up to the low 2.70’s find solid support and then make a run back up to and through 2.86, finding support somewhere in that area, and then move on to and through the 3.06 area and again find support before eventually moving higher. So for now we’ve got a number of decent support areas to watch, starting with that first blue major trend line support and then the gap-fill support at 2.27, then the minor trend line which MUX just bounced off of yesterday, along with the 2.42 low of the shaded trading range. Overhead resistance lies in the 2.72 - 2.76 range, then 2.86 and then 3.00 to 3.06. I’ll take a look at the weekly and monthly intervals and see if there’s anything worth posting on those charts, but eventually I’ll post a monthly interval and run some Fibonacci grids and/or point out some major horizontal support and resistance areas. Not sure when I’ll get to it, maybe this weekend, but I’ll get to it.
3 Likes
Here’s an update on the gold monthly interval chart. Gold is down about $10 this morning and the candle is currently at its low price, testing the steepest minor trend line. Wouldn’t surprise me to see a test of the next lower trend line which would bring it down to the 1300 area.
Here are updates of the two Fibonacci retracement grids I posted last week. Gold is nearing the 62% retracement area of the shorter grid, but has a ways to go to hit the 38% level of the longer grid…

1 Like
McEwen Mining Announces Bought Deal of $40.5 Million
The market seems to have not liked the MUX news much yesterday, but I believe they created some dilution at 2.25 so it’s not unreasonable for price to want to move to that level. Here’s a daily interval chart update showing price support, so far, at the bottom of the trading range and a close back on the fresh new trend line that we’re watching. It may not last long if yesterday’s sentiment continues today.
1 Like
Clearly, yesterday’s sentiment continues today.
Time to pull back and look at the bigger picture for more clarity…
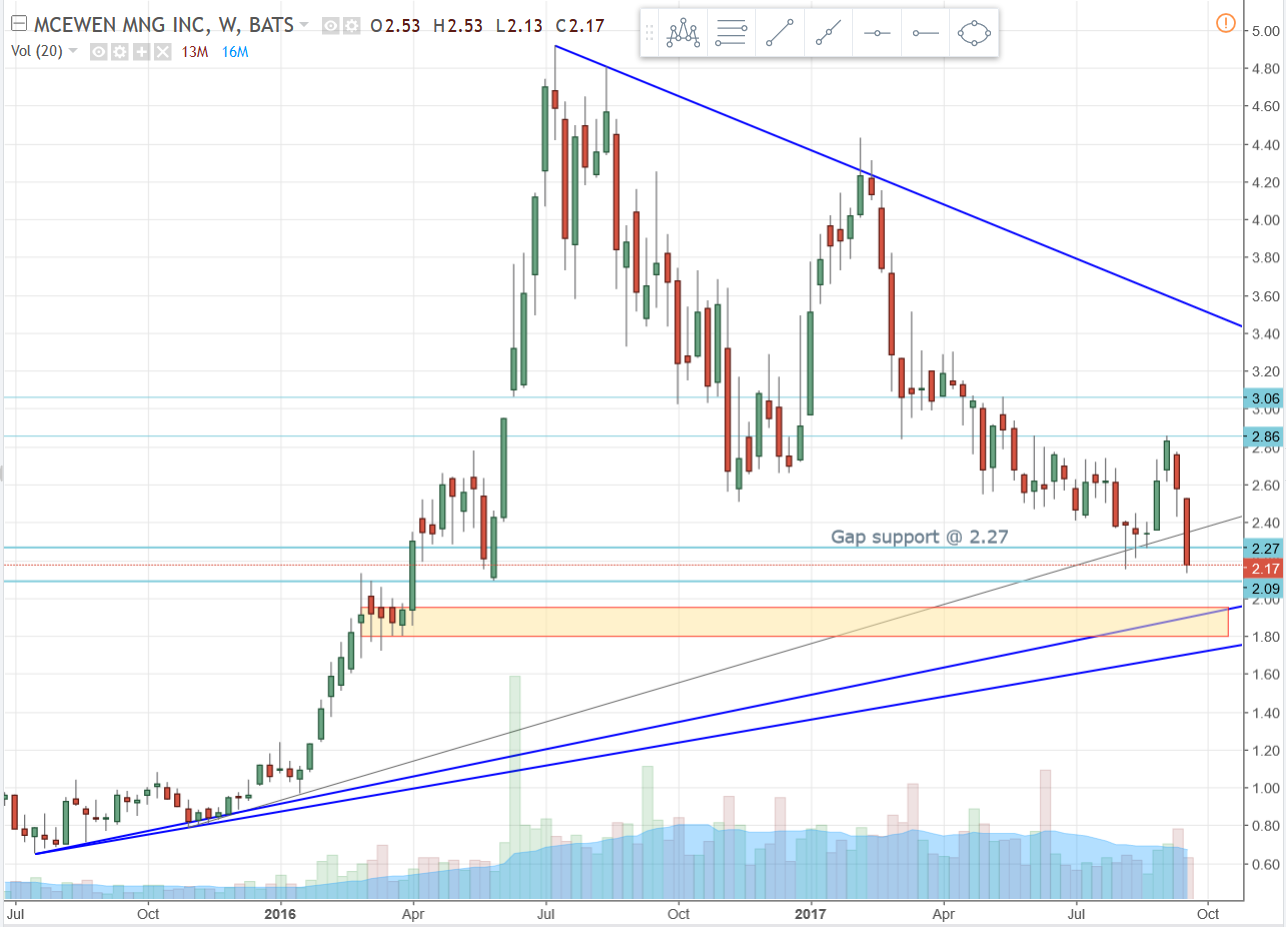
So here’s what we have: First, I got rid of that new little uptrend line that I had drawn because it’s clearly history. Next, (and this is premature because this is a weekly interval chart which means the current candle isn’t complete until the end of trading Friday), for the time being the breach of what was a major uptrend line now makes it invalid, although still useful so I’ll leave it up even if the candle doesn’t close above it by Friday. It can now act as an area of resistance when the stock moves up to it and it can resume its supporting role at any time in the future after the price moves back above it. I’ve simply changed its status from a blue major trend line to a grey, thinner, minor trend line.
Thirdly, the gap support level at 2.27 has been breached for the time being, so now that level can act as resistance if the candle doesn’t recover above it by the end of the week, or even the day if this were a daily interval chart. Fourth, the next major swing low support price on this chart is at 2.09, so we watch that for support if it gets there. Next, the yellow shaded area on the chart is another consolidation range which can be watched for support on a further decline. Although I didn’t mark it on this chart, the range is between 1.95 and 1.80. Finally, I drew another potential major uptrend line in blue to watch for support as well. I’ll update as I get more clarity.
3 Likes
MUX looks like it’s going to test the last swing low at 2.09 which I mentioned on the last weekly chart I posted just above. I’ll update the chart sometime in the next 24 hours. Same with gold.
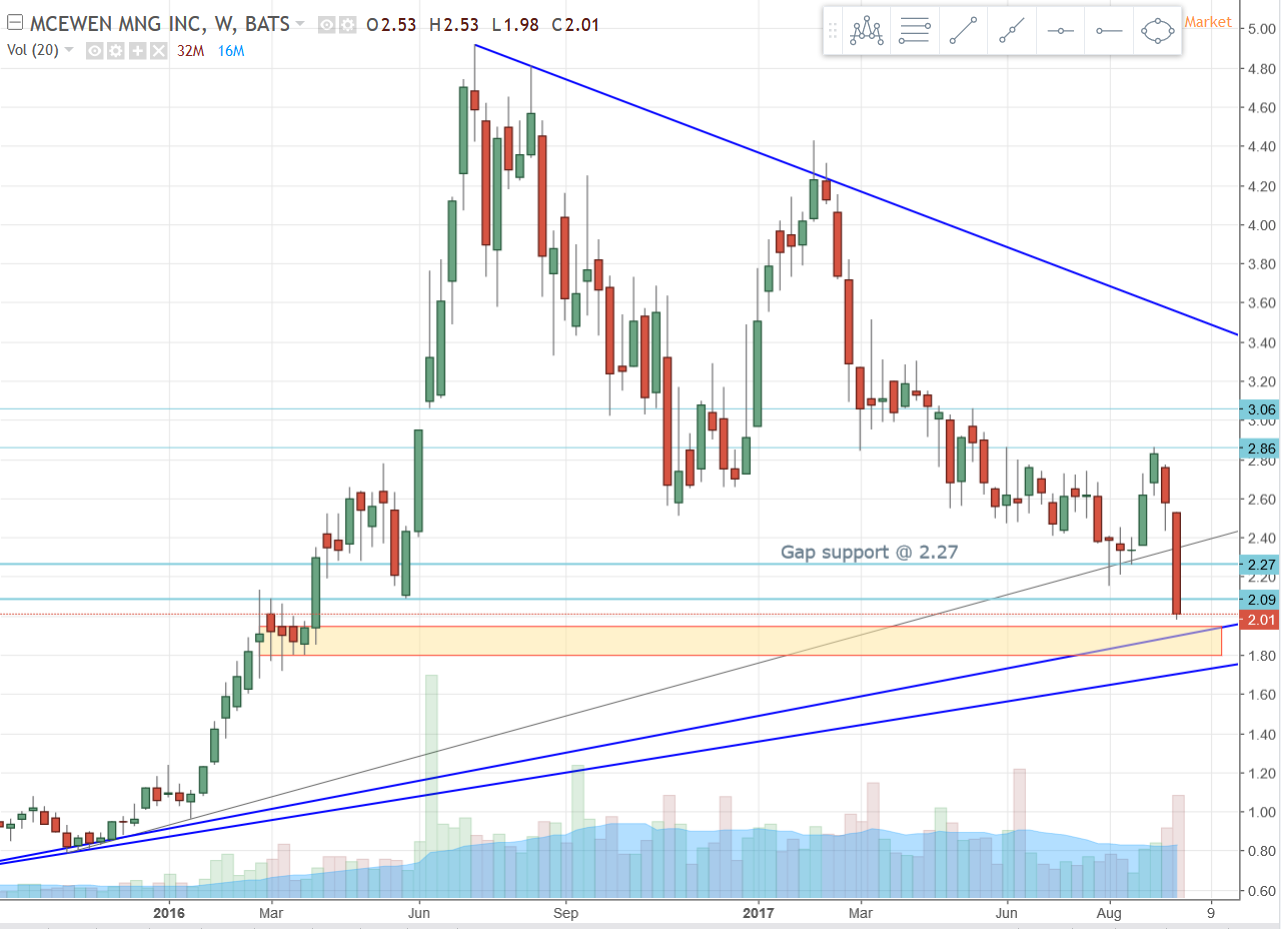
Here’s the weekly interval chart update for MUX. It’s pretty simple so I’ll keep this one short until the end of trading tomorrow. The 2.27 gap line is now resistance, as is the 2.09 last swing low line. Now for support we’re looking at the $2 mark, which is simply a psychological even number. Next we have the 1.95 to 1.80 range and, as you can see, the next major trend line support is sitting inside that zone right around 1.90. Barring any significant activity my next update for this one will be sometime after the close on Friday or over the weekend.
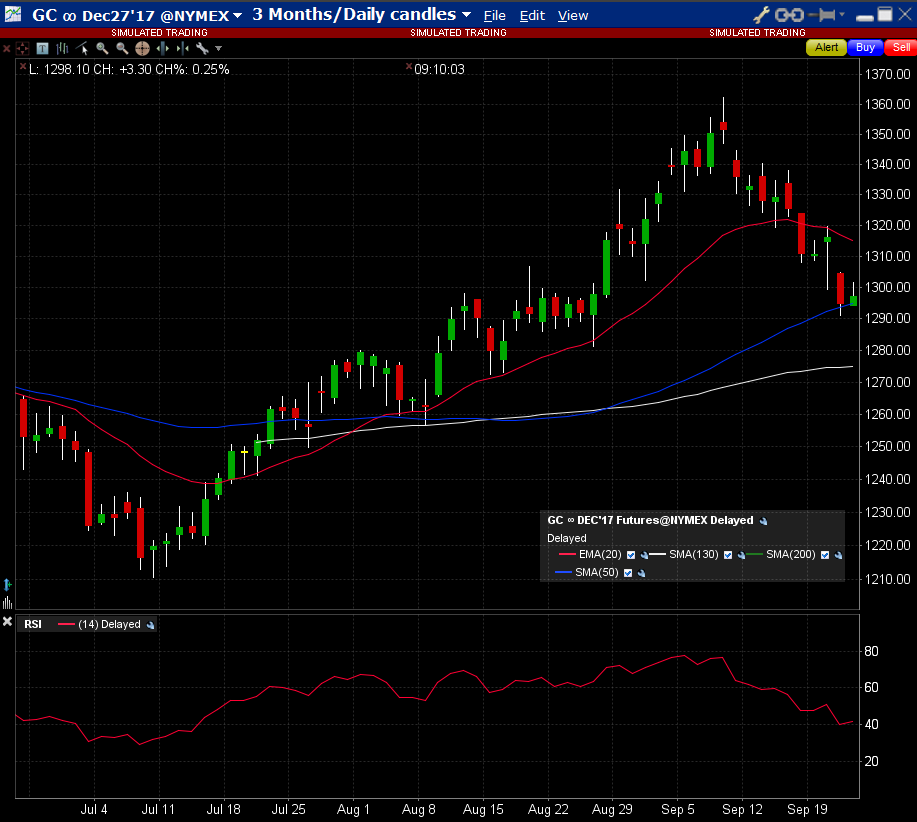
I’ll post a couple chart updates on gold but will save the heavier commentary for the weekend. The first is the monthly interval updating where gold is at relevant to the minor trend lines. The second chart is a daily interval showing gold currently hanging around support at the blue 50 day moving average. The white 130 MA awaits below should the 50 not hold.
1 Like
Here’s an update for MUX.
First chart is the daily interval highlighting the new gap which will likely provide heavy resistance whenever MUX gets back into a bullish trend. The range of the gap is marked with the pink lines at 2.24 to 2.40. When MUX does start a bullish trend again, this gap is likely to be a very strong area of resistance, but once overcome tends to also provide strong support.

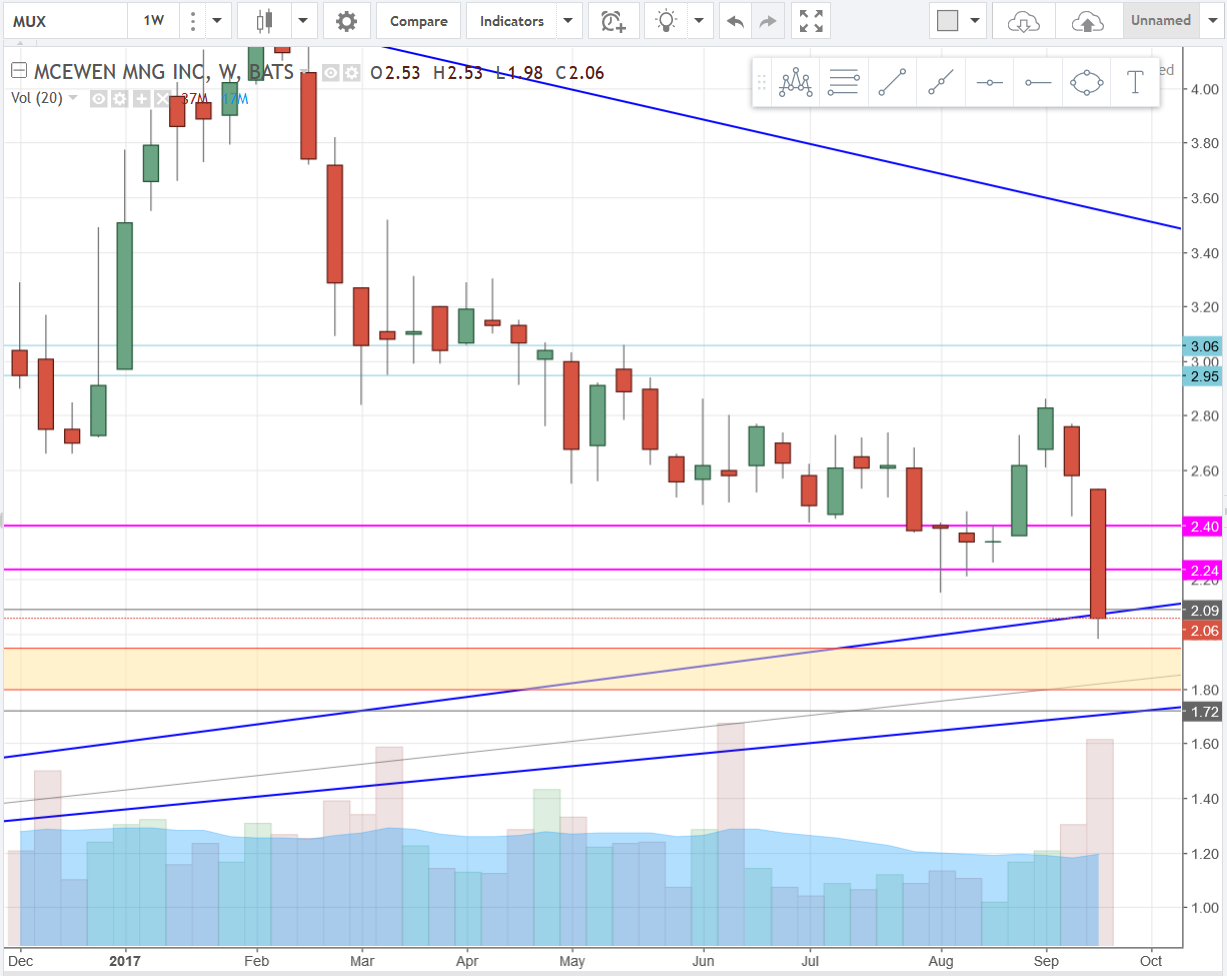
The next chart is the weekly interval. I spent some time on the daily interval and found that my major uptrend lines needed just a little adjusting, so those of you who might be studying these more closely will notice they’re a little different, but they are more accurate now. There’s a lot going on here which I’ll cover in the next chart. This is just to provide the bigger picture.
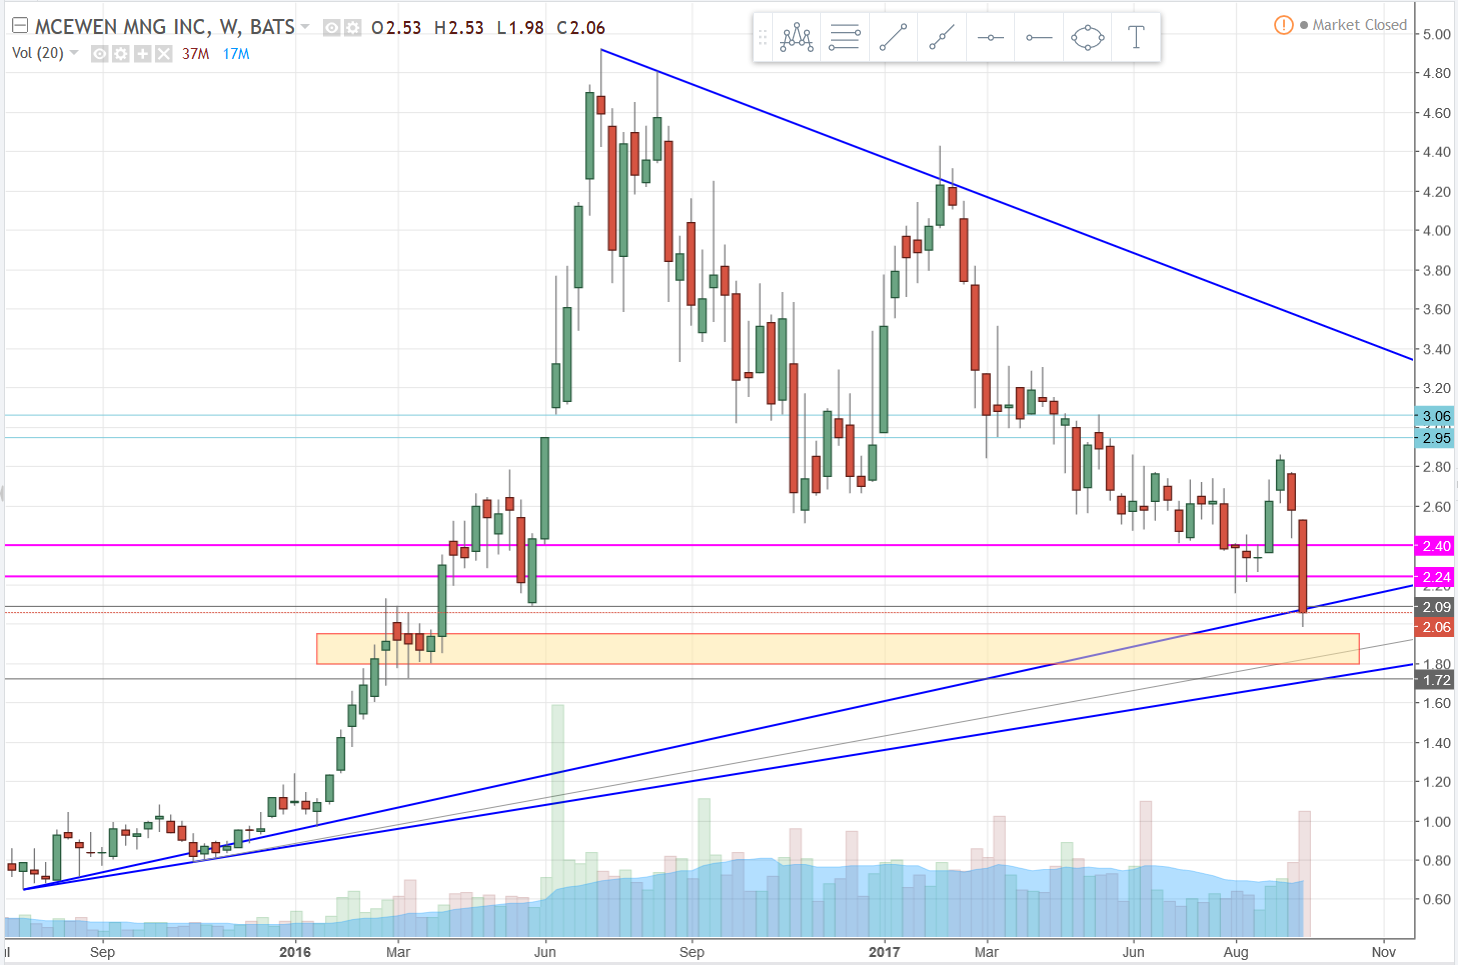
The last chart is a blown-up view of the previous to help make it easier to decipher what has become a mess of lines. So first, obviously the weekly candle isn’t going to show the gap, but it’s there on the daily chart so keep it in mind when you see the pink horizontal lines. Last week’s candle closed at 2.06, which is below both the 2.09 swing low support level and the blue major uptrend line. The price is close enough to that uptrend line that, if MUX should open next week at 2.08 or higher and not close lower than that, it could maintain its supporting role. If MUX does continue its decline, then for support we’re looking at that consolidation range between 1.95 and 1.80, along with the next swing low support at 1.72, which currently lines up nicely with the last major uptrend line in blue. If that trend line support is lost then things won’t be looking good for MUX at all, but we’ll deal with that if/when we get there.
1 Like