Thanks you kindly for the chart and analysis. I should stop messing around with these tumultuous stocks. 
You’re welcome. Actually, FNME wouldn’t be a bad stock to swing trade. Buy in the low $2’s and sell near or at $3. With 5 grand you could trade 2000 or more shares and make $1500 a swing. It’s not one I’d be looking to invest in though, and I learned a long time ago that if I’m going to trade a stock, trade one I wouldn’t mind investing in because sometimes trades don’t go the way you want. It doesn’t feel as bad being “stuck” in something you are happy to own and confident that you’ll get your money back. It’s pretty much how I have felt about MDMN and Cerro.
That is what a smart investor would do. Turns out I am not that, so much. I bought 2,000 shares at $4, so I am bag holding until it turns around. Sounds like some other investment I am in.
FNMA was a gamble much like MDMN was. If I lose it all it is not a huge deal, but I expect to make money on both. Just not nearly as fast as I would have liked.
Thanks again!
I’ll keep an eye on the stock and post anything worthy of posting for you. In the meantime, and this is for anyone who is interested, if there is a stock you’re interested in buying and you want some analysis done to help determine where a good entry point would be from a technical perspective, I’m not opposed to providing that kind of info. I just don’t want people becoming dependent on me for everything and I definitely don’t want people being pissed off because they followed something I said and it turned out to be wrong. If anyone is interested in that just ask, and do so with the understanding that I can not and do not make recommendations as I am not a licensed professional. What I can do, and what I do here, is post what I am doing or what I would do myself in regards to buying or selling a stock. If people are cool with that and take responsibility for their actions I have no problem sharing my perspective if it’s wanted. (Also keep in mind that I may not always have the time to be here doing this so some day it might end, but I’ll certainly give a head’s up in advance of anything like that… unless of course I should drop dead in which case all I can do is apologize in advance! LOL).
6 Likes
I for one appreciate what you have done and are doing, I’m learning as we go…
1 Like
I don’t trade myself anymore GC, but I’ve got 17 years experience so if folks like you can learn something I’m happy to offer it. It’s actually more rewarding to me than the trading and I do enjoy it, at least in spurts like I do here. Sometimes I think I go too deep into things but knowing that there are still people interested in the details then that motivates me to offer that.
2 Likes
Thanks TR,
greatly appreciated for your technical analysis and I’m sure everyone here feels the same way.
8 Likes
I’ll do an update on gold and MUX once they make a move one way or another out of this little consolidation they’ve been in for the past couple days. My guess is it will be down.
No, up, we lost jobs, might make the Feds not hike.
MUX has been looking strong today so I’m starting to think the bottom might already be in. I’m going to buy my position today at 2.08. If there is more down side I don’t think it’ll be more than .10 to .15 off the 1.94 low at this point.
deleted by me
It’s up based on news.
http://www.mcewenmining.com/Media-Events/News-Releases/News-Releases-Details/2017/McEwen-Mining-Completes-Purchase-of-Black-Fox-Complex/default.aspx
2 Likes
Read the whole thing, it’s a steal IMO, plus they get the accumulated tax credits on future revenues. Just need a little patience for Rob to spool MUX up
Checkout V.GGI or GGIFF wish my friend had put me on to them before they did their big run! Eric Sprott has been doing some financing with them
It seems that what ever Sprott touches turns into gold! lol! please tell your friend next time not to make the mistake of not telling you about a stock like this and the same time you can send me a PM and spread the love.
3 Likes
Same here please.
Same here please.
Here’s an update for MUX…
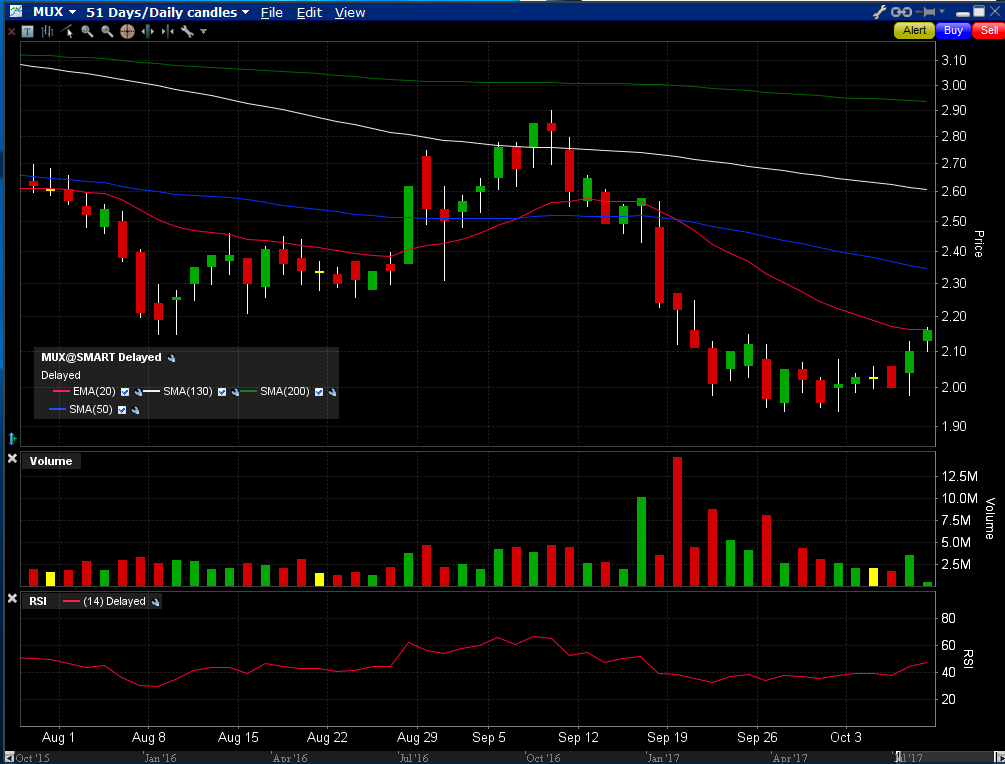
The first chart is a daily interval simply showing that today’s candle hit the red 20 EMA and so far has found resistance at it. Tomorrow will give us a better idea of whether or not it’s going to hold. The blue line above is the 50 MA and the green one above 2.90 is the 200 MA.
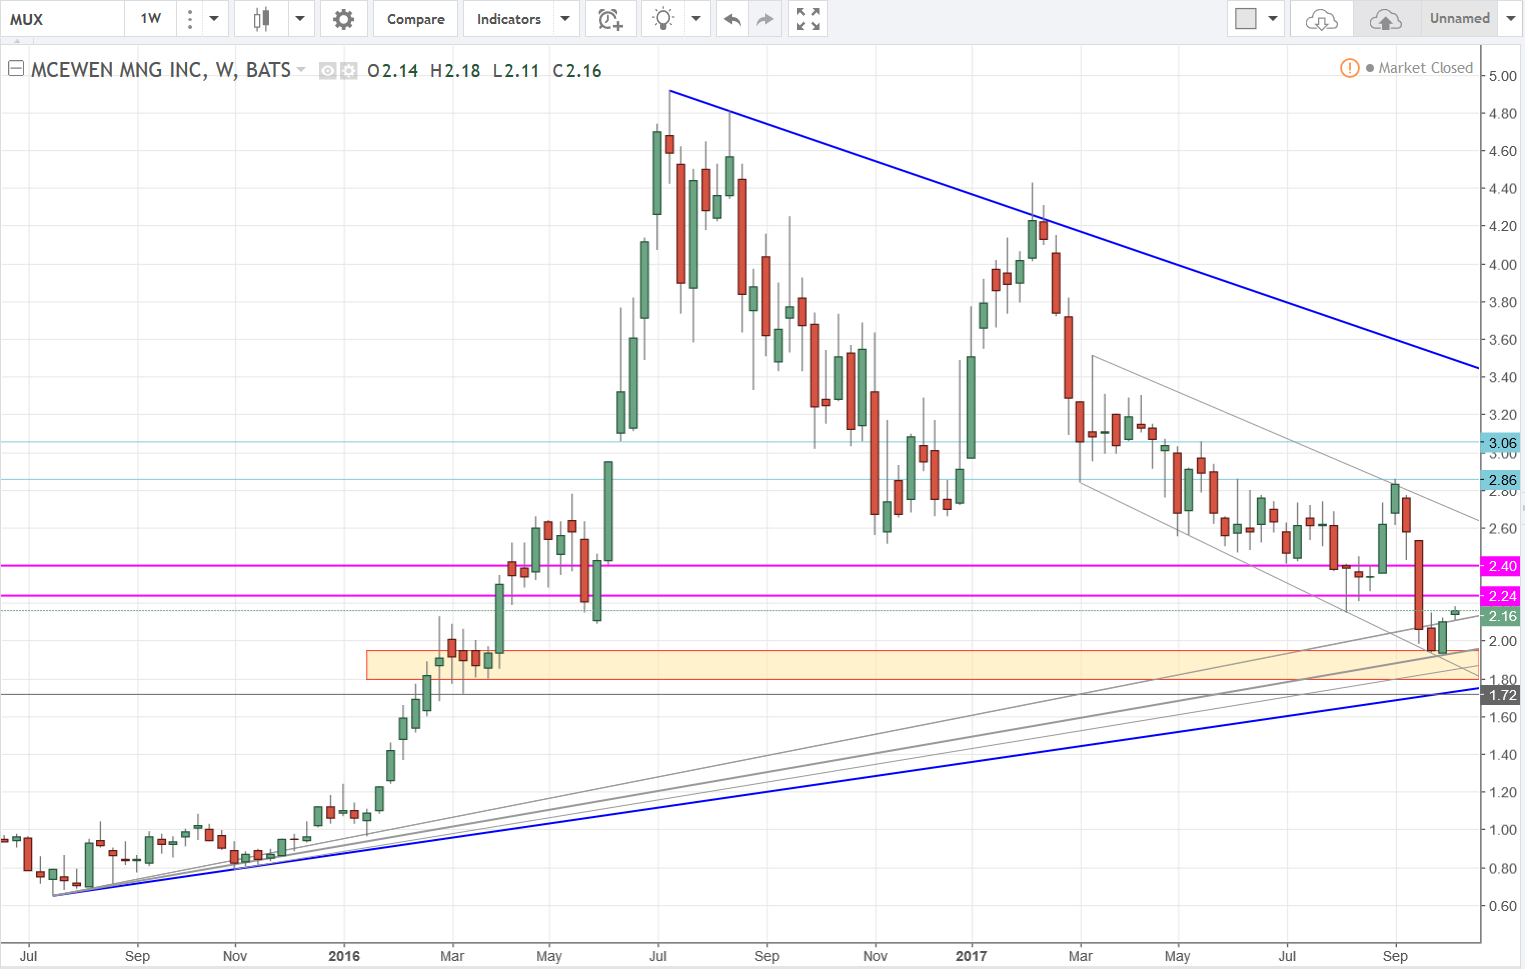
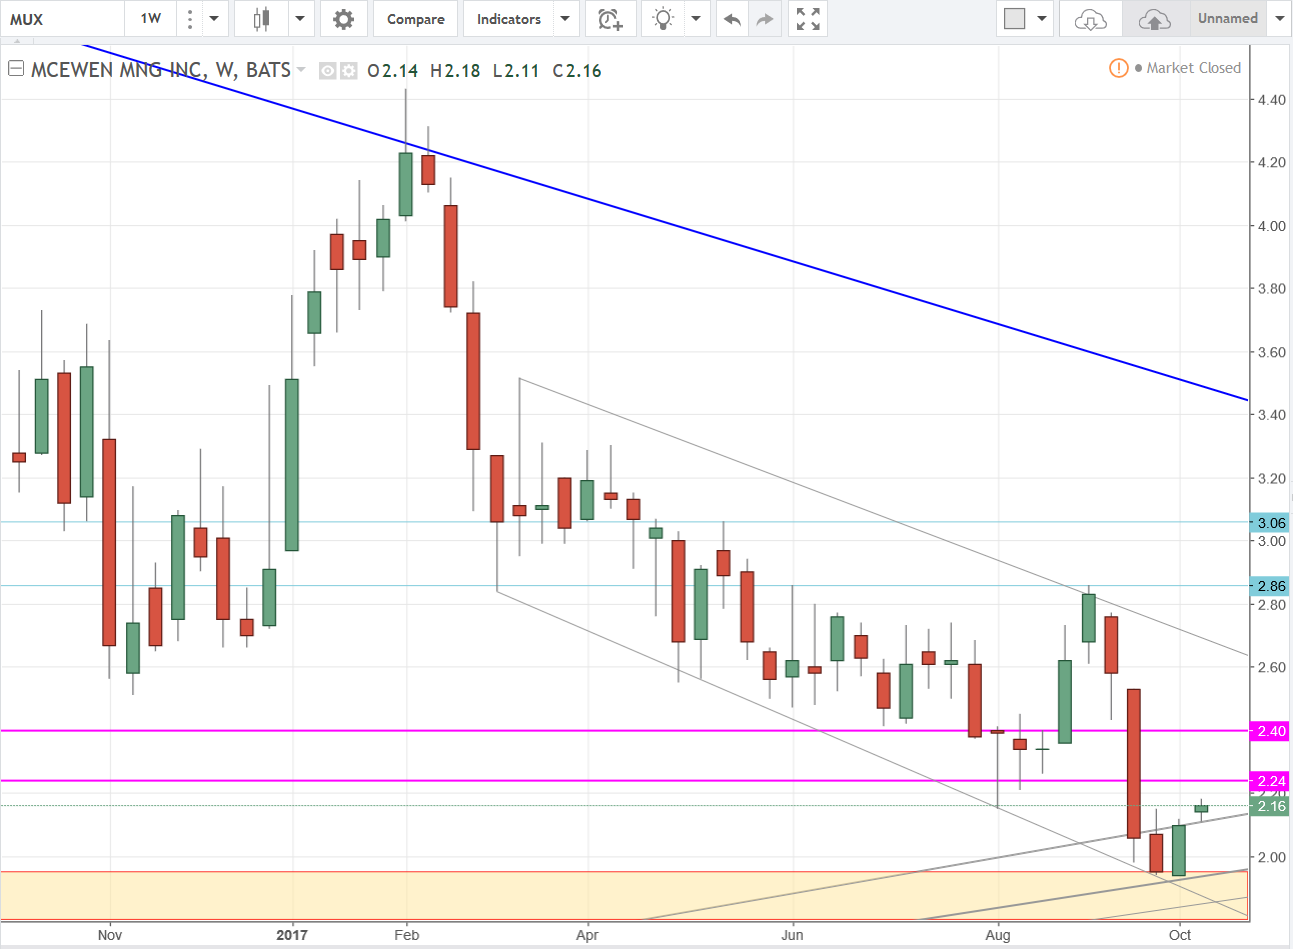
The next chart is the big picture of the weekly interval. The last four candles are a good example of why I like to keep trend lines visible even if they’ve been broken through. They still tend to act as support and resistance just like horizontal levels. The last chart is a close up of the same chart. So far it’s looking like support was found at the top of the 1.95 - 1.80 support range as well as a minor trend line. This week’s candle dipped down and found support on a trend line so we can keep an eye on that for support now. Just above is the gap marked by the pink lines. It’ll be interesting to see how long it takes MUX to move through it.
Great chart and this.
http://s1.q4cdn.com/807296388/files/doc_presentations/mux_corporate_presentation.pdf
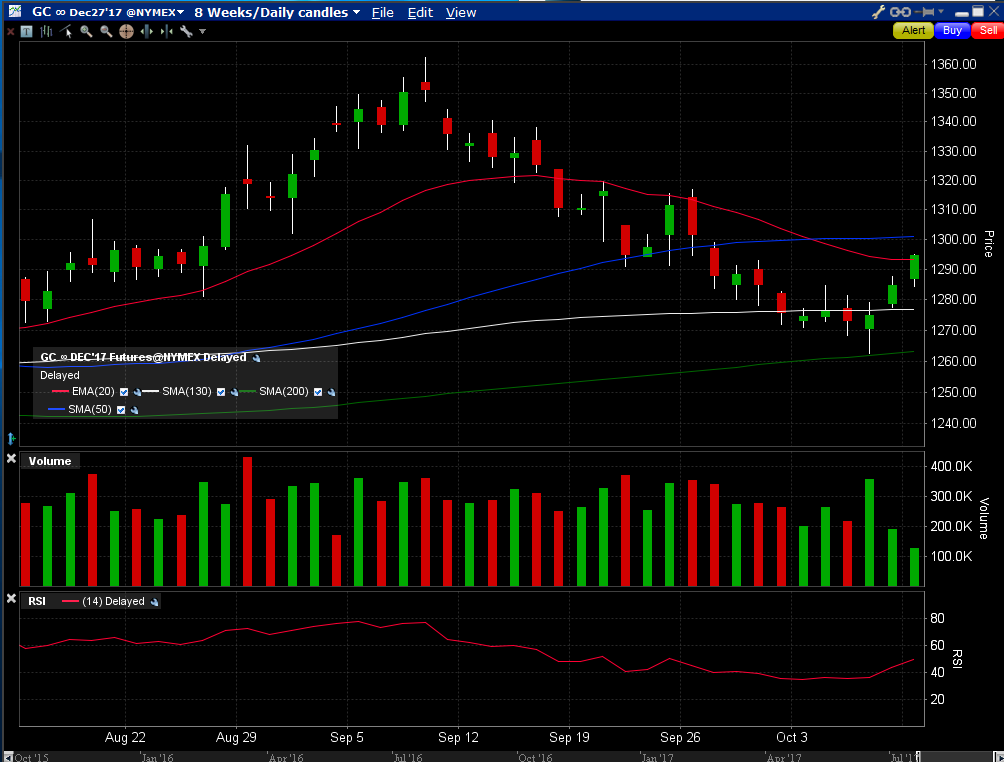
Here’s an update for gold, all are daily interval charts…
First chart is a simple moving average chart showing gold found support right at the green 200 MA, then broke above and found support at the white 130 MA the following day, and has so far overnight pushed up through the red 20 EMA. But, the day isn’t over. We’ll see how this candle closes, same with MUX in regards to its 20 EMA.
Next is a big picture chart of gold that goes back to late 2015 where some of my trend lines originated. Note the trend line highlighted in green. I’ll cover more in the next chart.
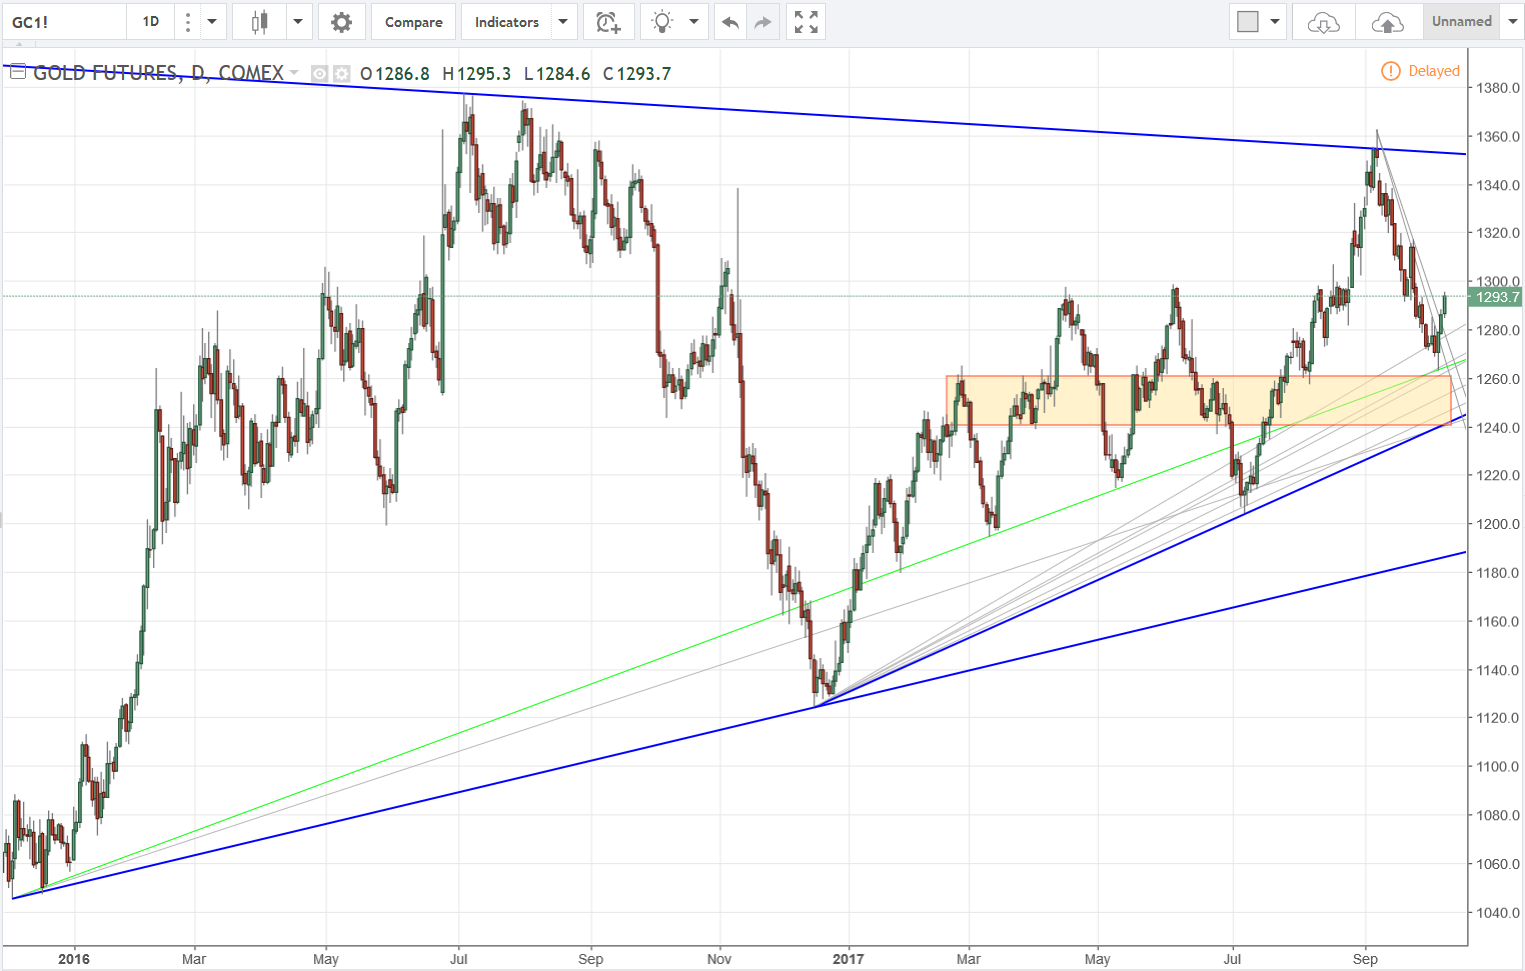
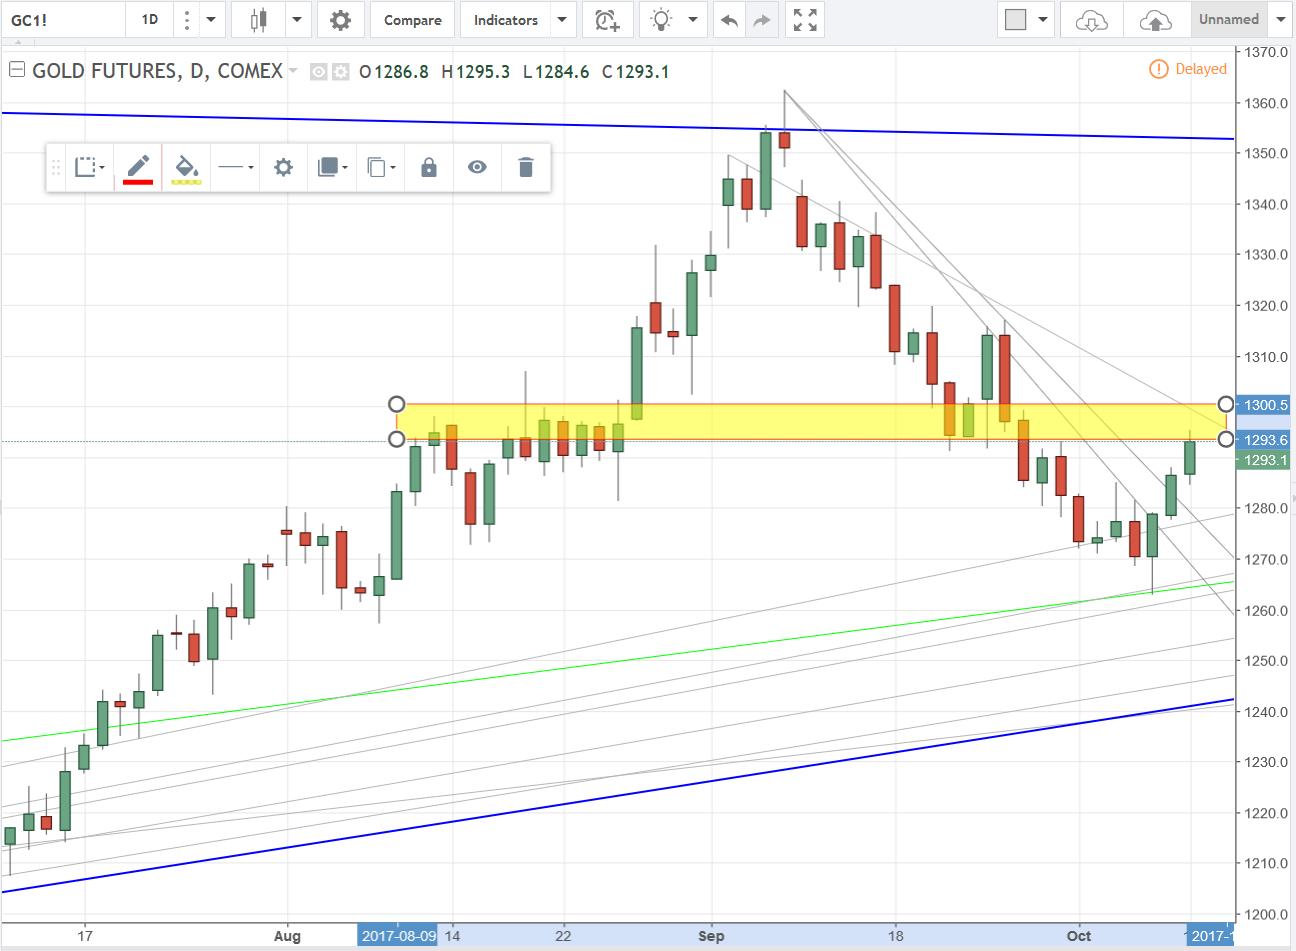
The next chart is a close up of the previous. A few things to look at here. First, the trend line in green, although in the past was broken through, did end up being useful this time. No, you never can tell when an old trend line may prove useful but, yes, you never can tell when an old trend line may prove useful! ![]() Second, gold has broken through two downtrend line resistance levels. We’ll see if the third one offers anything useful. Third, the yellow rectangular zone is chock full of potential resistance which, if broken through, should clear the way to the 1310 - 1320 range.
Second, gold has broken through two downtrend line resistance levels. We’ll see if the third one offers anything useful. Third, the yellow rectangular zone is chock full of potential resistance which, if broken through, should clear the way to the 1310 - 1320 range.
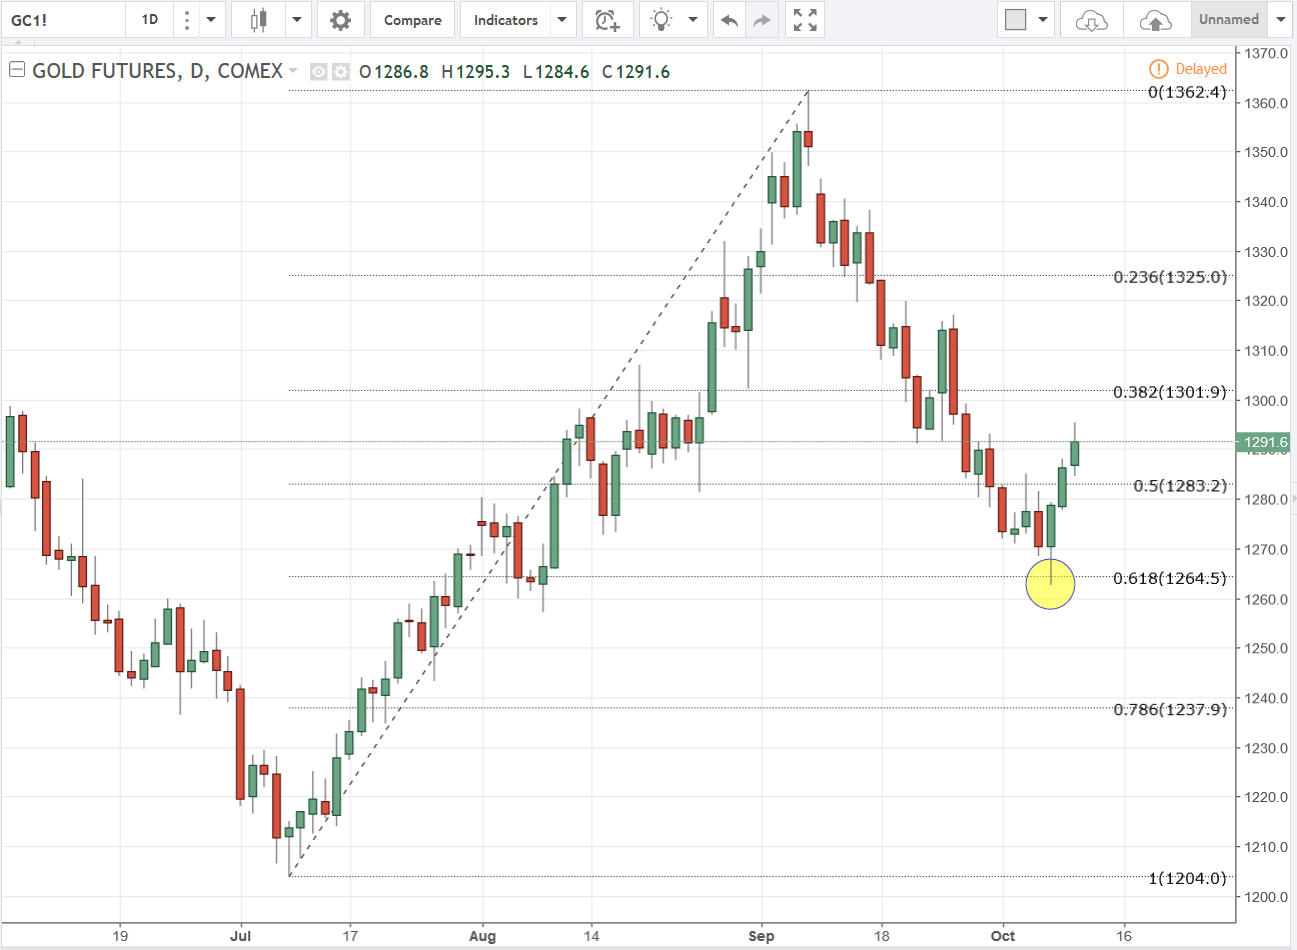
The last chart shows gold bouncing off of the 62% retracement area, the most common level bounces occur from.
The main things I’m watching for today is how gold responds to the overhead resistance areas outlined in these charts. So far that 20 EMA is keeping gold from going higher.