Obviously wasn’t able to get to the charts this weekend. I’ll get to them as soon as I can. Been a little busy and tired lately.
Here’s an update on the gold futures charts. These are all daily interval time frames.
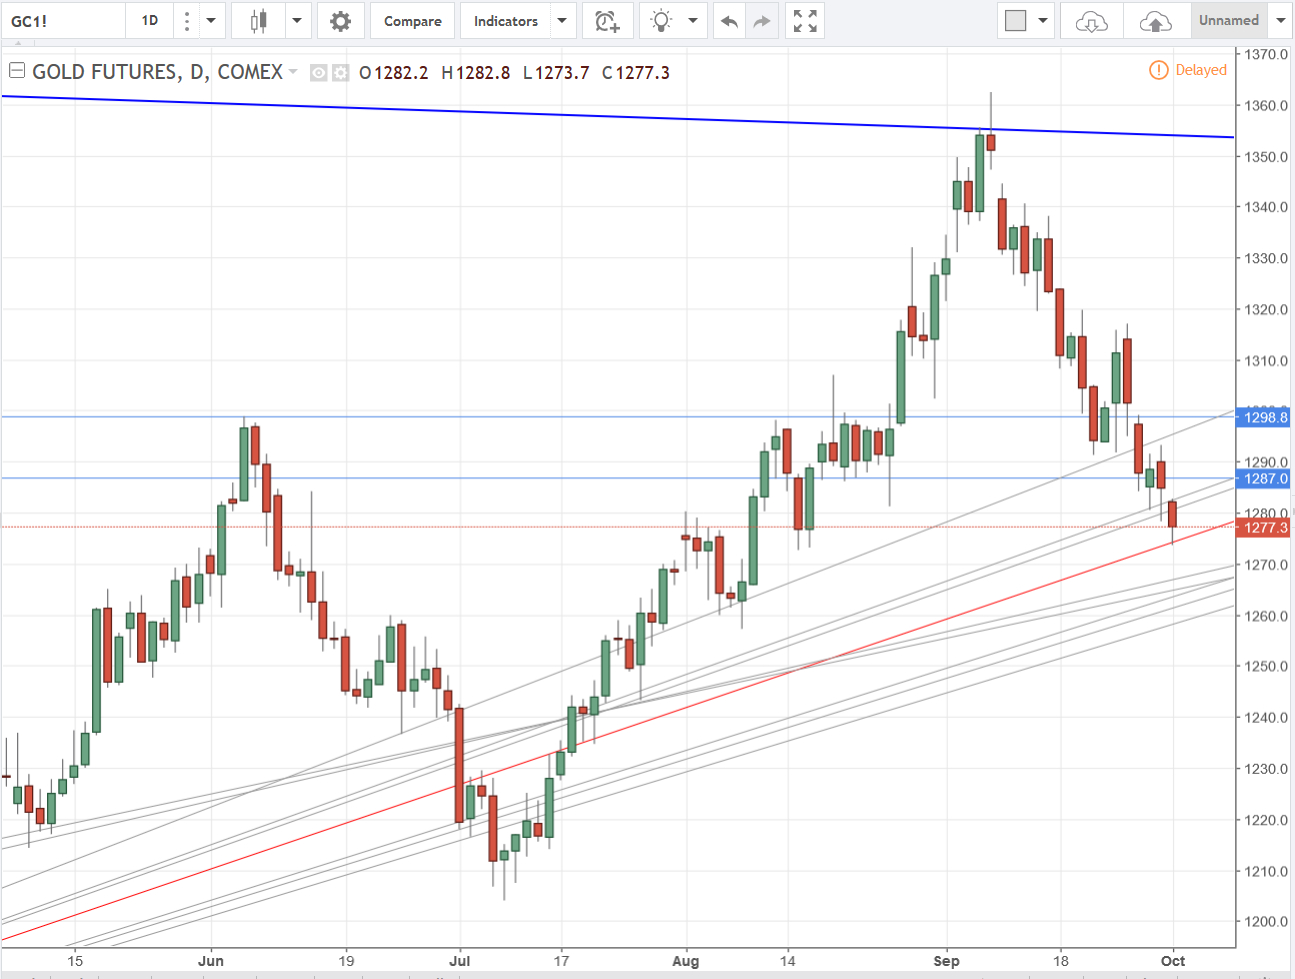
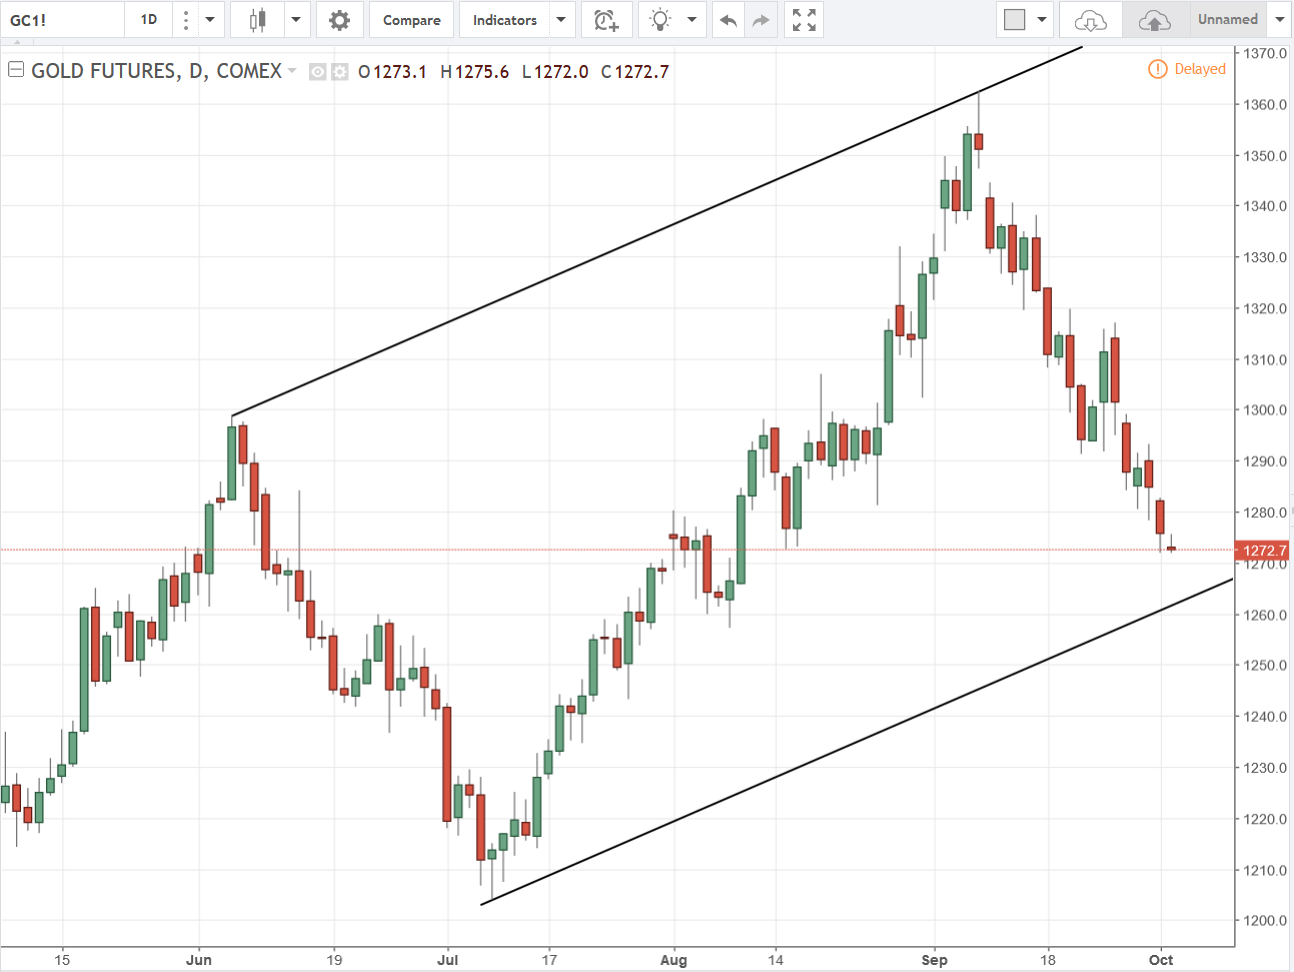
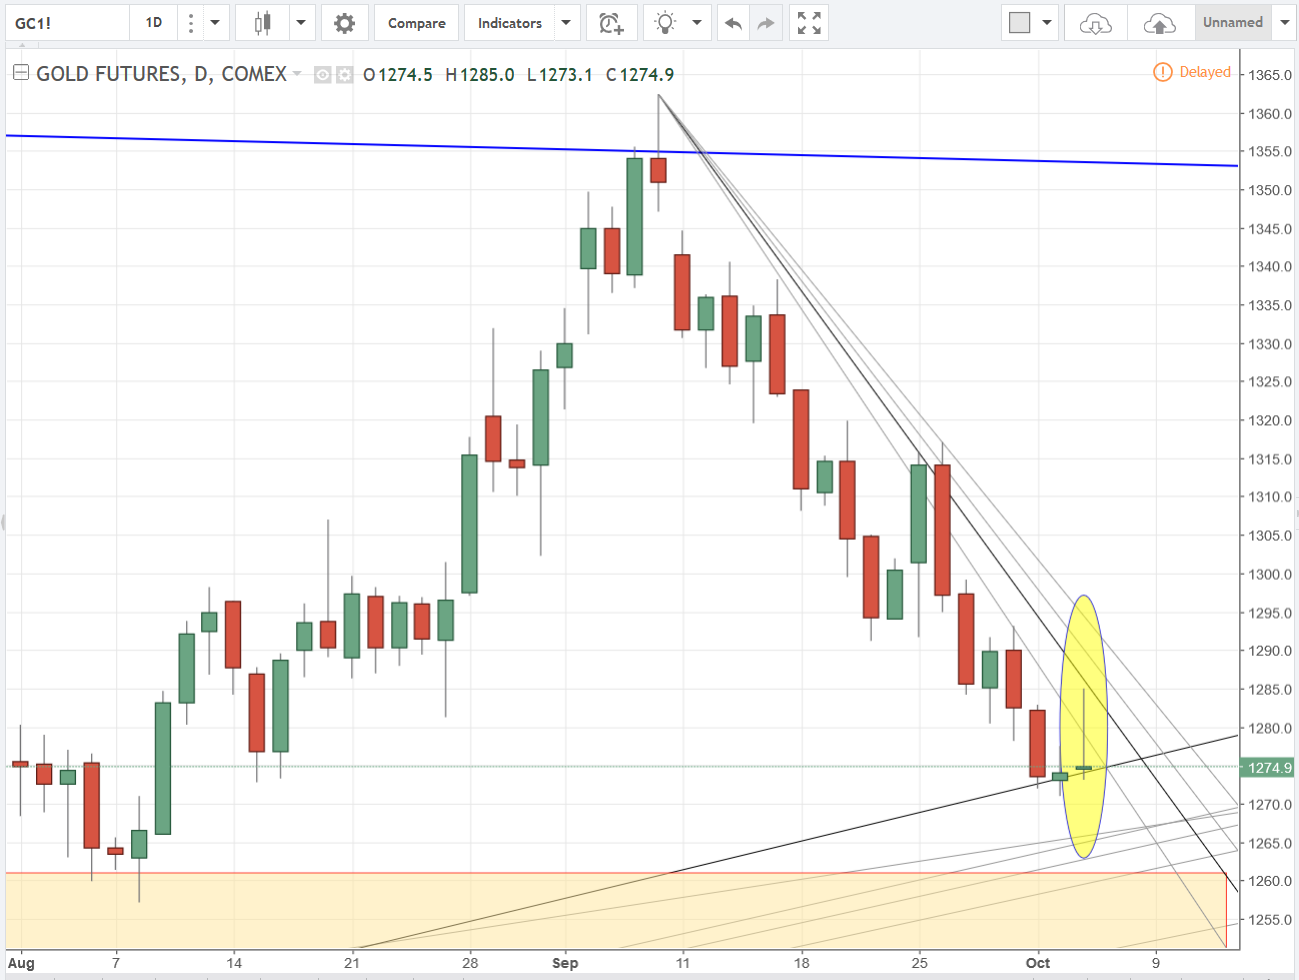
The first is my messy trend line chart. Overnight gold hit one of my old trend line support levels (red line). This isn’t a significant level so I’m not highly confident that it will be the end of the drop, but you never can tell. Drawing trend lines like this can be done on any time frame and can be very useful for trading. If I were to go back to trading anything using trend lines like this would be one of my primary methods, and if I could only use one tool for trading this is what I would choose.
The next chart shows where we’re at on the Fibonacci grid. My comment last week about gold looking like it is heading to 1264 is based upon the 61.8% retracement level on this chart. I haven’t checked yet but I’ll see if that level corresponds with any trend lines on my other chart.
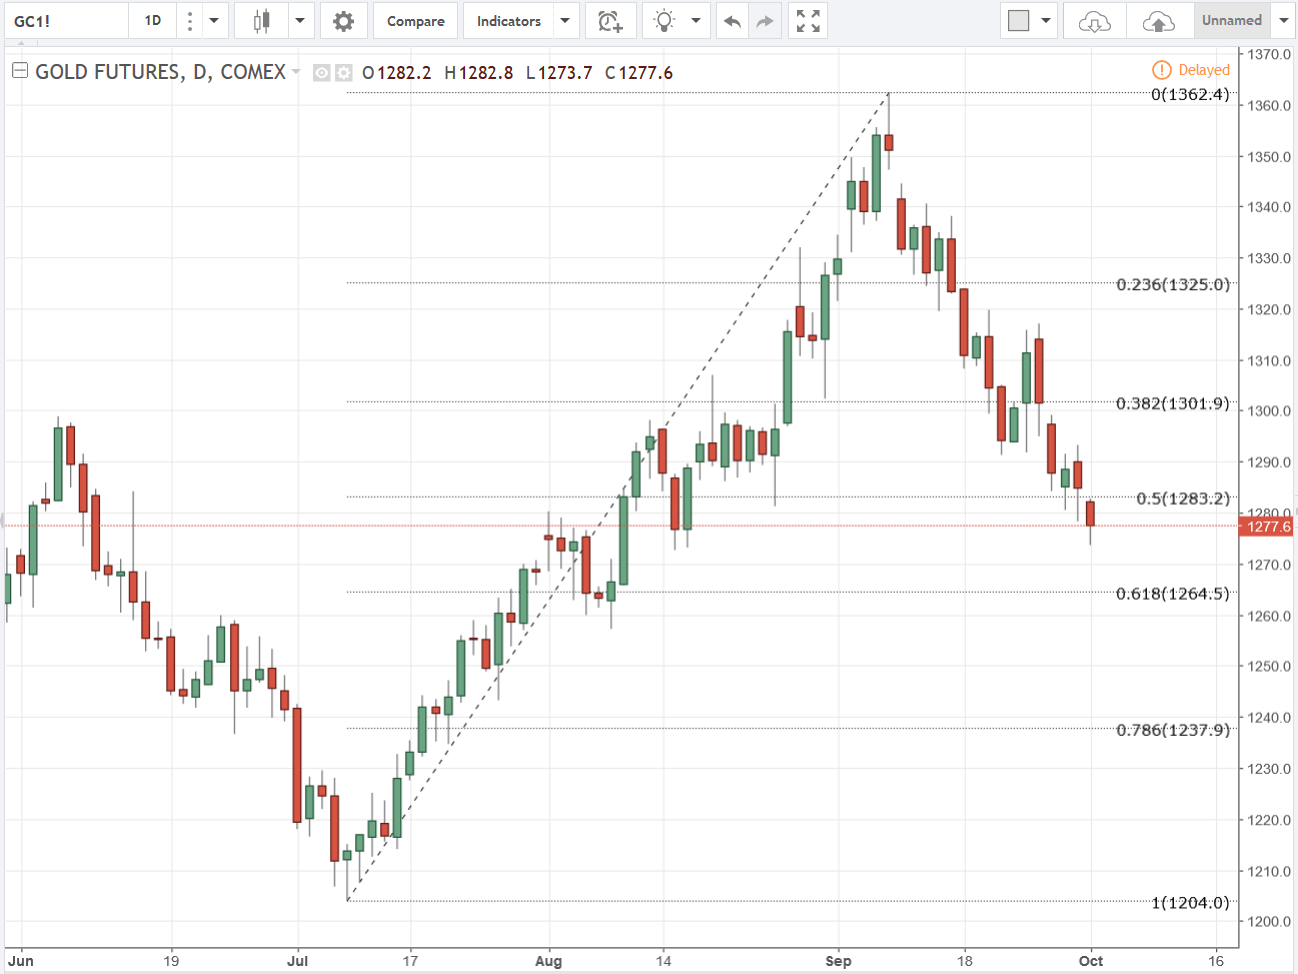
The chart shows a few downtrend lines and the next likely zone of support, which is between about 1262 and 1240.
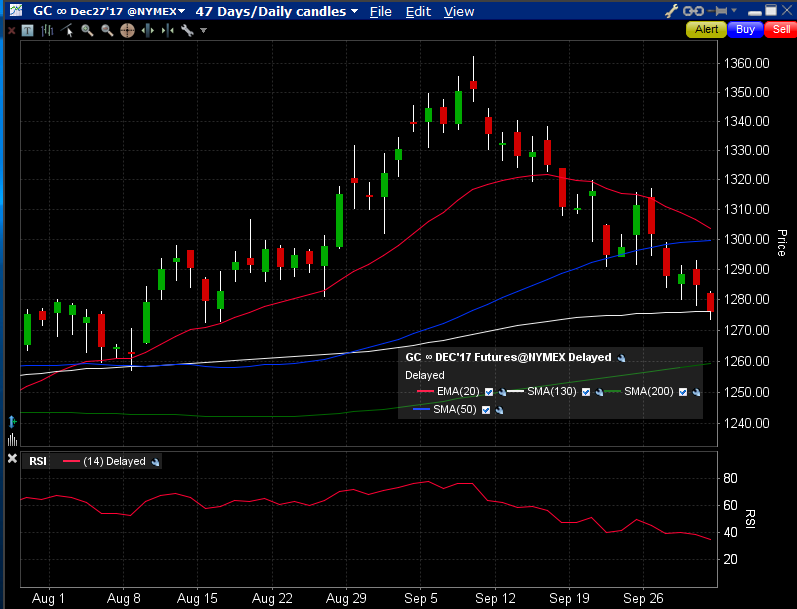
Here’s one more chart showing gold dipping below the white 130 MA and currently sitting on it at 1274.8. This is one to also keep a close eye on.
1 Like
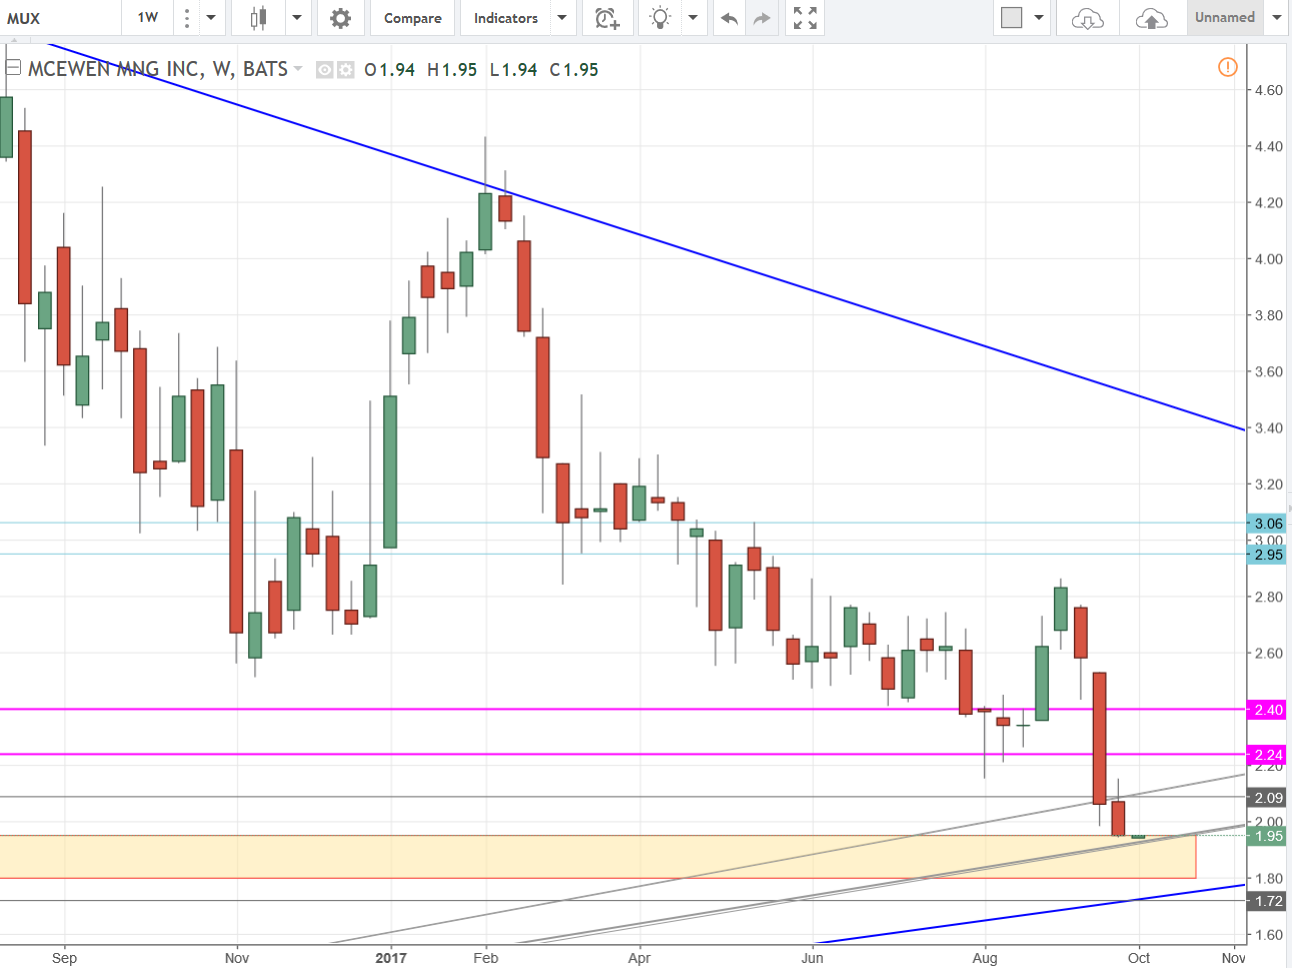
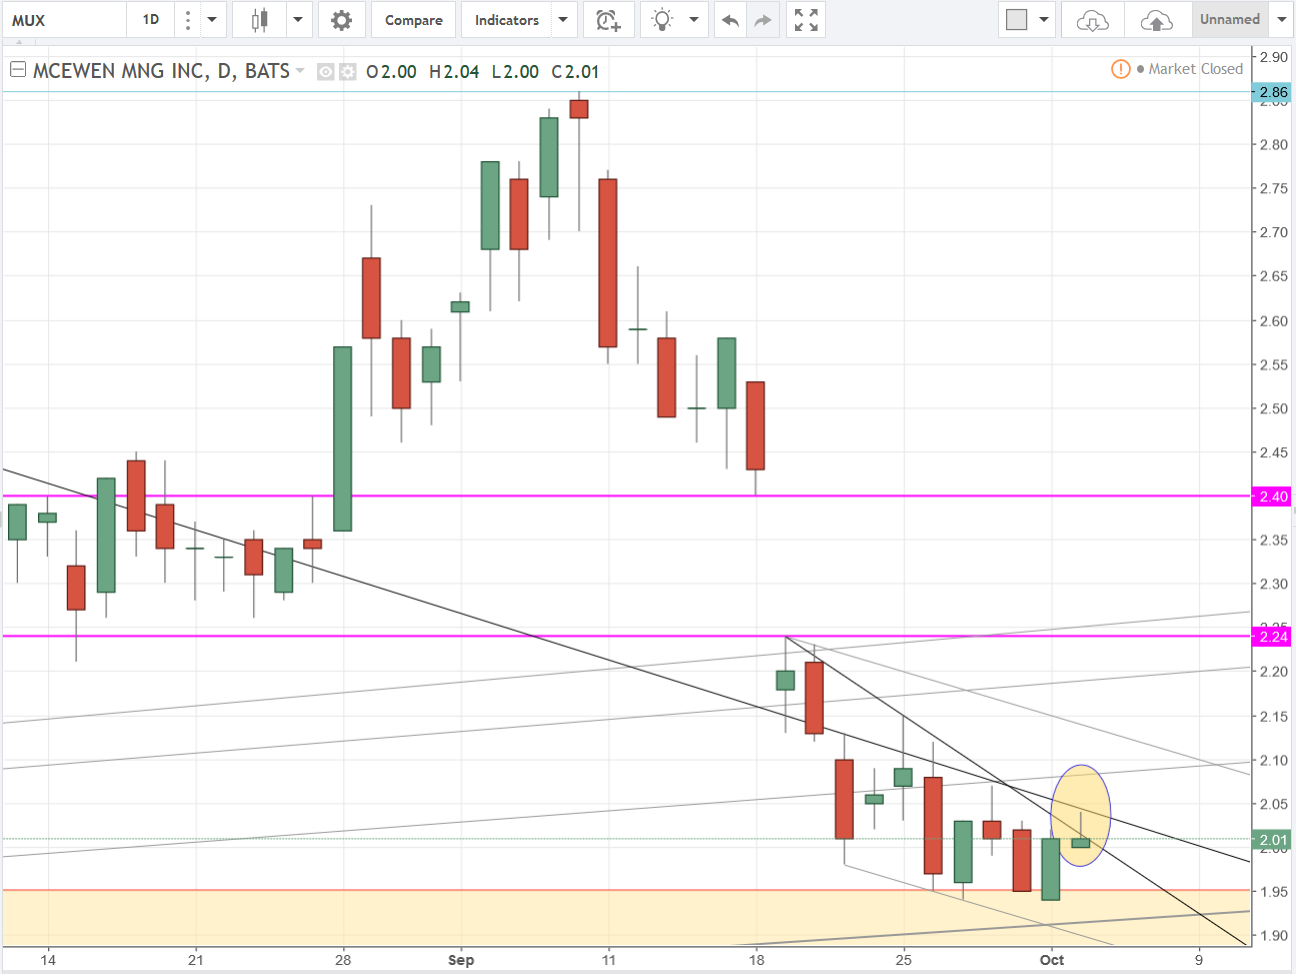
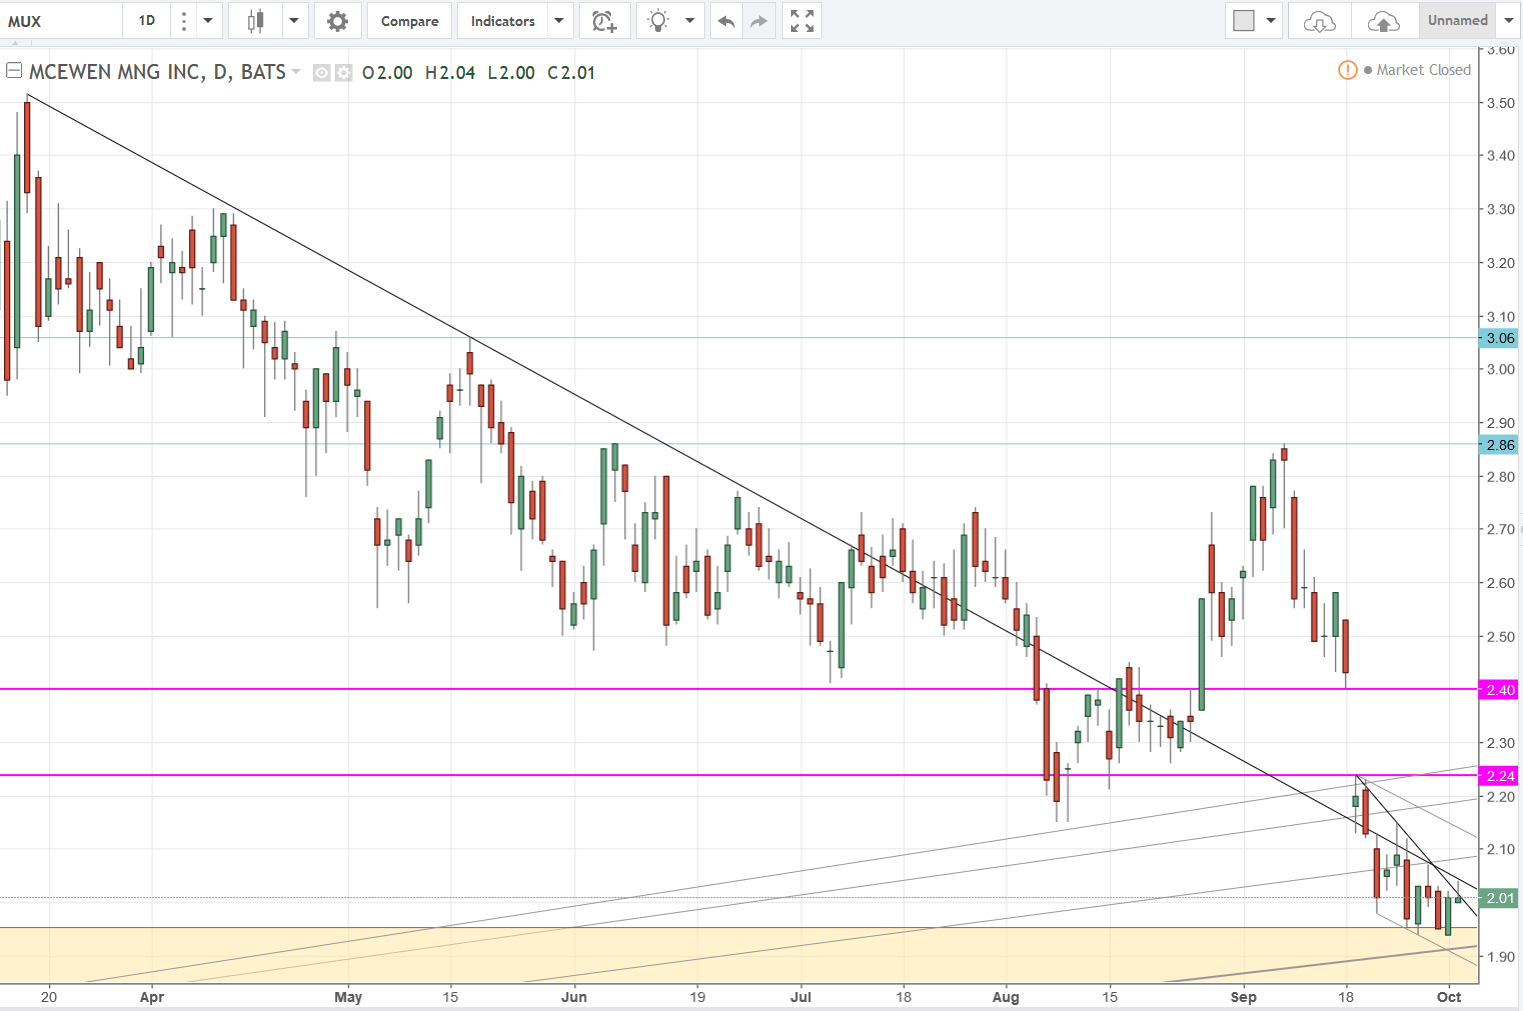
Here’s the update on the MUX weekly interval chart.
You can see the beginning of this week’s candle opening just inside the shaded support range and just above minor trend line support. Remains to be seen if this is it for the drop or not, but if gold heads down to test that 61.8 Fib retracement then MUX will likely see a test of the blue major uptrend line, which will be in the low 1.70’s if it happens this week. Stay tuned…
2 Likes
Hey Rich,
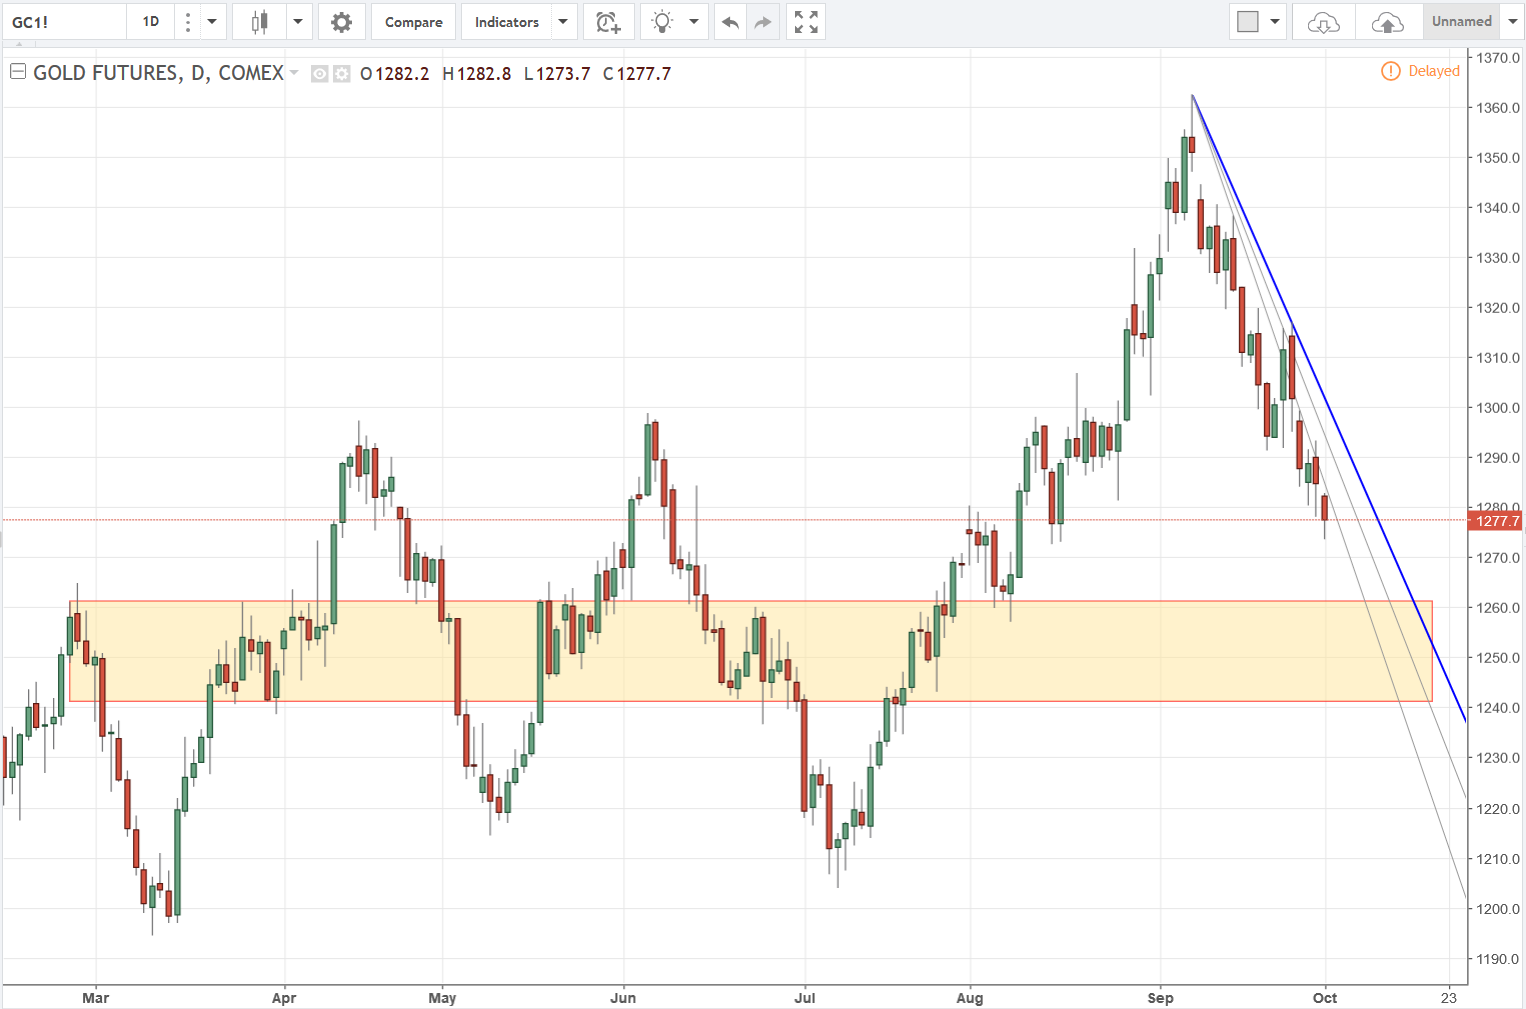
If I recall you are more inclined to use trend lines than channels. But in that first gold chart there seems to be a fairly symmetrical channel forming if you draw the top of the channel from the two highest points (1298 and 1360) and then the lower part of the channel using the 1205 low and projecting it forward at the same angle as the top of the channel. That would put the current gold price at or near a bounce off of the lower ascending trend line of the channel. Hopefully that description made sense. If you could draw a chart with that channel, I would provide you with a hearty thank you. 
Hi Rick. Yes, I am more inclined to use trend lines, but I understand what you’re getting at, and here’s the chart for it…
If gold continues lower, as it appears to be doing in the overnight session, then your uptrend line could provide support to the current candle at just about 1262, give or take a few ticks.
Thanks Rich, that’s exactly what I was looking for.
2 Likes
Wow, I’ve learned a lot lately. THANKS.
1 Like
No chart updates this morning as things appear as though they’ll continue lower. First place to look for support for gold is at the 61.8% retracement at 1264.5. I think it will likely move at least a little lower into the 1260 area and then we’ll see what it does from there.
MUX had a nice green candle yesterday, but the overall formation the last week of trading looks very bearish. I expect to see new lows on MUX this week as things look right now. Of course you know that could change so we’ll see how things progress. As it stands right now I’m thinking I’ll be buying shares in the mid to low 1.70’s.
If I see anything worth putting a chart up for I’ll do so.
2 Likes
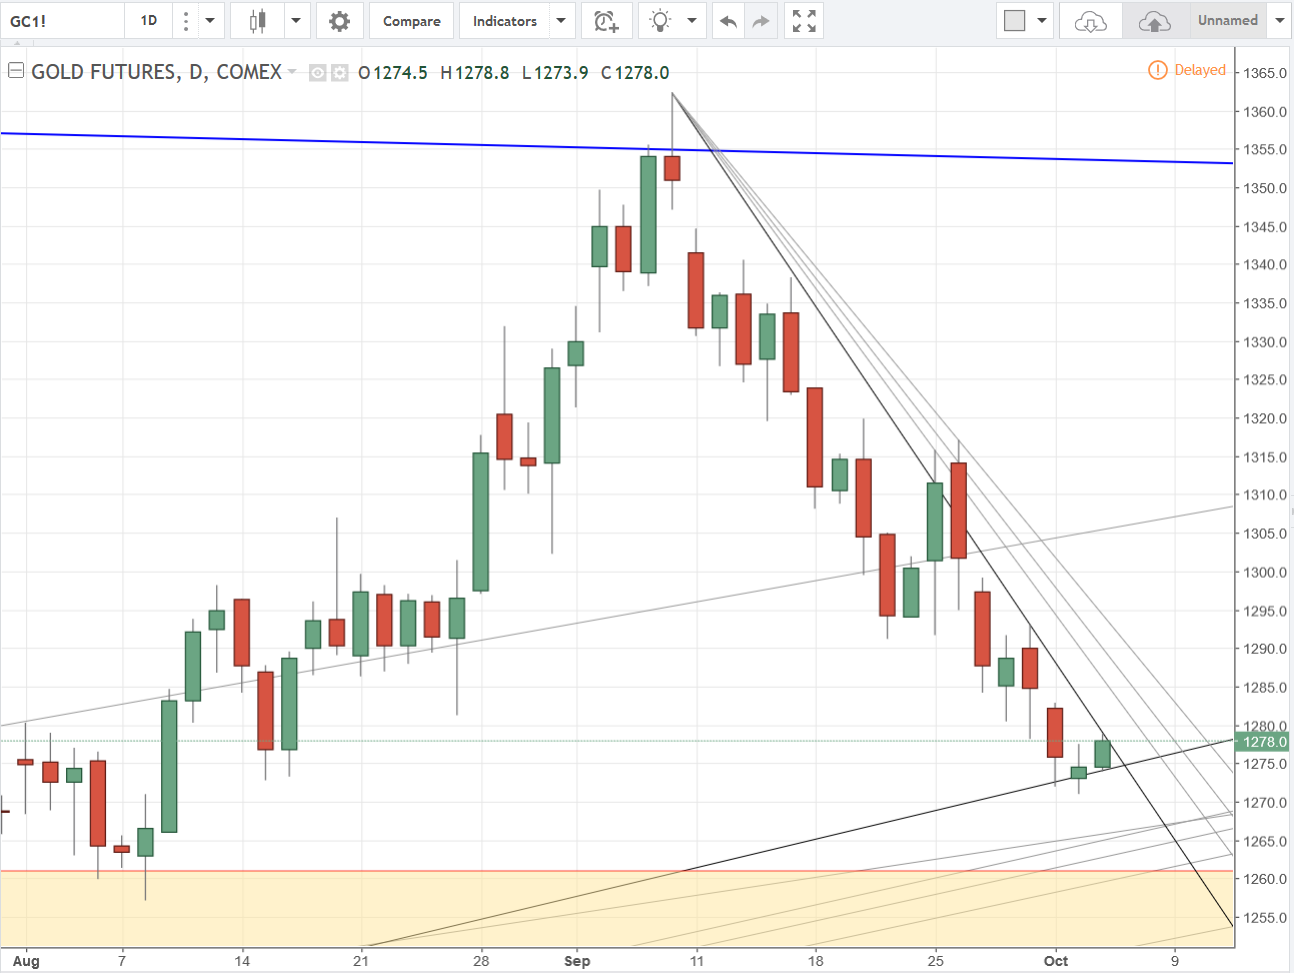
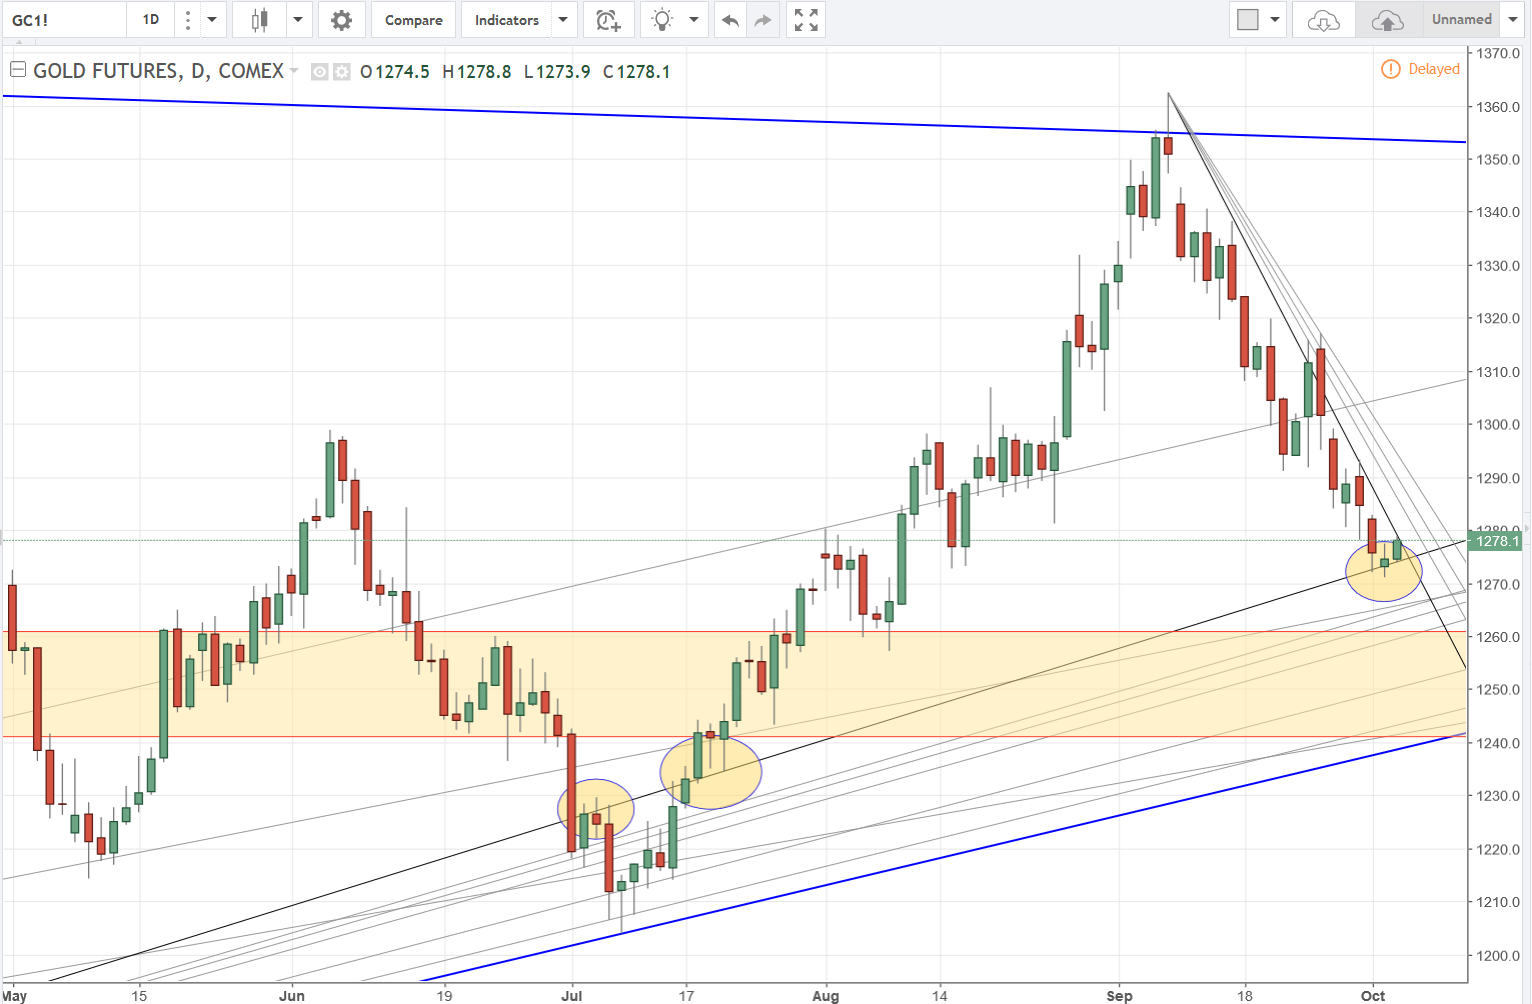
Here’s a quickie for gold. Tonight’s candle is caught between two trend lines which I made black for ease of viewing. In this case, the downtrend line has definitely been stronger resistance than the uptrend line has been support, so I’m betting this uptrend line loses its supporting role and we see lower prices. If gold should move higher here, it has some more trend line resistance to work through which are the grey lines. The second chart shows more info and highlights where the black uptrend line acted as support and resistance in the past.
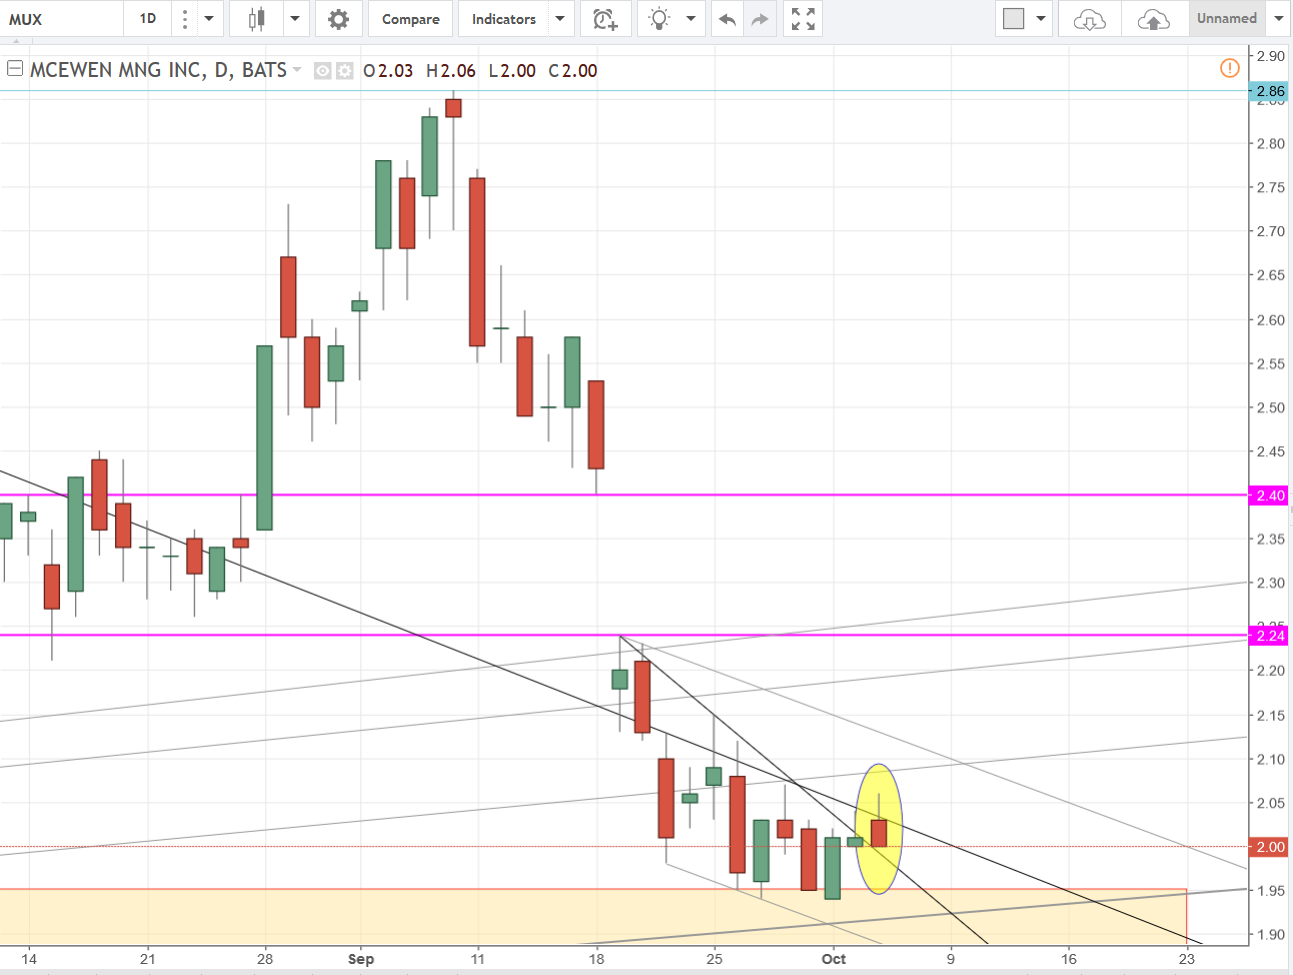
MUX pushed up through its most recently established downtrend line, but bounce off of an older, more strongly established one and ended up closing below both, which I also made black as I did on the gold charts. I expect MUX also to move lower this week and probably tomorrow.
If someone has other symbols they want me to put up here, let me know about it and as long as there aren’t too many, and as long as I have time, I’ll put some analysis up here. (Easymillion I know you asked me before and I couldn’t get the symbol in the software I was using, but maybe this current software will have it, so give me any previously requested symbols and I’ll check).
FNMA. Different sector entirely, but I’d love to see a chart on it if you have time.
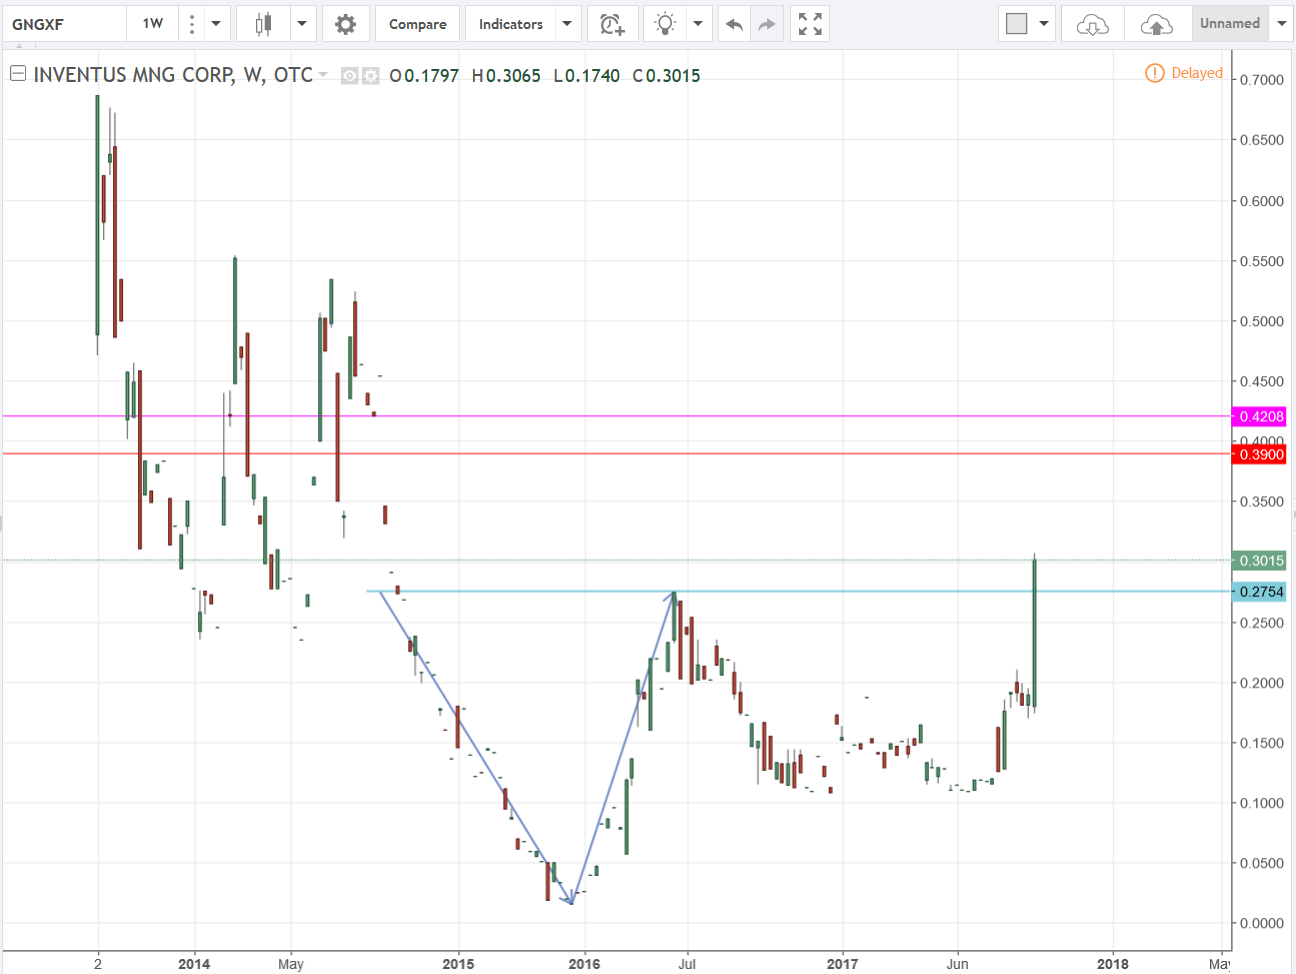
Liquidity is improving! Are there new bulk sampling or exploration results out, or is something imminent? Inventus (GNGXF or IVS.V) has been on a tear this week (up 60%), I didn’t see any recent news. I lightened my position a bit this morning, but kept a core holding.
2 Likes
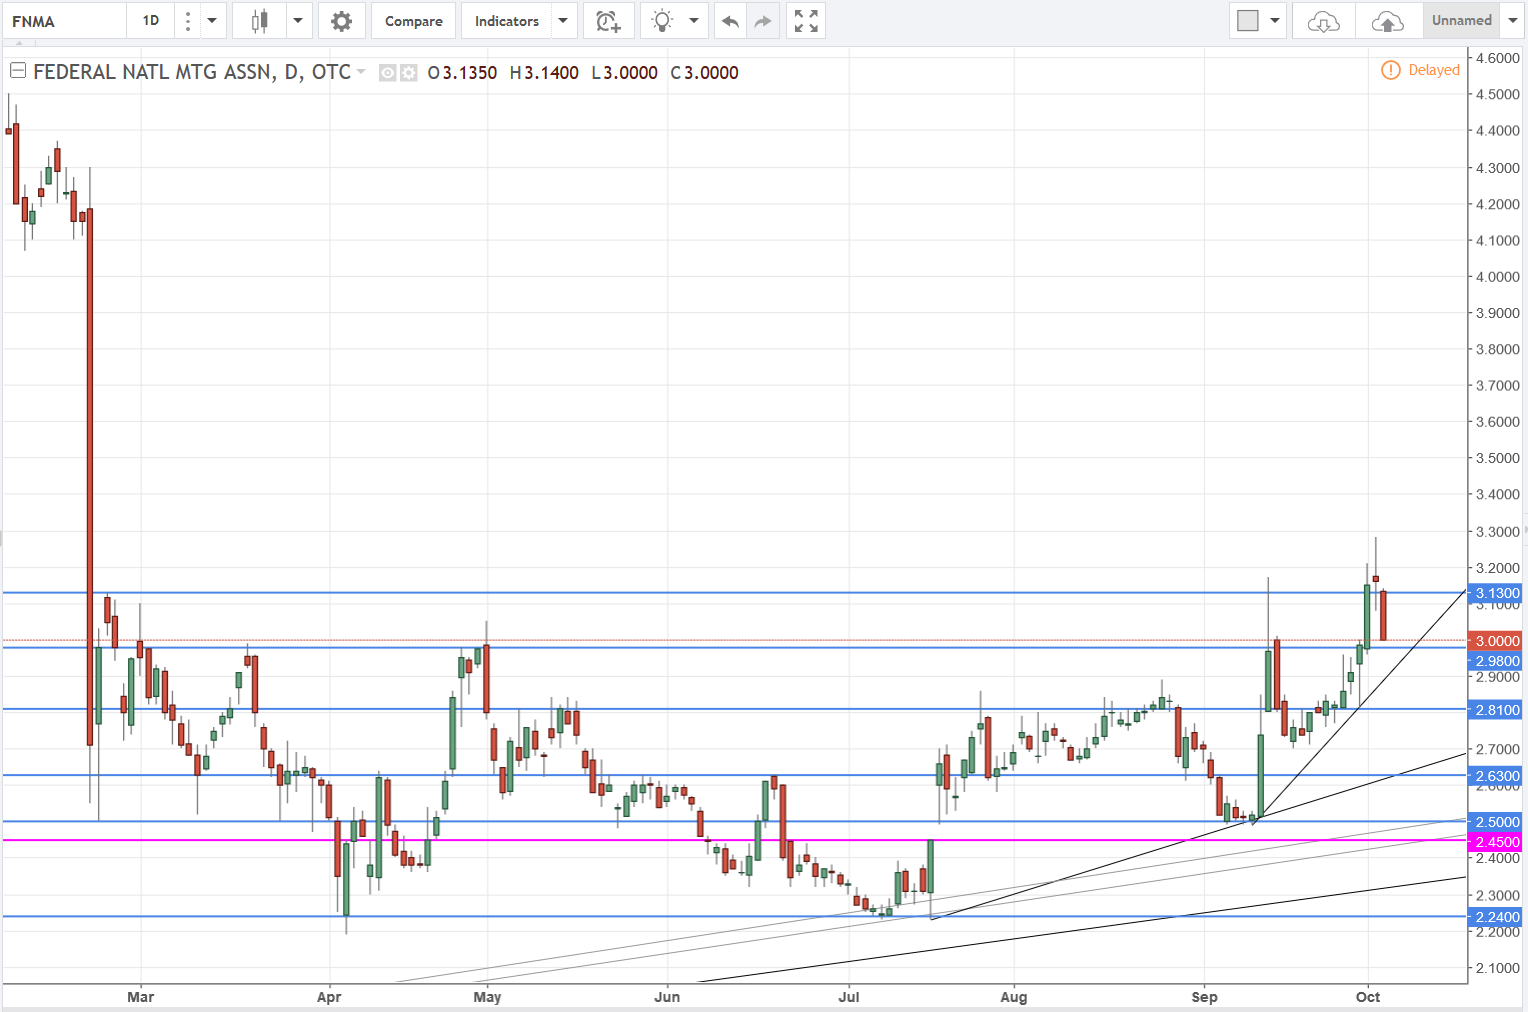
These are all daily intervals for FNMA…
I can tell by the candles that this stock tends to trade a bit choppy, which basically means I doubt there is always a penny between the bid and ask. I know it’s “fanny mae”, and I’m not familiar with how it trades, but the chart gives me the impression it doesn’t get a lot of volume or doesn’t have a lot of MM’s on it. Whatever the case, the chart feels more like an OTC stock with the kind of movement on it that doesn’t allow trend lines to work as nicely as they do on a major exchange stock. So, what all of this means is, I’m giving you an excuse for why the trend lines aren’t going to be as useful as they would otherwise be! They can still be helpful, but you’re going to get a lot of moves below and above all of the support and resistance levels on this chart. Ok, now on with it…
The first chart looks busy, but it’s simple when broken down. The blue horizontal lines represent support/resistance areas. They can be dependable, but it would be better to think of them as areas instead of precise points because this stock doesn’t work that way. The horizontal line at 2.45 is pink because there is a gap there that hasn’t been filled. Gaps usually get filled, but not always, and not always soon after they are created. Some don’t get filled for years or decades, but it is an area to watch since the stock is trading around that price. Lastly on this chart are some uptrend lines that have yet to be proven, so I wouldn’t depend too strongly on them until they have been tested and hold a few more times. The second chart is a close-up of just the trend lines.
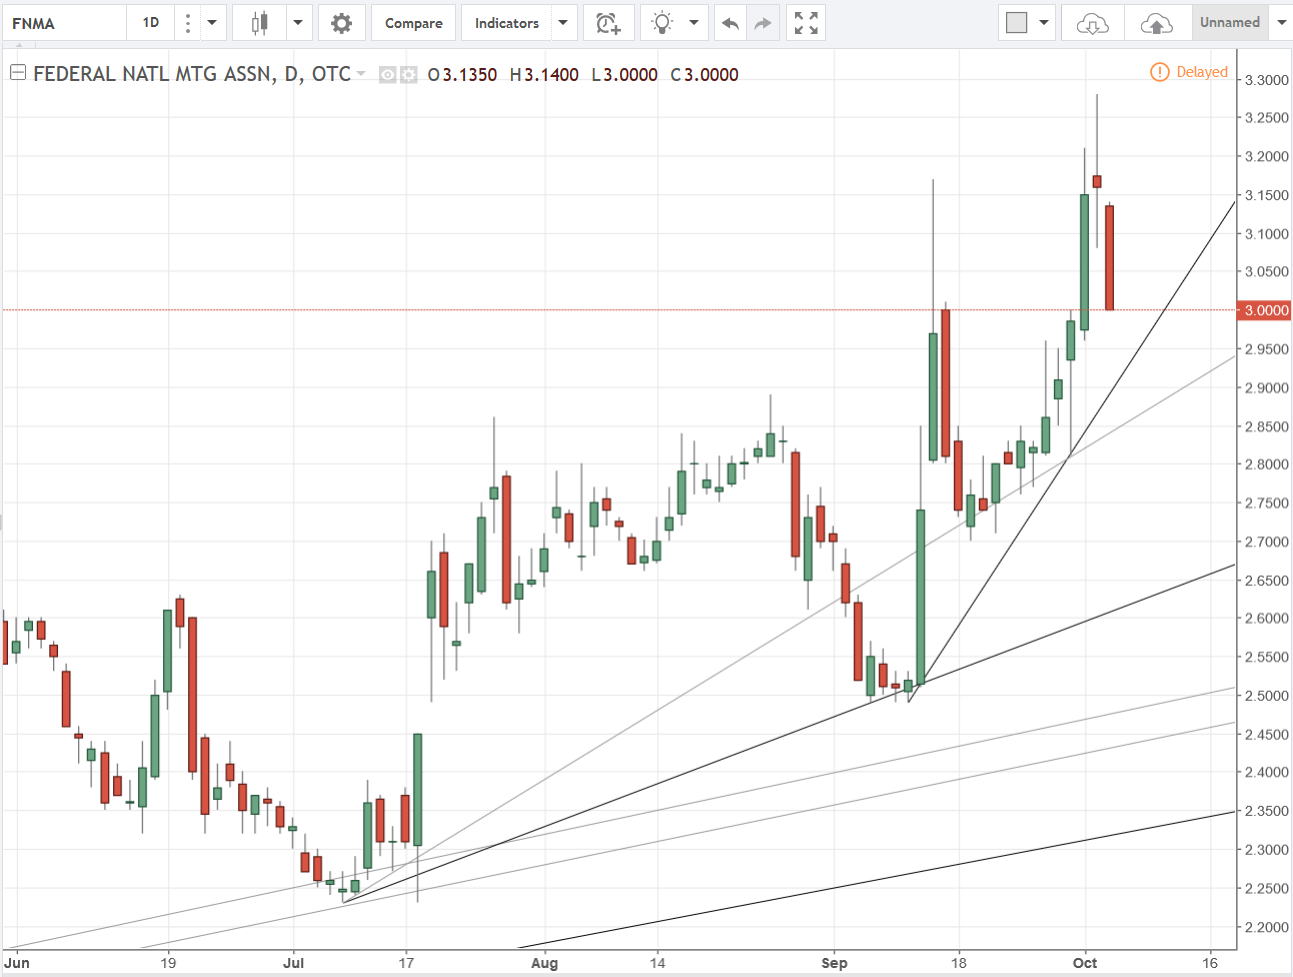
The last chart is a Fibonacci grid covering the price movement from the day the stock had a dramatic drop in late February. The highlighted portion points out that FNMA has retraced 50% of the drop and today so far is pulling back from that level. The charts above should help to determine where support will be found on this decline. Overall, the stock does seem to be starting an uptrend. It certainly has had a tumultuous ride though!

It’s breaking out of an adam & eve bottom formation. It’s easy to see on the weekly interval. ![]()
The measured move of the breakout would be to .39. There’s a gap to fill at .42.
1 Like
Since I’m here already, here are updates for gold & MUX on the daily interval charts.
Gold pushed up through its first downtrend line and just about hit the second, then dropped. It may continue a consolidation for another day but at this point I think it’s headed lower by Friday.
Notice where MUX opened on today’s candle. Just below that older, pretty well established downtrend line. It pushed higher early and then dropped. I expect it to follow gold.
1 Like
OK, Thanks Rich. Very nice to see. Answering my own question … I now see some bulk sampling is just getting underway. Some nice photos and timely progress on their blog:
I’ll be interested to what results are reported.
All my mining stocks did well today?
Inventus has been pushing higher primarily because they’ve begun the bulk sampling program and have been posting pictures on their website:
They were also at a mining conference in mid-September - the first marketing they’ve done in over 2 years. Here is the presentation:
")
And finally (and not insignificantly), Inventus’ Pardo property sits on a paleo-placer deposit that has been compared to the Witwatersrand deposit in S. Africa (the largest gold deposit in history and where 50% of all the gold ever mined on Earth came from.
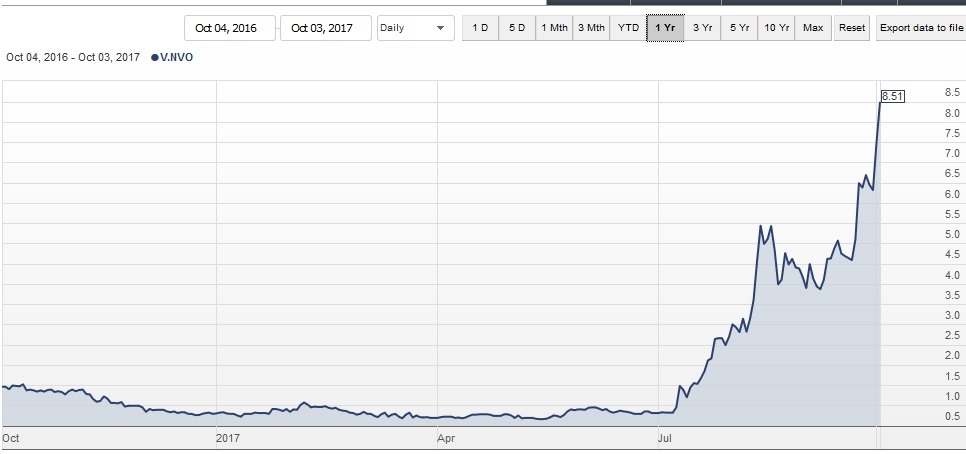
Another Wits-like deposit has been discovered in the Pilbara region of Western Australia and has created somewhat of a new gold rush in Australia. Australian stocks with claims in this area have been taking off, most notably NOVO Resources (V.NVO) has run from .50 in July to closing at $8.51 today. So Inventus and NOVO have always been linked as paleo-placer sympathy plays even though their deposits are on 2 different continents. I think a lot of people who got wind of NOVO et al in Australia are also finding out about the potential of Inventus.
2 Likes
Ugh. It’s too bad I have so few shares of IVS.
Great work to those of you who held on though. Congrats!