Jul. 16, 2018 10:10 AM ET|About: McEwen Mining Inc. (MUX)|By: Vandana Singh, SA News Editor
McEwen Mining (MUX +0.9%) reports Q2 consolidated production of 36,959 (+66.5%) gold ounces and 772,432 (-0.9%) silver ounces, or 47,258 gold equivalent ounces.
In July 2018, new Preliminary Economic Assessment study on the potential restart of production from the El Gallo Complex (Project Fenix), was published.
Select outcomes from the assessment: Average annual production rate of ~47,000 ounces gold equivalent, low initial capital cost of $41M for Phase 1 and $30M for Phase 2, and pay-back period of 4.1 years.
McEwen Mining Reports Q2 2018 Production Results July 16, 2018
TORONTO, July 16, 2018 (GLOBE NEWSWIRE) – McEwen Mining Inc. (NYSE:MUX) (TSX:MUX) reports consolidated production for Q2 2018 of 36,959 gold ounces and 772,432 silver ounces, or 47,258 gold equivalent ounces(1)(“GEOs”), using a 75:1 gold to silver ratio.
Life is not to be boring… Find another hobby helps.
I was bored during the snow months…Then I threw my hat into the volunteer ring at the local high school.
In metal shop classes, helping young adults both men and ladies learn how to weld.,
That was three years ago, and haven’t regretted since. Very rewarding.
When schools out for summer, I have enough other things to keep me busy. The “To do lists”.
Which I should get at… but I really came here to ask about charts on this stock
GTN. I can only afford small fish in this price range now days.
Thanks in advance. Take care. Cold S.
Thanks for the advice CS. I’m not really bored. I’ve posted it a few times with intent to be humorous and I know humor doesn’t always come across in writing so my bad.
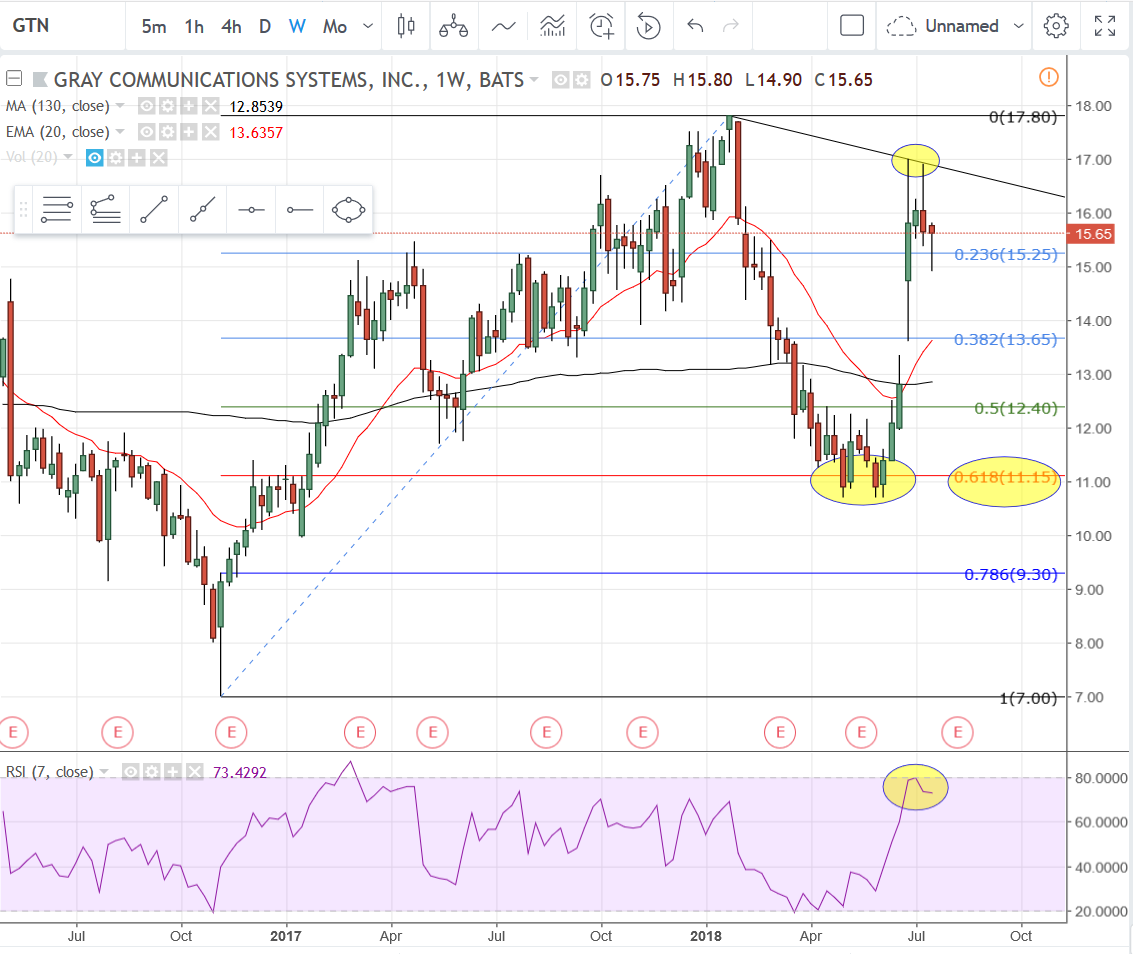
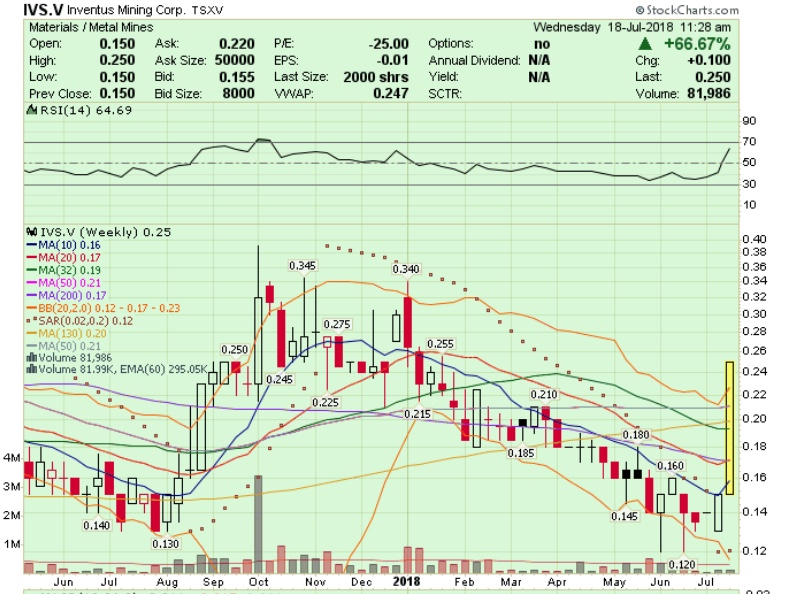
As for GTN, I’m assuming that this is an investment, so I’m posting the weekly and daily intervals and commenting from an investor’s perspective and not a swing trader’s.
This stock is having a nice, strong uptrend so far. I laid out the Fib retracement from the last major low to the recent 17.80 high. It did a nice 62% retracement and appears to be looking to retest the high. Before doing so, if you look at the RSI line, highlighted at the bottom portion of the chart, GTN is overbought on this large time frame so I would expect some sideways movement and even some retracement back to the red 20 EMA, which is currently around 13.60 and moving sharply higher each day. If it dips below that you’ve got the 130 MA currently just under $13 and starting to turn upward which is good. As for immediate resistance, you have the black downtrend line currently just below $17, and then the previous high at 17.80.
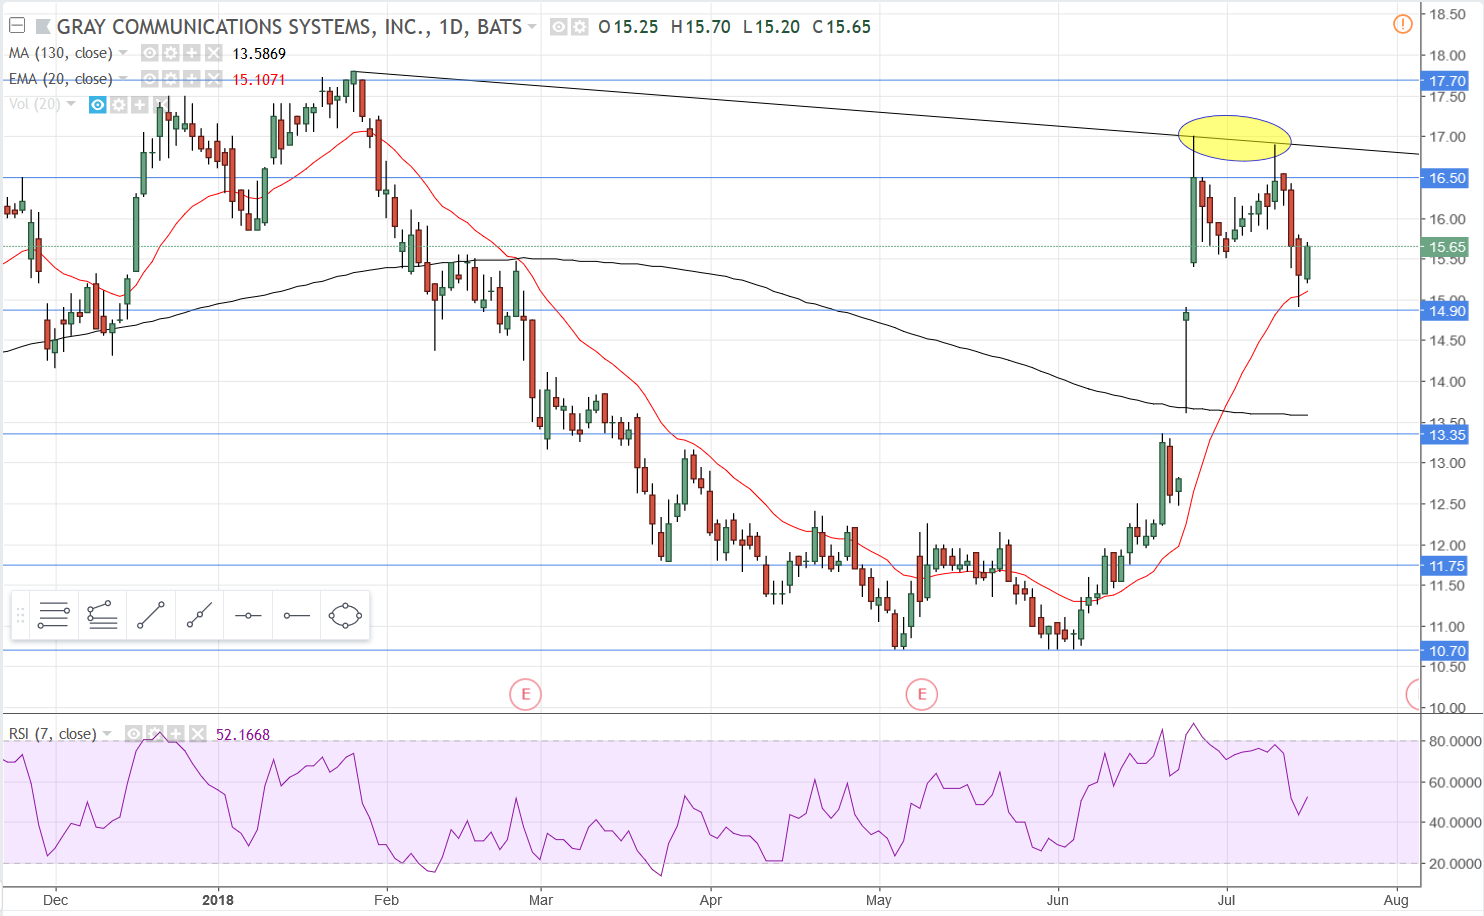
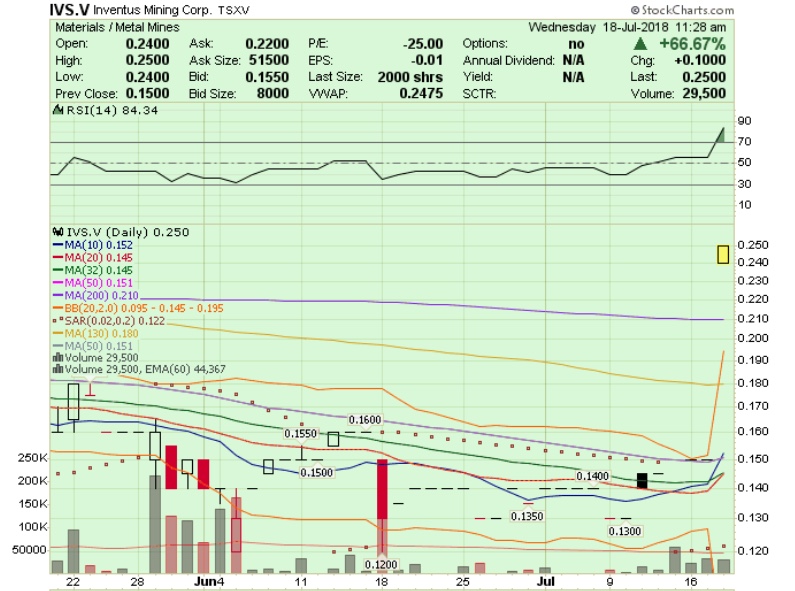
Next chart is a daily interval, which tells a slightly different story. The pullback that has occurred from the highlighted area, again showing trend line resistance, held the 20 EMA on this time frame and the cluster of 15 candles may be forming a bull flag. I notice that this stock tends to have a 5 cent spread, which means it moves in 5 cent increments instead of penny increments. That will make the charts and formations look more “clunky” and a little harder to interpret, but the tools still work well enough. If I’m long this stock I want to see more of a consolidation with price drifting a little lower so that the weekly RSI makes some room for more upside. The blue horizontal lines on the chart are major support/resistance areas, and I wouldn’t mind seeing even an eventual retest of the 13.35 support area before making a run for previous and/or new highs.
Overall the stock looks strong. I would become concerned if it revisits the 17.80 high and has trouble moving higher. You would want to be watching closely to make sure a double top hasn’t formed. I would also not like seeing price linger for too long at the 13.35 support, especially if there appears to be continued selling below it. Feel free to ask at any time in the future for an update.
Almost all the commodity space is falling now. Look at the last 30/60 days in copper. Commodities have been closely tied to the Chinese economy since the initial big price increase from 2009 to 2011. The last 30/60 days do not look promising. I have seen YouTube videos from English speaking folks living in China made in the last month saying that housing prices are starting to fall in China. And I have read totally separate accounts that the same is happening in Austrailia, which is closely tied to China and their building boom / commodities / mining.
Combined with the falling Chinese currency against the USD and official credit creation data out of China all points to a slow down -> now showing up in all the commodity prices. The U.S. has not felt much yet, probably due to the tax cut / fiscal stimulus. But all of this seems to indicate evidence that the emerging overall trend is a slowing / down trend in commodities.
If you go back a couple of weeks I probably made the exact wrong call in the copper price suggesting it was about to go over $3.30. Now down to $2.76.
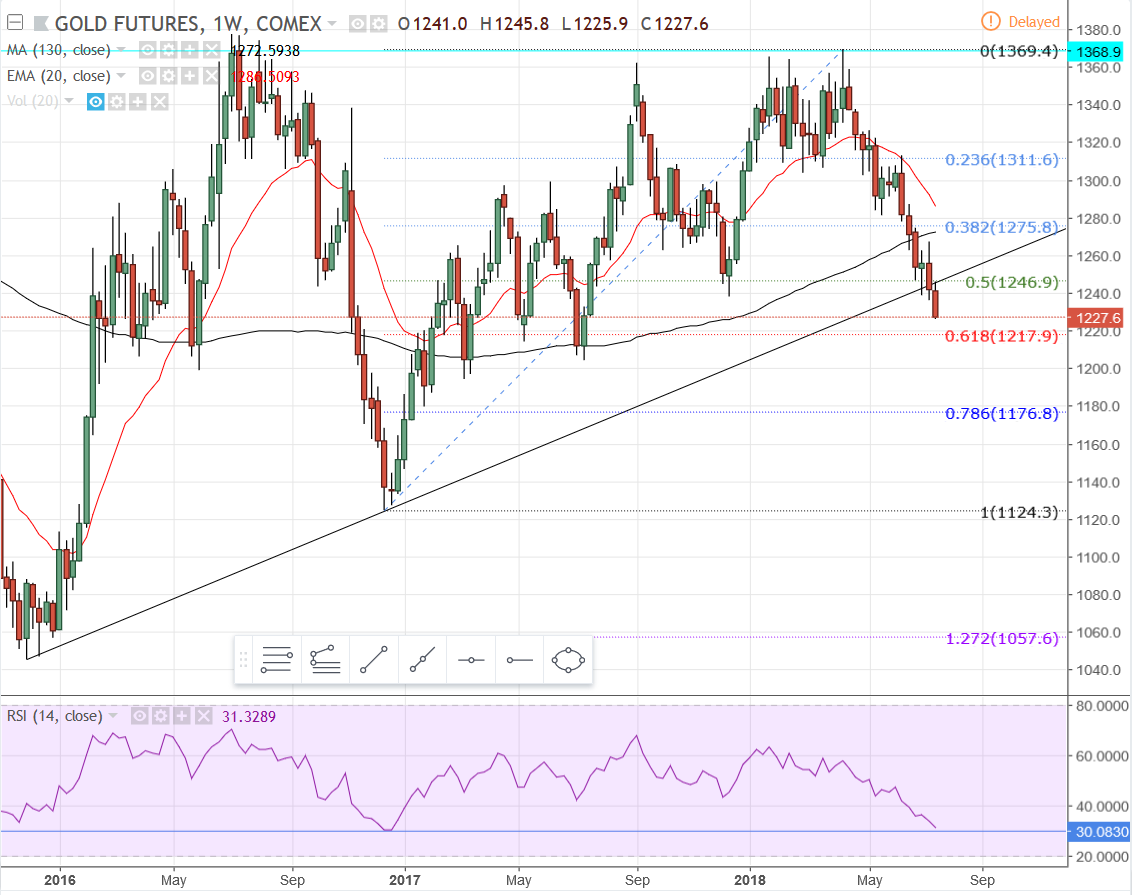
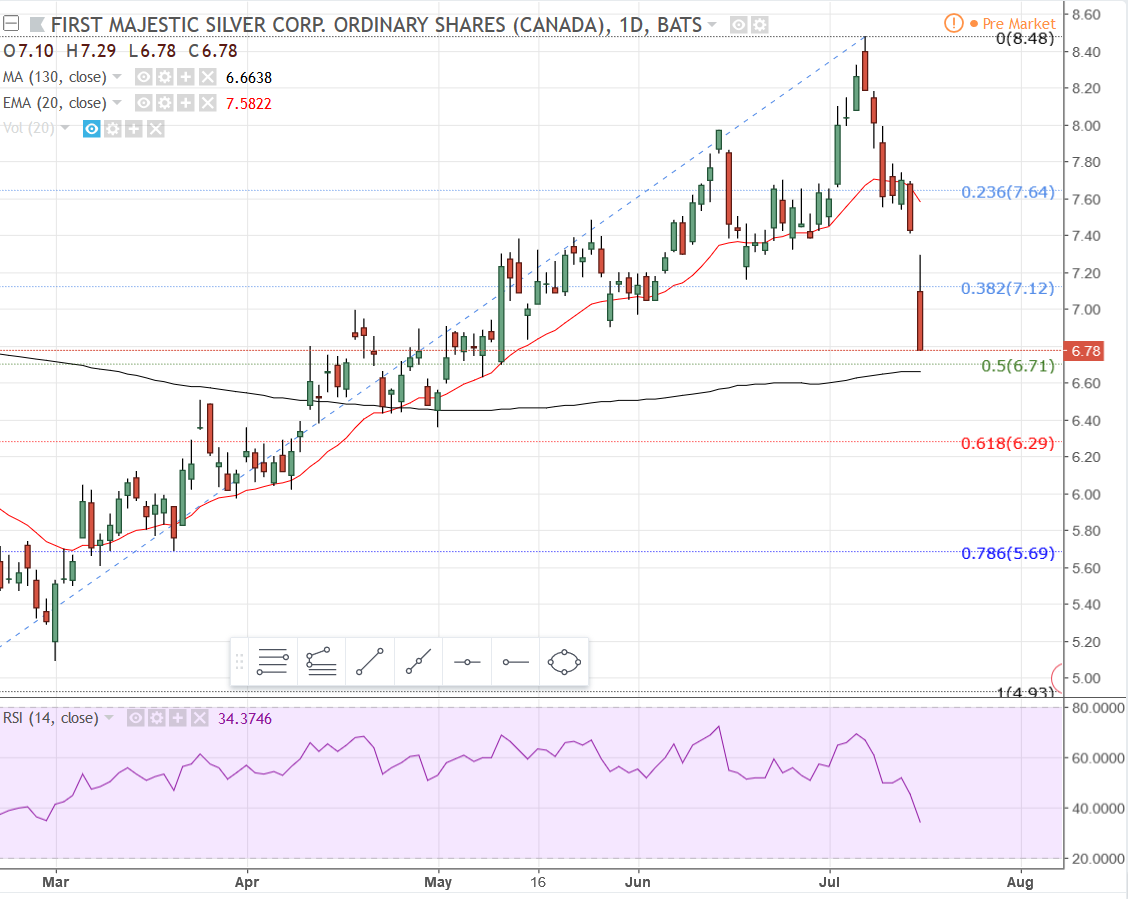
The two charts that follow are both weekly intervals for gold first, and then silver. Gold has lost uptrend line support and is headed for the 62% retracement mark. The RSI at the bottom is nearing the level it reached when it hit its last major low. It is getting oversold in any case, so we’ll see if it gets any kind of bounce in the next couple days.
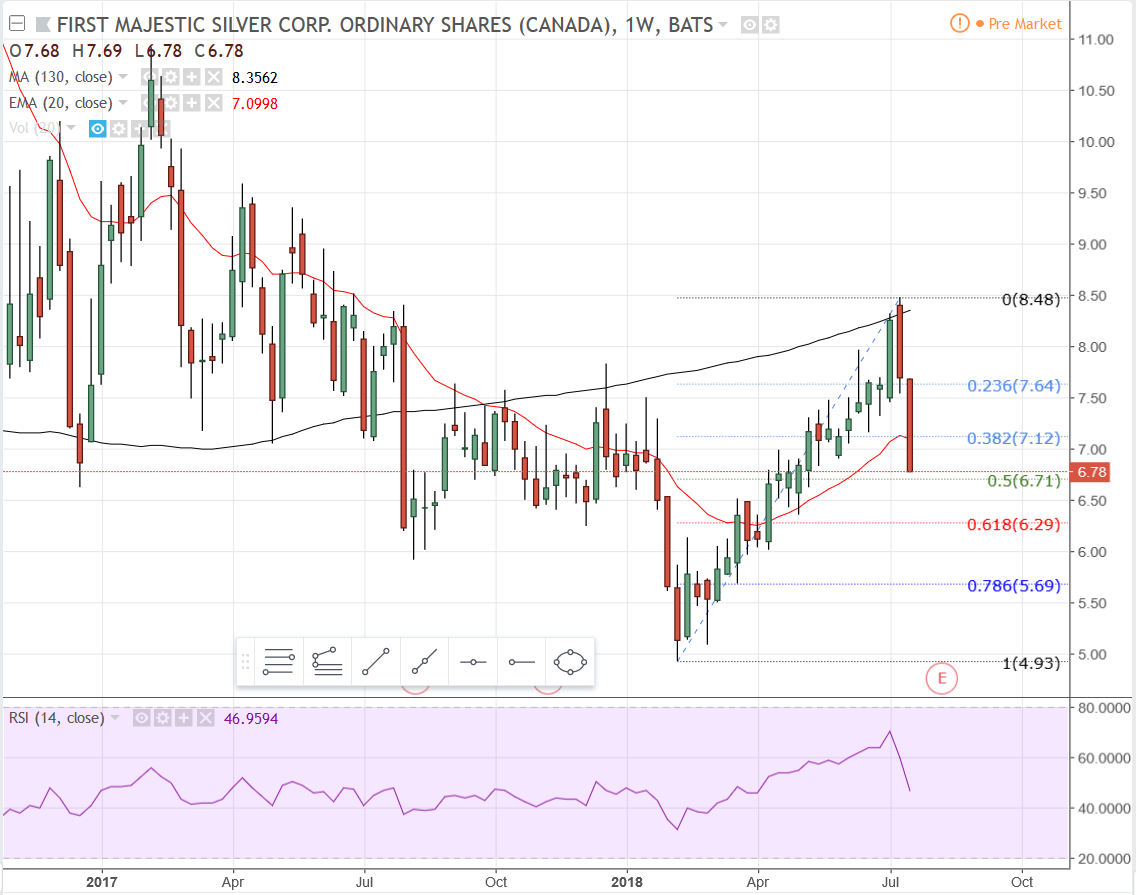
AG has fallen below the weekly 20 EMA and appears to be heading to the 62% retracement. There should be some support there. There might be support at the 50% retracement with the 130 MA on the daily interval sitting right below. If those are lost as support it’s likely AG revisits the lows around $5.
Must be the Pardo project is showing results. HR’s post from April last year spell out test result from a Steinert XRT ore concentrator from a small bulk sample taken from a rather unremarkable section of the deposit.
The 1000t bulk sample last Dec was processed at the Black Fox mill.
More bulk sampling was planned for this summer.
Wonder if a new 43-101 Technical Report that was to be prepared is indicating good to better results than expected.
Keeping an eye on McEwen and Sprott involved companies usually pans out!
ASX listed Artemis Resources has beaten mining giant Rio Tinto to a prospective copper-gold tenement just 40km east of Newcrest Mining’s Telfer copper-gold mine in Western Australia’s Pilbara region.
The small cap junior explorer applied for the 600 square kilometre tenement, known as the Armada Prospect, about 3 hours before Rio Tinto, which perhaps says something about its prospectivity.