Yeah, I watched that and thought it was fascinating. It took balls to do that live, but obviously they had a lot of confidence in the deposit. Funny, how you can produce all the facts and figures in the world, but nothing captures the attention of the investing public like a live demo of what’s going on in the field. No wonder the stock took off after that.
Ditto that - starter position in Artemis. Congratulations. You must have opened your Interactive Brokers account and had your funds clear. I also picked up more MUX, based largely on conference call. Inventus is starting to turn green for me with recent activity, but I’ll wait for it 'til there is some news of substance for it to produce a significant ROI. Patience with all three as all are long plays. Inventus has been longer than I like. The one quote that stuck in my mind from DOC’s most recent post on the main thread is:
Where you have some capital discipline like in the old days, it’s the companies that decide when a project is developed, once it is into a low-quartile and has a long life. David Harquail
The goods are definitely in the ground! Pilbara conglomerate plays will pay off largely as a result of defining the resource. That’s what the joint venture between Artemis and Novo Resources is all about. Rather than just bulk sampling, companies need mine permitting and plans based on the size of the resource to do the actual mining. It will a take some time for things to move up in a really big way when the risk is gone and the mining starts.
1 Like
I’m actually still waiting for my Interactive Brokers account to clear. I bought dual-listed pink sheet stock through my TD Ameritrade account instead. I used to have to call in an order on the dual listed stocks, but now apparently TD can do it all electronically.
Pacton Gold (PACXF) on the move this morning - up almost 10% on 3x above average volume
Good morning Rick, do you know how many shares outstanding it has?
95 million
130 million fully diluted shares if you take into account outstanding warrants and stock options.
1 Like
Information can be found at the equity’s website:
That can be a little outdated. I usually go to sedar.com and look at the latest filing.
2 Likes
TR…if you have a chance, could you chart PAC.V and NOV.V and any thoughts would be appreciated. Supposedly some news to be release next week. Usually stocks seem to run on expected NR, then drop after. Just wondering if they’re in overbought territory
This week’s Sprott weekly round up. Eric Sprott comments on the Pilbara stocks and the gold18@perth conference this week at about the 10 minute mark:
https://www.sprottmoney.com/Blog/if-the-us-dollar-goes-down-you-might-want-to-own-gold.html
I’ll see what I can do over the weekend.
1 Like
Which exchange did you buy Artemis?
ARTTF… pinks
1 Like
Great, thanks!!
I get PAC.V but no NOV.V. Does NOV.V have a symbol on the OTCC I can look for?
Novo Resources Corp NSRPF
Primary Symbol: V.NVO
2 Likes
The NVO.V worked for me, not the NOV.V from the above post. Not sure if that was a typo or not.
Novo Resources Corp. (NSRPF)
The problem I encounter with OTC orders is that Fidelity charges a flat $50 currency exchange rate fee regardless of the order size. I’m sure other brokers must have a better fee on certain foreign traded equities. than what Fidelity charges. I went with NVO:CA for trading Novo Resources using Fidelity as a broker where the currency exchange fee is about $14.75 (depends on currency exchange rate).
TDAmeritrade charges $15 plus the regular broker fee.
PAC
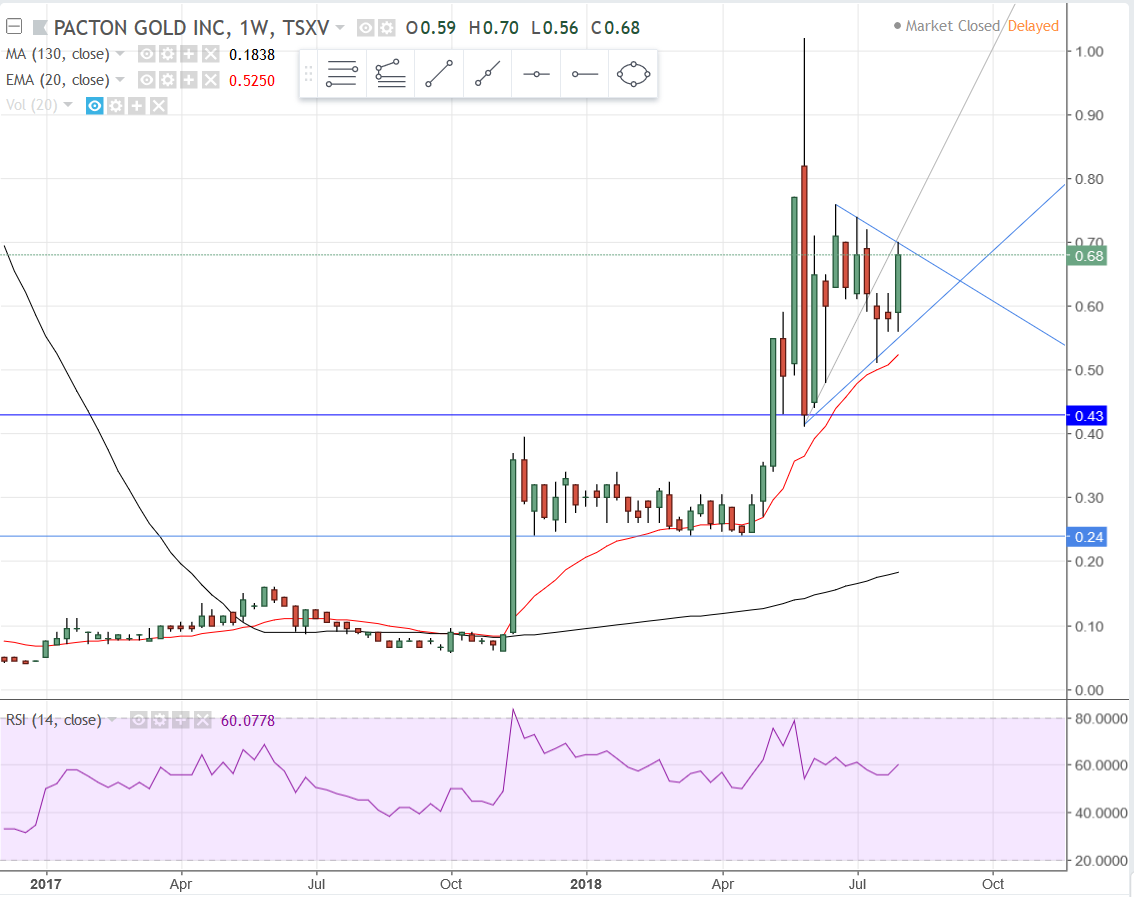
Weekly Interval: This stock has been in a strong uptrend. The 20 EMA on this chart has been the buy point all year. The story here now though is that large red candle, which had some monster volume with it. That may be a turning point for the stock, but it’s been consolidating with higher lows and lower highs so a battle between bulls & bears is going on between the two blue lines of the pennant formation. The key on this chart for bulls is the 20 EMA, and then the support area between .40 - .43.
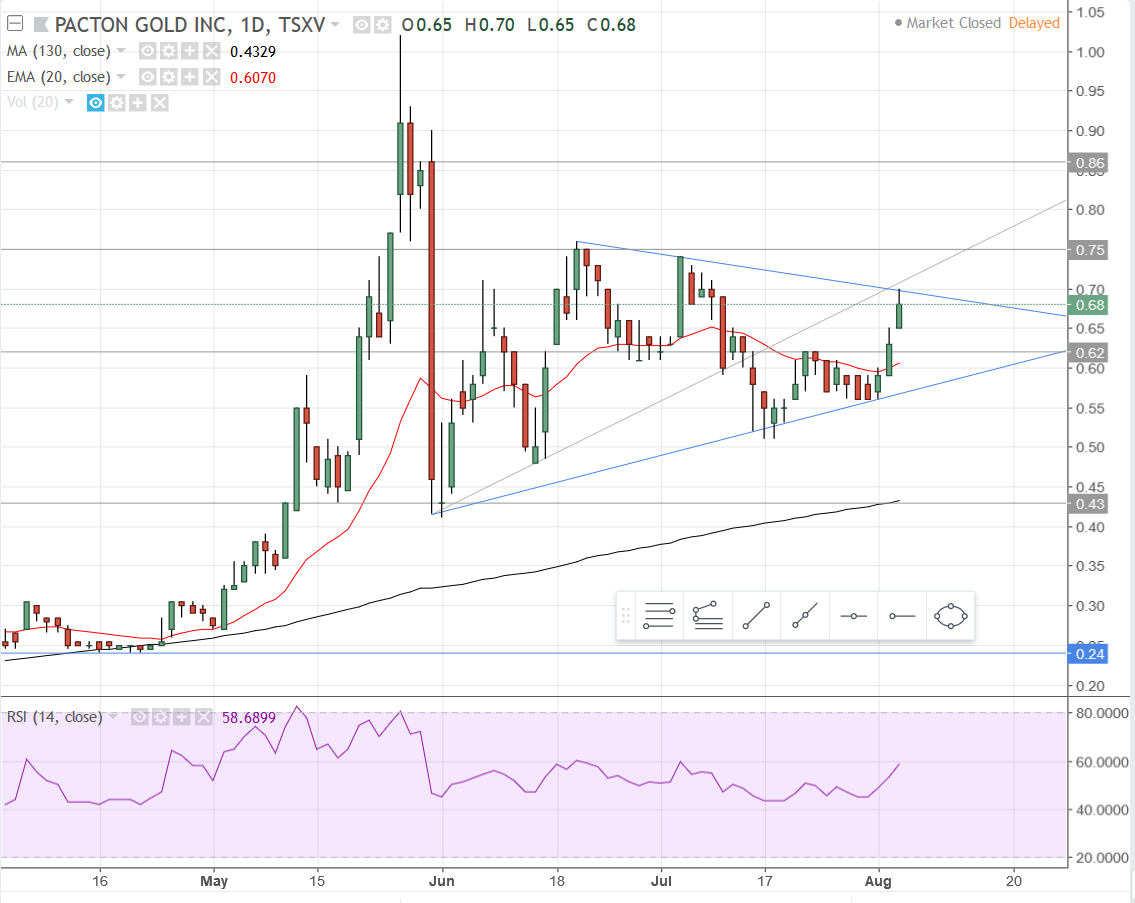
Daily Interval: Here you can see the narrowing price range that will potentially culminate into an impulse move one way or another. These moves typically occur at 2/3 into the formation, which is where we’re at now, so it could occur any day. If the impulse move should be down, the 130 MA is conveniently sitting in the lower support range mentioned above, currently at .4329.
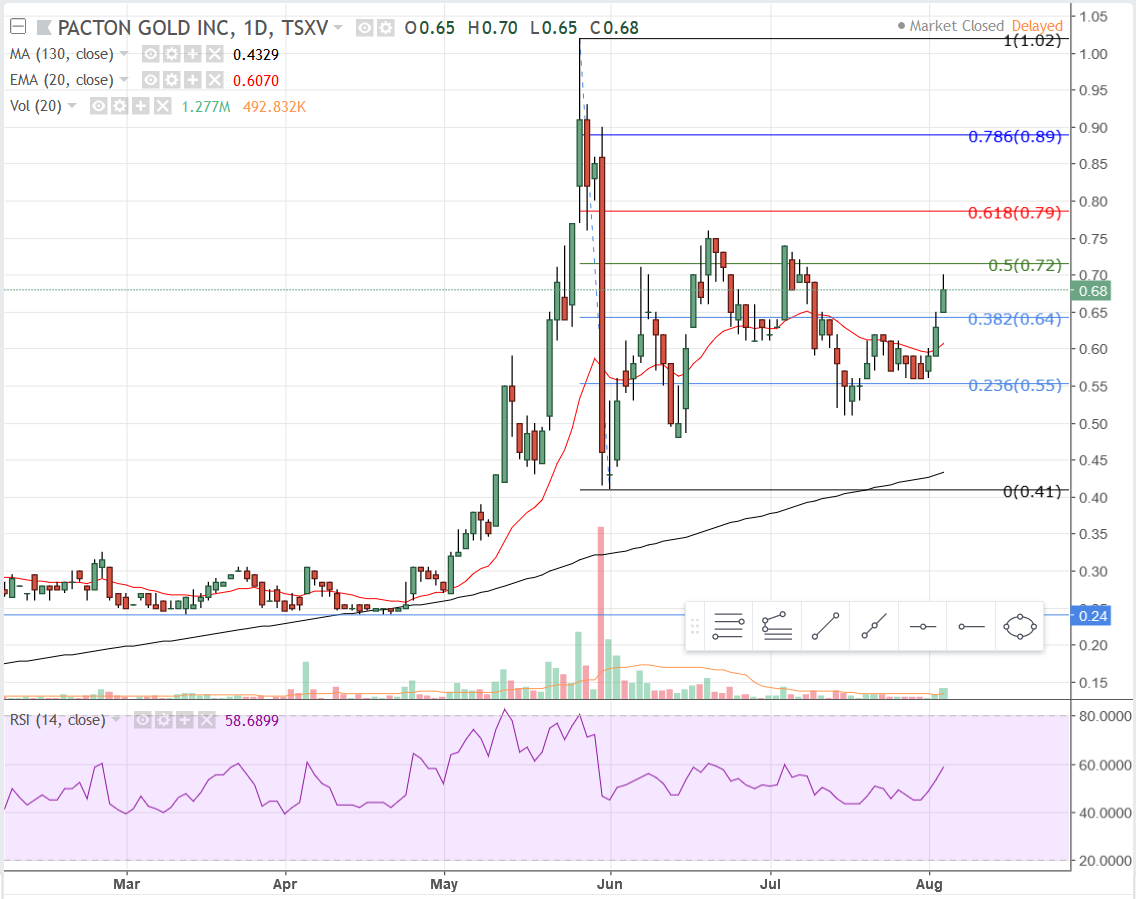
One concern for bulls here is that so far the stock has not quite hit the 62% retracement, a sign that may be foretelling of a move lower. If you’re long you want to see it move up through the 62% level and on to the 78.6% level, which more often than not is indicative of a move back to previous highs.
2 Likes