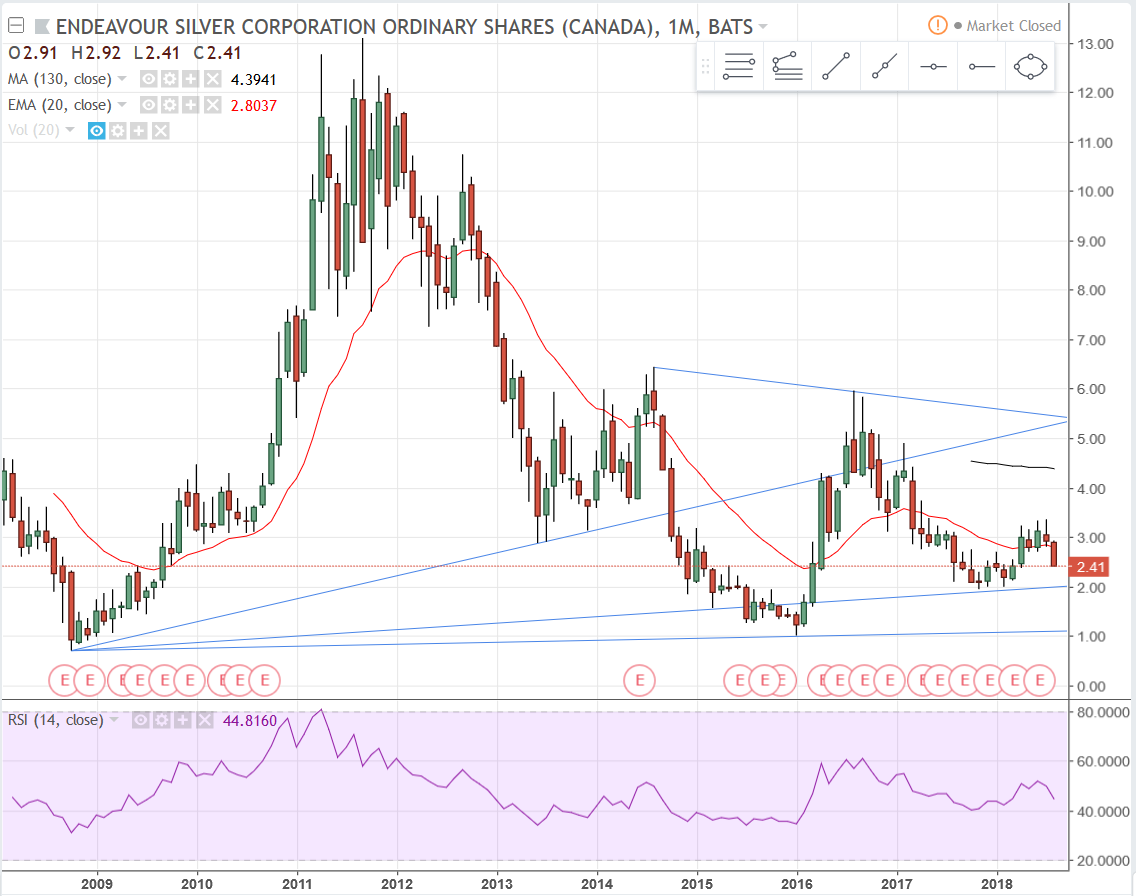
Monthly Interval: This had a nice run from late 2008 to early 2012, where it fell out of a bull flag, started a downtrend and has been in one ever since. In order for it to “officially” show the first signs of an uptrend on this chart, EXK needs to get above 3.50 and establish support at that price. That’s for a long-term investor with intent to hold for years/decades to come.
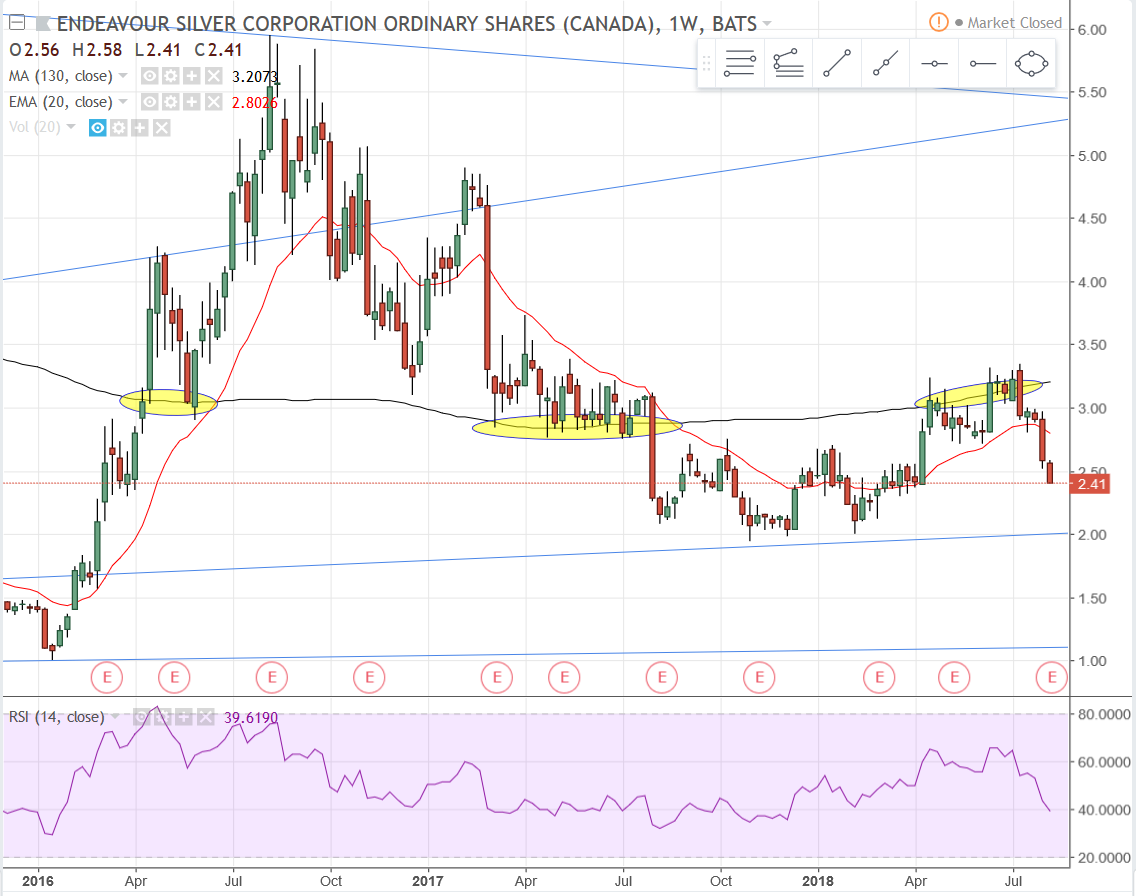
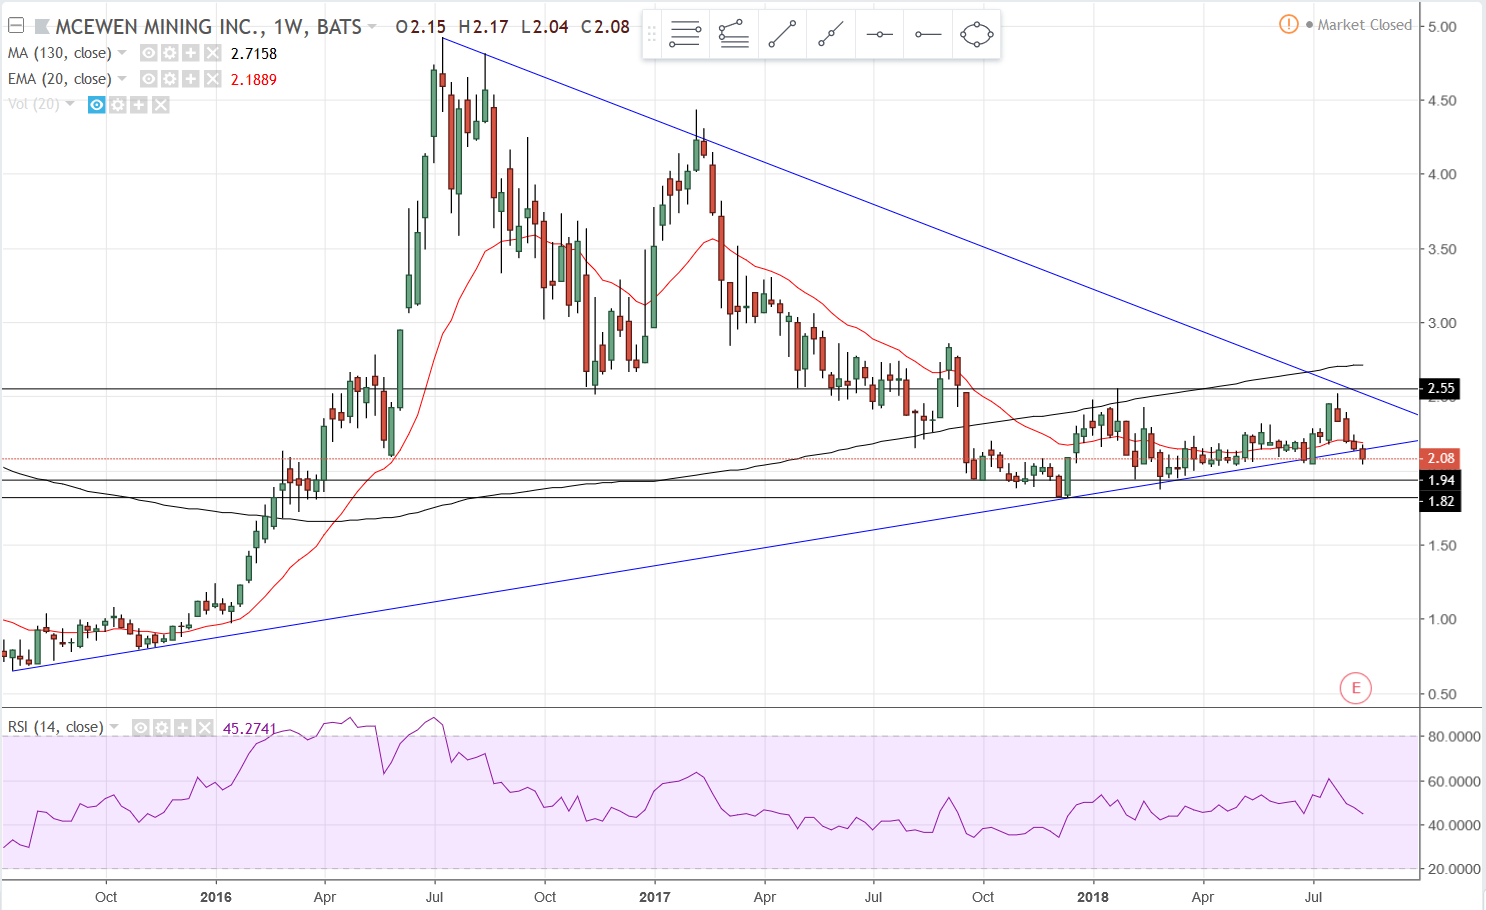
At the start of 2016 it made a nice run. Pushed through the 130 MA resistance, pulled back and found support there and went to new highs, but couldn’t get through the $6 resistance level, which is a strong level of resistance for this stock. It pulled back down to the 130 MA support and held that level for several months, but it was forming a bear pennant while doing so and broke down out of it. This April it moved back up and tried to push through the 130 resistance but couldn’t do it and last week dumped out of a bear flag. This chart is showing the potential to find support anywhere between 2.35 and $2.
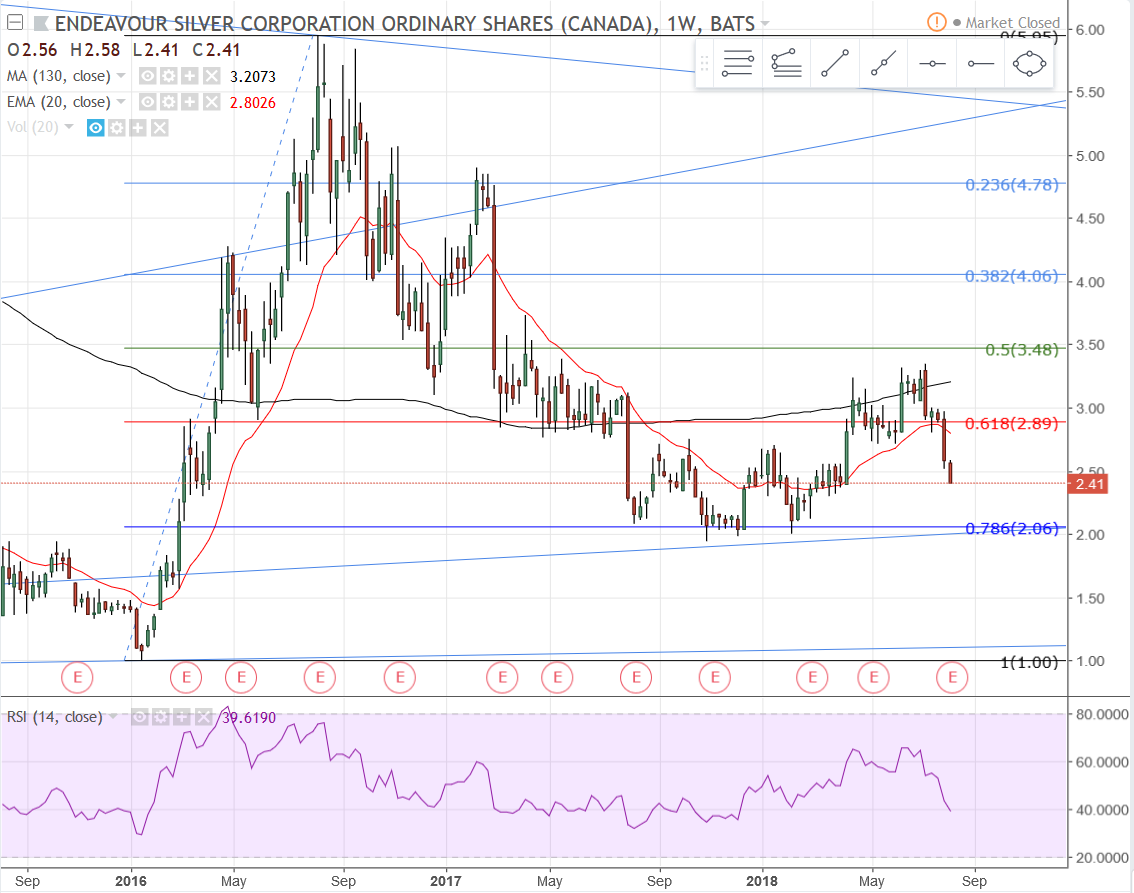
Here’s the Fibonacci retracement grid on the weekly interval. It found support at the 78% retracement level, although a test of that level can often mean a move back to previous lows. There is decent support in the low $2’s so watch for that.
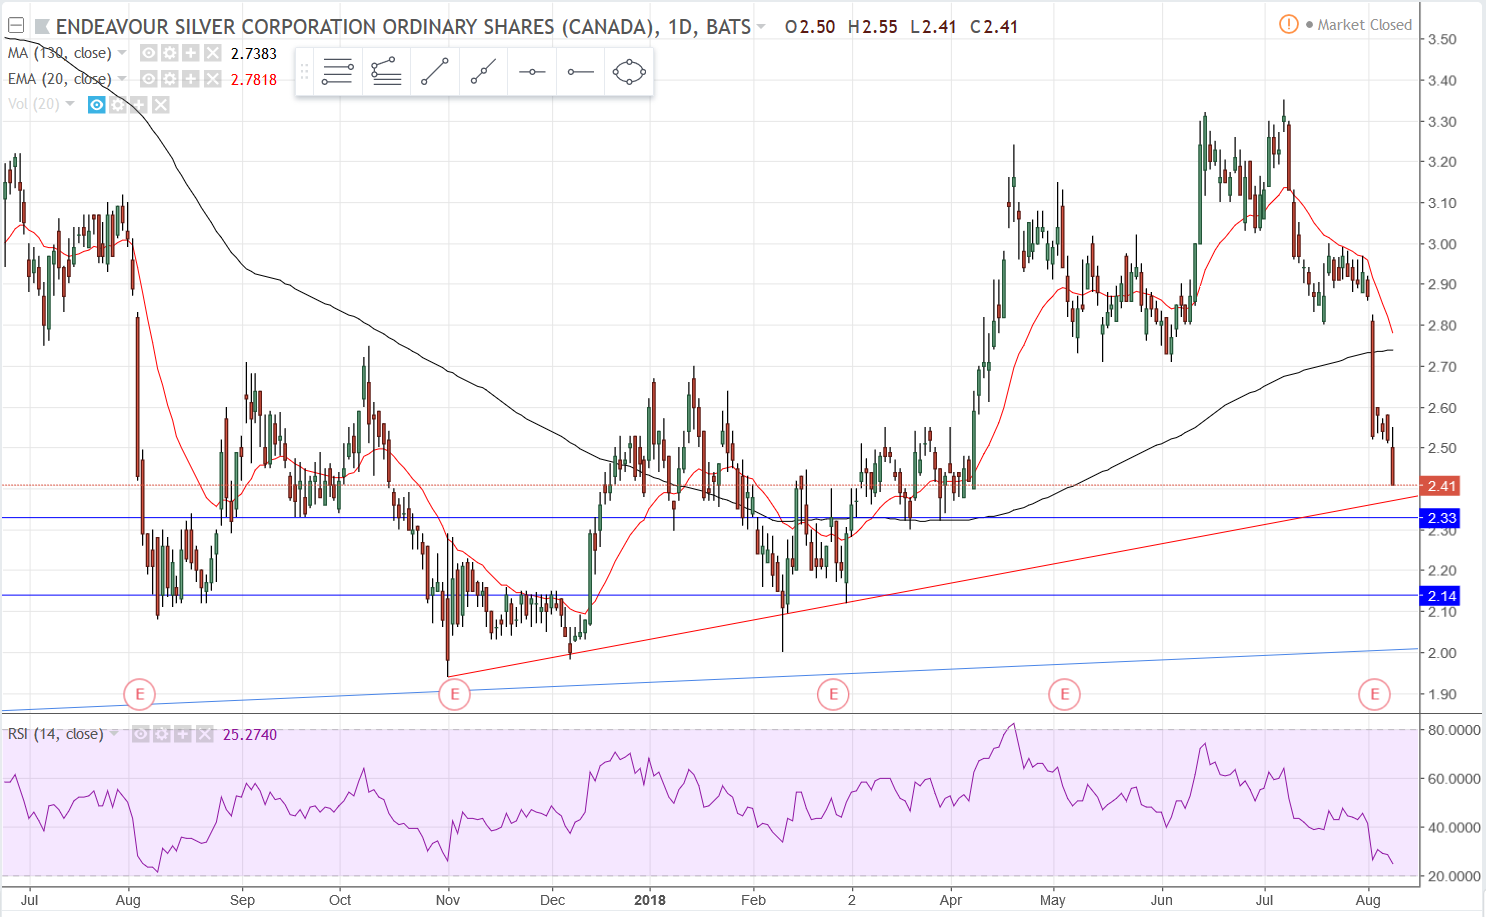
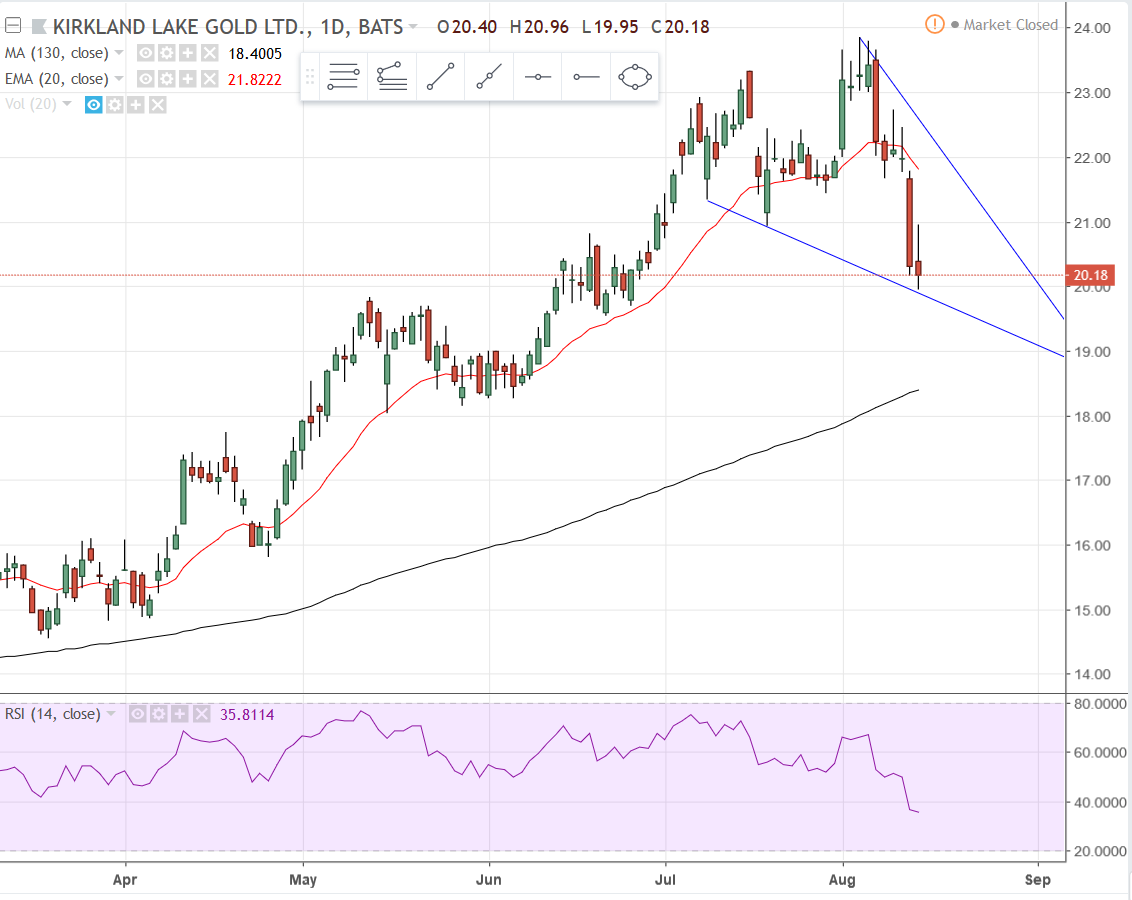
Daily Interval: I didn’t want to clutter the chart up with too many lines here, but immediate levels of resistance to watch are 2.55, the 20 EMA and 130 MA, and 2.70 which is a big one. Immediate levels of potential support are 2.38 at the red uptrend line, 2.33 and 2.14, give or take a nickle, and then $2.
Concerning the video TR’s comment is directed to in the linked post (#264), I’m just making a general comment. We see a lot of action in some stocks that just don’t seem to make sense. I just reviewed the short video in TR’s post that made me go Hmmmm. In TR’s youtube from a 2006 Jim Cramer interview, dirty tricks of hedge funds are revealed. Does this also explain why sectors get rotated “out of favor” due to the “invisible hand” of the market? Of course fundamentals matter, one needs to pay attention, but it seems speculation and markets are often manipulated to benefit a few. Maybe I’m just thinking of $GOLD. https://goldprice.org/spot-gold.html
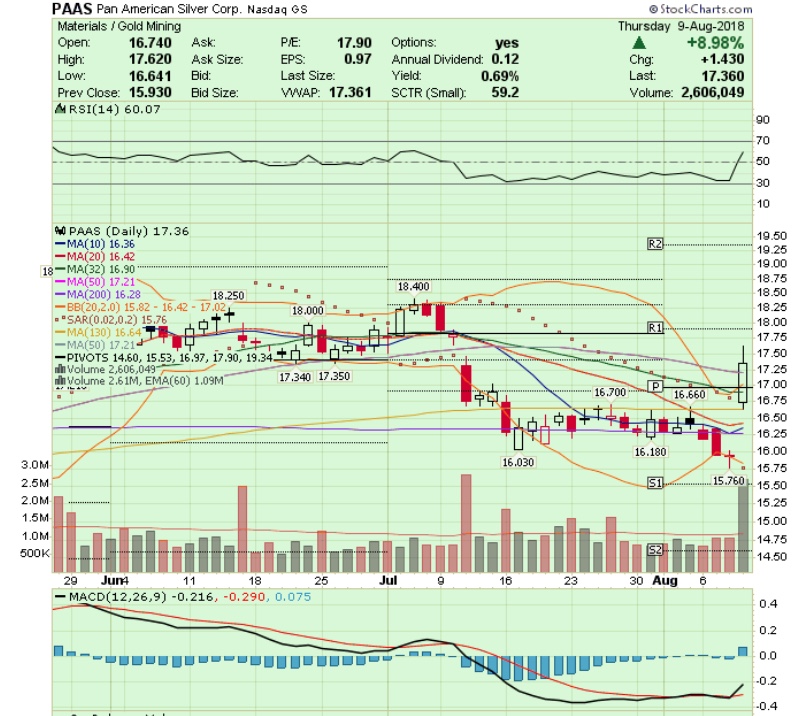
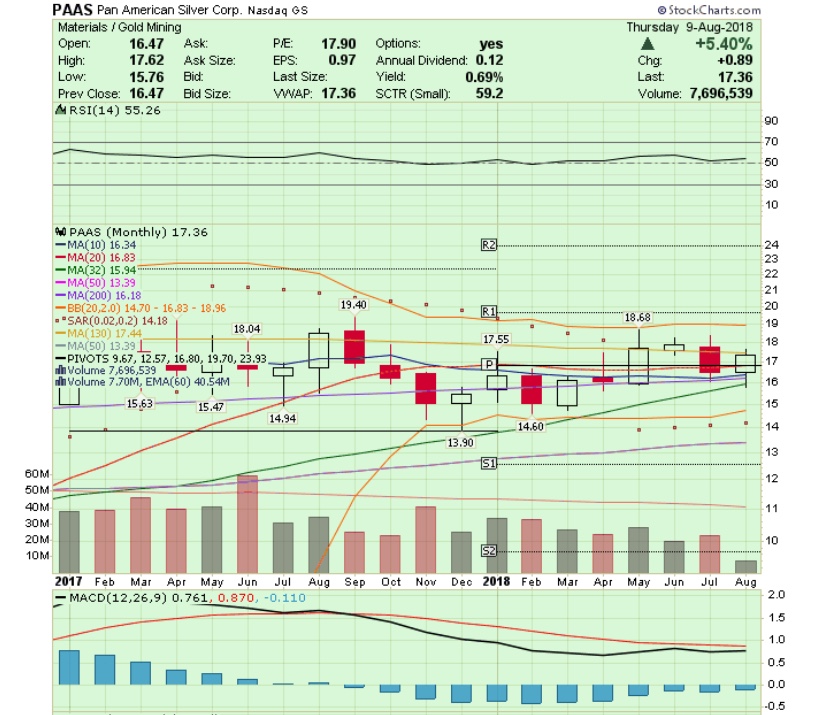
Back in March 2017 the chart on Pan American Silver Corp. (PAAS) was very uninteresting. Also, PAAS really took a dive at the end of last year. Thankfully, I have a position in this one and have added incrementally (and MUX too). Shorter interval and long interval charts are getting interesting, IMO. 1st chart is today’s daily interval chart, 2nd one is a monthly interval chart.
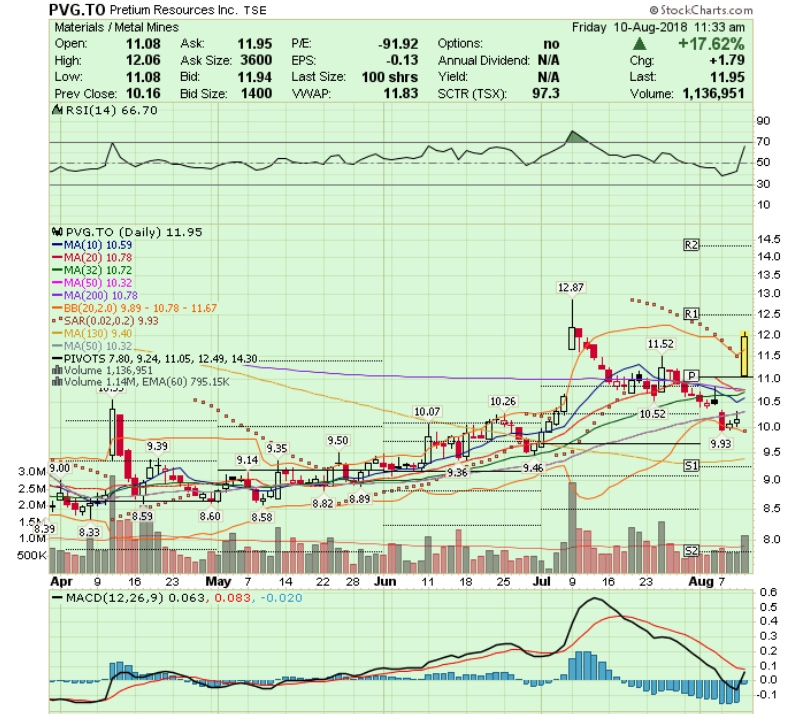
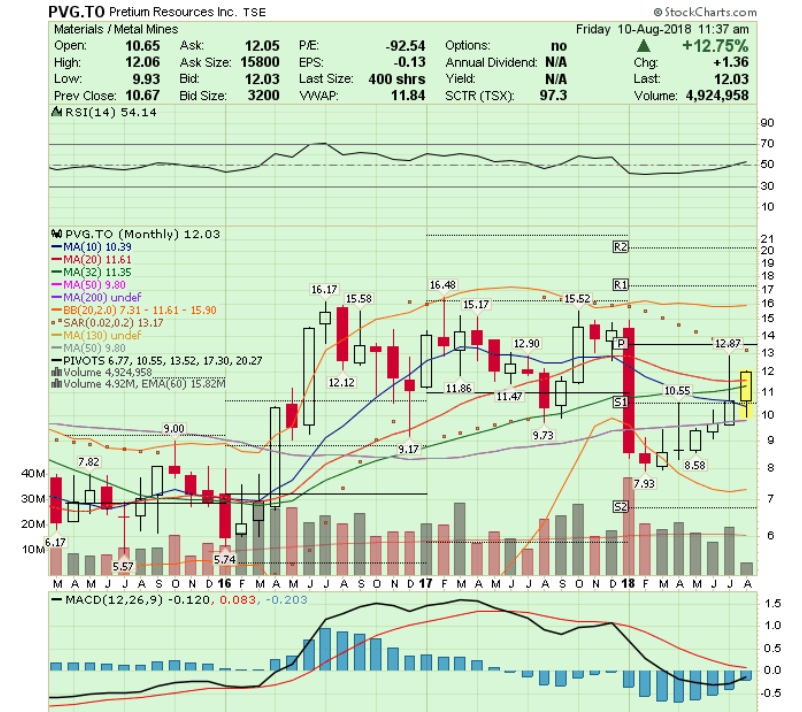
The above post was from October last year. First mentioned by Baldy back in 2015. Mining is slow and methodical. Mentioned several times on the forum by several posters. Anyone else in Pretium? This is a company doing all the right things with excellent resources and management. Up nice this morning:
PRETIVM REPORTS SECOND QUARTER 2018 RESULTS
08/09/2018
Brucejack delivers on guidance; building a strong cash position
VANCOUVER, British Columbia, Aug. 09, 2018 (GLOBE NEWSWIRE) – Pretium Resources Inc. (TSX/NYSE:PVG) (“Pretivm” or the “Company”) is pleased to report financial and operating results for the second quarter and first half of 2018.
All amounts are in US dollars unless otherwise noted. This release should be read in conjunction with the Company’s Financial Statements and Management’s Discussion and Analysis available on the Company’s website and on SEDAR.
“Our cash balance increased by more than $72 million through the quarter to $142.5 million as a result of our improved production at lower costs,” said Joseph Ovsenek, President & CEO of Pretivm. “In the first half of the year, we’ve reached steady state production, fully implemented our grade control program and met our production guidance. We intend to build on this positive momentum for the remainder of the year, firmly establishing Pretivm as a premier high-grade gold producer.”
Second Quarter 2018 Summary
Production of 111,340 ounces of gold.
Revenue of $146.5 million on 115,309 ounces of gold sold.
Total cost of sales $86.4 million or $749 per ounce of gold sold1.
AISC1 of $648 per ounce of gold sold.
Net earnings of $31.1 million ($0.17 per share).
Adjusted earnings1 of $47.0 million ($0.26 per share).
Cash and cash equivalents of $142.5 million as at June 30, 2018.
Achieved first half 2018 guidance with a total of 187,029 ounces of gold produced at an AISC of $783 per ounce of gold sold.
1Refer to the “Non-IFRS Financial Performance Measures” section at the end of this news release.
Second Quarter Production Overview
Production totaled 111,340 ounces of gold and 118,205 ounces of silver.
Mill feed grade averaged 14.9 grams per tonne gold for the quarter.
Gold recoveries averaged 97.7%.
Process plant throughput averaged 2,604 tonnes per day for total of 236,990 tonnes of ore.
Mine development averaged over 740 meters per month during the quarter to prepare additional stopes which will allow for optimization of ore grades feeding the mill.
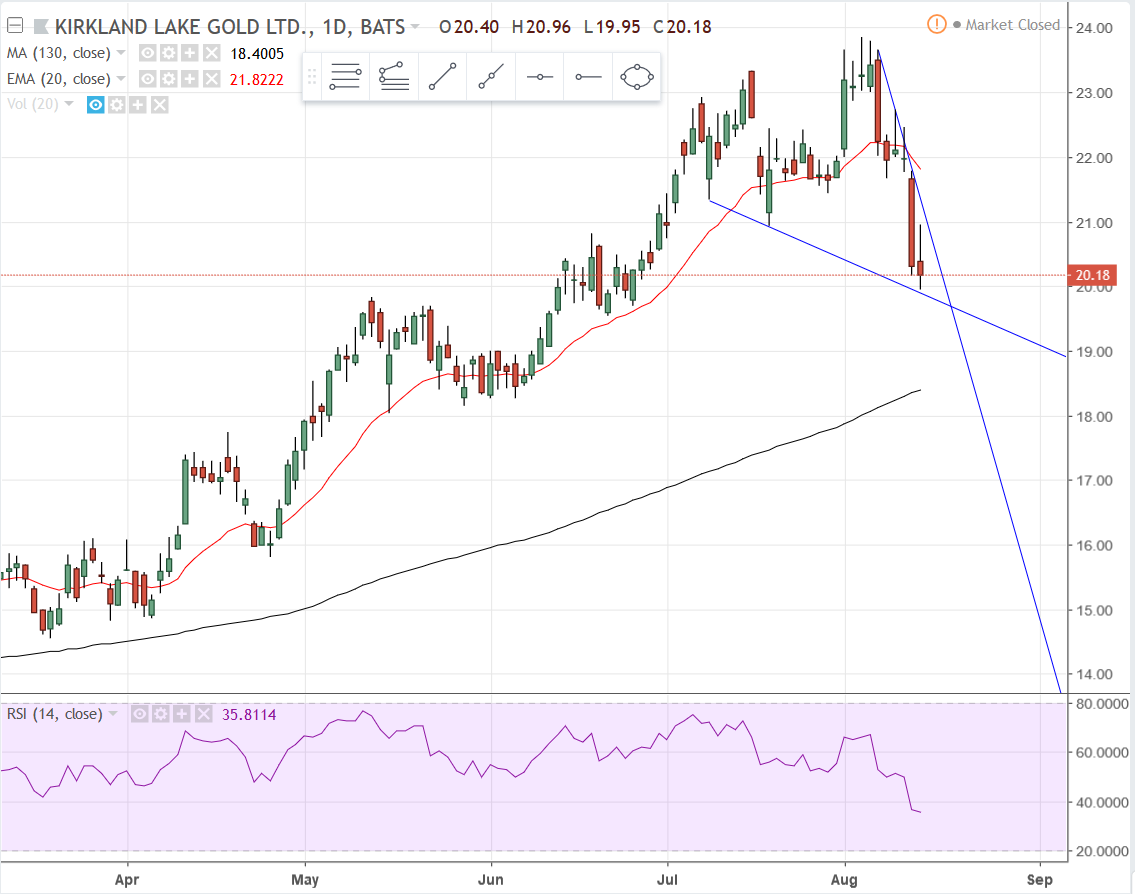
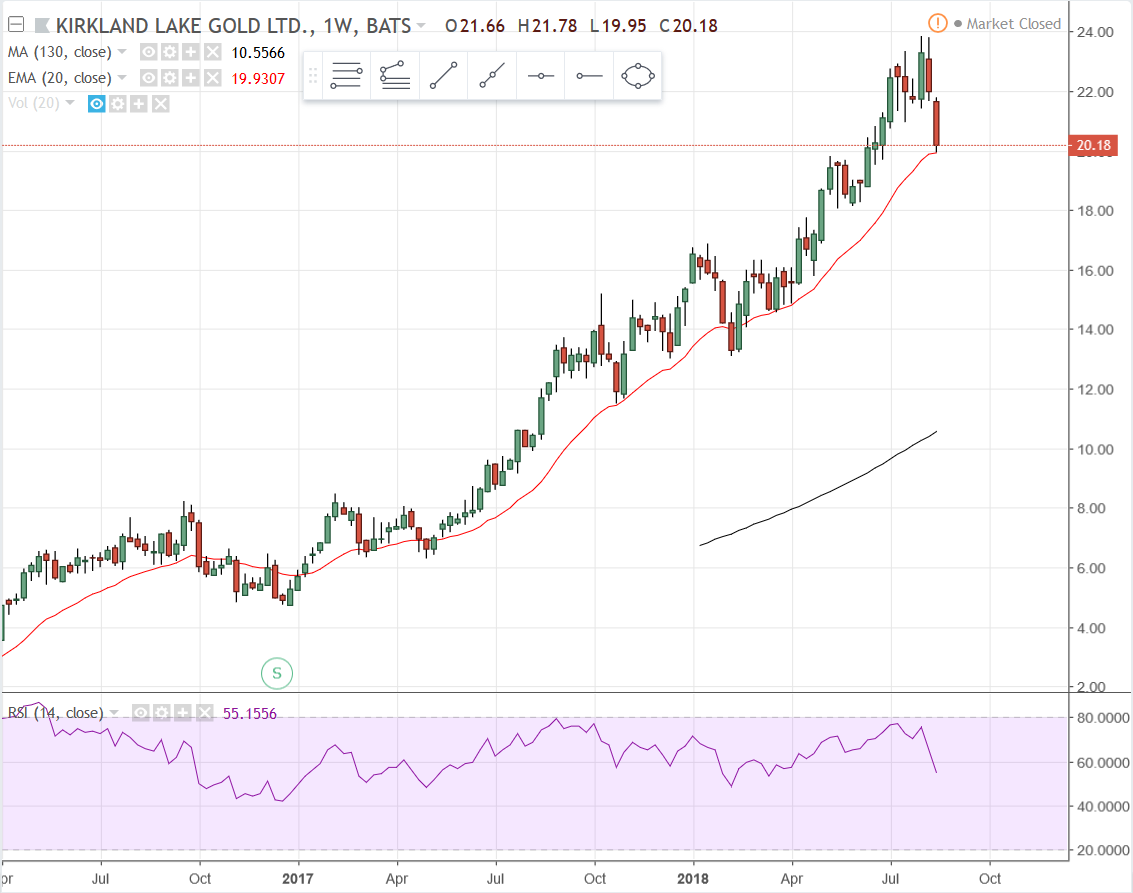
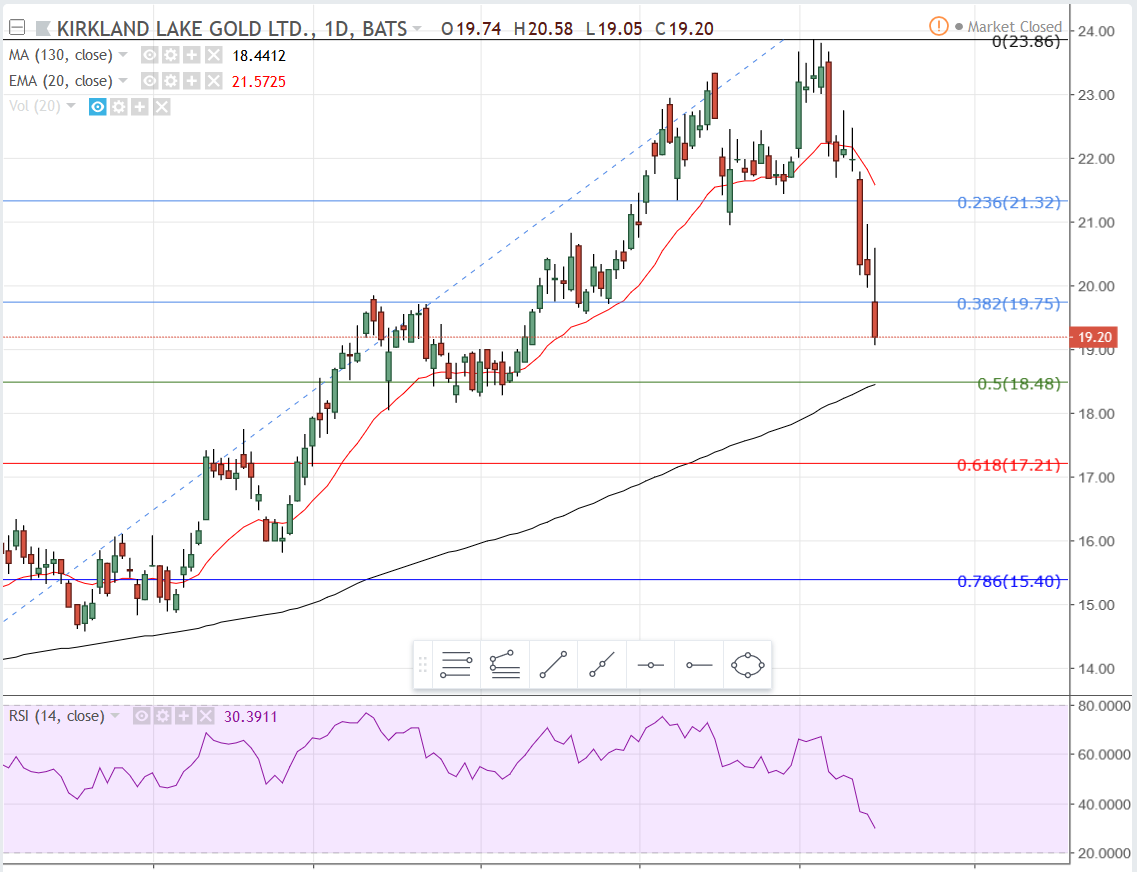
Hey Rich, when you have an opportunity, would like your opinion on MUX and KL. I think both have some more downside, and the outlook for gold doesn’t bode well either. KL has been a great stock the past 2 years and I’m not sure if the latest pullback is just a technical correction of the overall upward trend or if there is more downside.
MUX Weekly: There isn’t a lot to say here, especially anything bullish. Still in a downtrend, although it has basically been consolidating all year in a .40 - .50 range for the most part. Last week MUX closed below the 20 EMA. We won’t know if the blue uptrend line is going to hold until Friday at 4:01. We might get a clue about next week based upon the trading at the end of the day Friday. A move that closes this back above the uptrend line might foretell a move higher next week. A close below the blue uptrend line will likely mean a move down to 1.94 - 1.82 to test some old support levels.
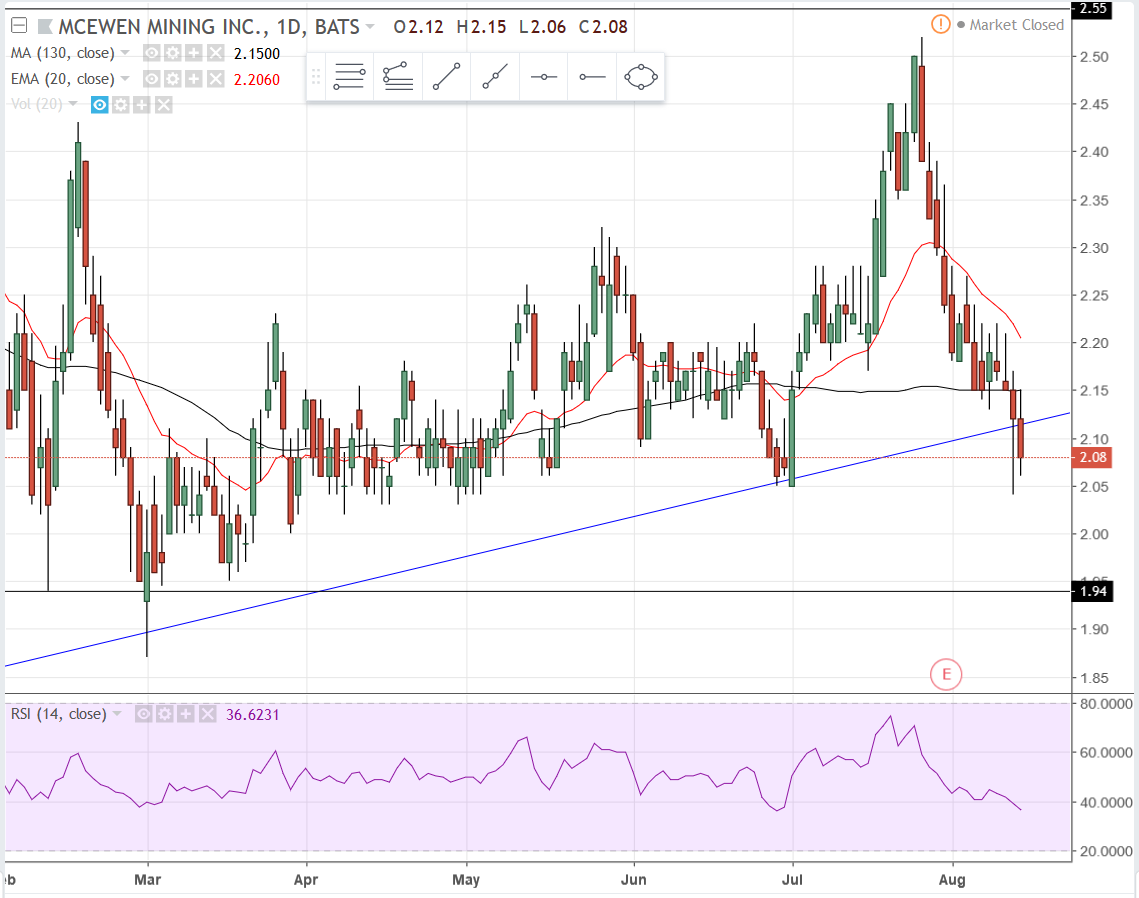
The daily chart is more closely showing the drop below the uptrend line. The RSI is moving toward oversold territory, but there’s ample room to go lower. Have to wait for Friday close to get a sense of direction for next week.
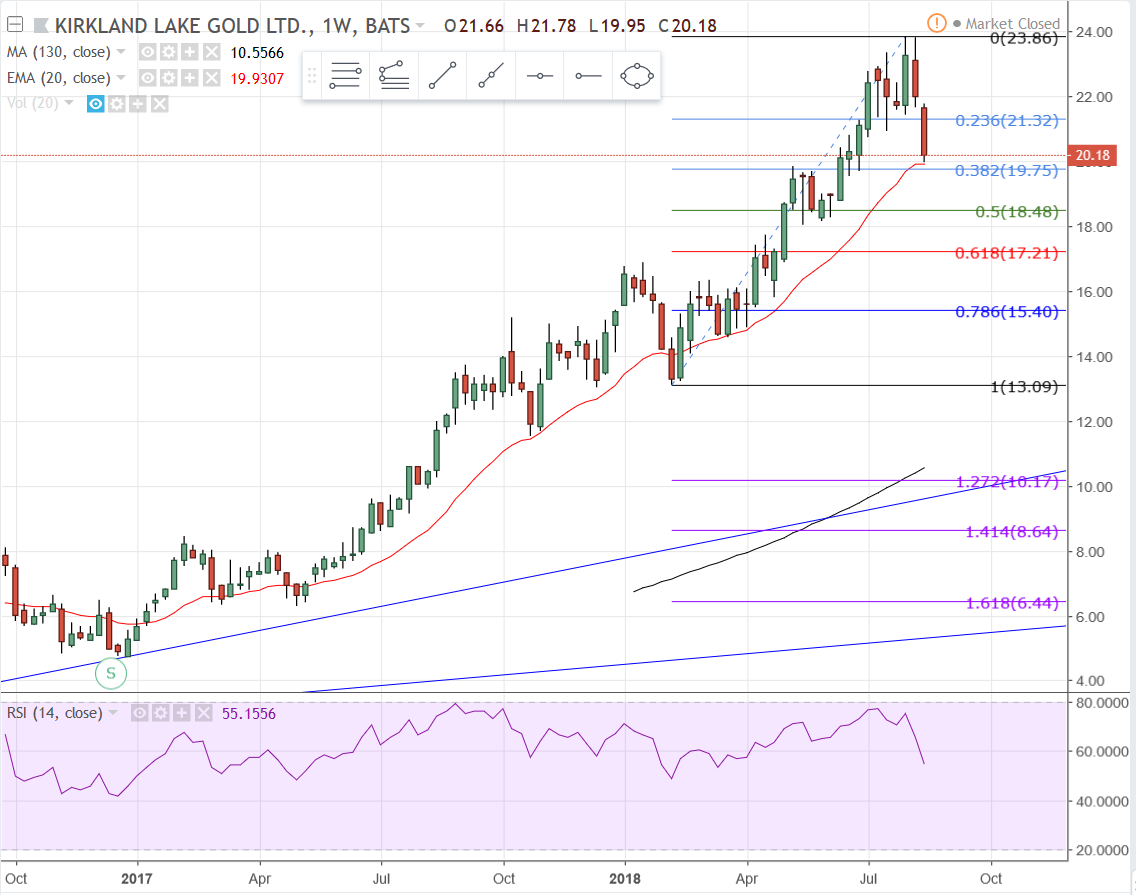
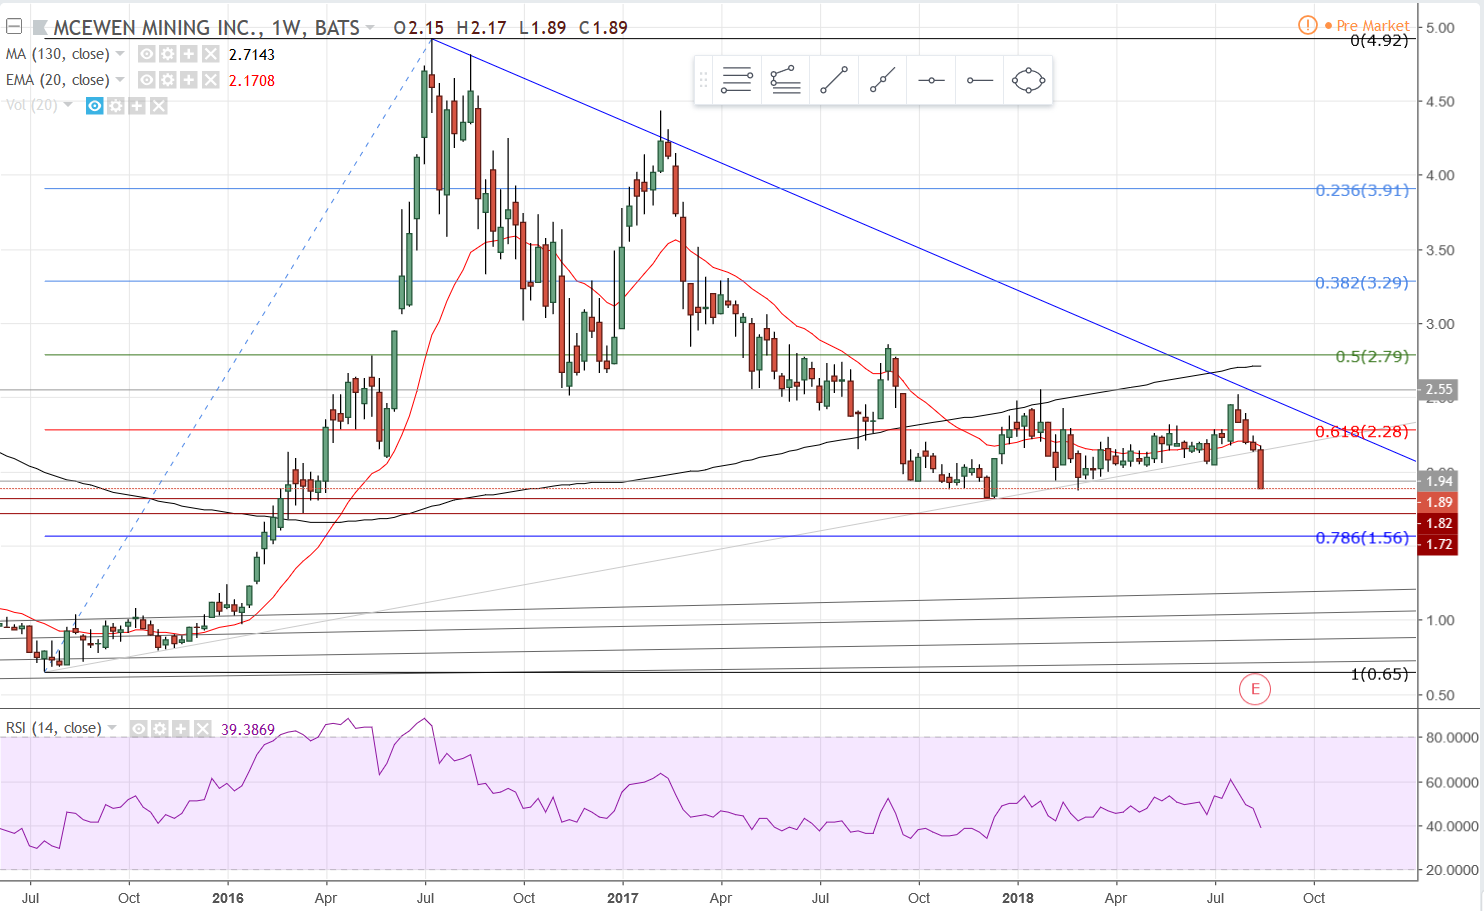
Here’s the weekly interval again with a Fibonacci retracement grid covering the recent high through the previous major support low. In the event that the wedge idea is false, watch for support at/between the 50% point and the 78.6% area.
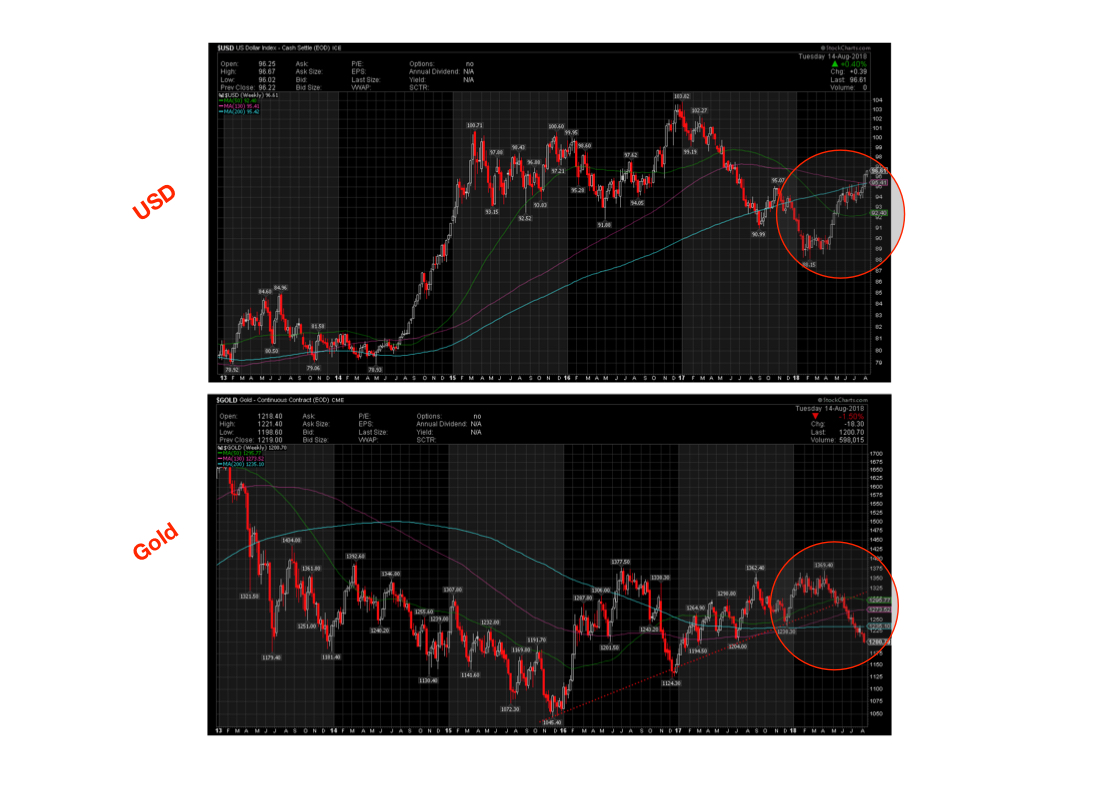
The USD index is now approaching $97. Next stop appears to be $98 - $100 somewhere. This is crushing gold and silver and the miners and to a lesser degree all of the commodities and to a greater degree currencies of all kinds.
FAANG stocks have been a safe haven (money parking lot) for a while. But we seem to be transitioning more and more to where the USD itself (cash) is becoming the new wait-this-craziness out parking lot.
Trouble is coming for emerging markets and others if the USD keeps going up. To some degree it’s a feedback loop. The rising USD causes more disruption in other markets so money in other markets buys USD as a safe haven and drives up the price more. Eventually something give because as the dollar rises it becomes harder and harder for anyone whose base currency is not dollars to pay back all their debt denominated in dollars and there is a lot. There’s a big psychological barrier at 100 and about a 15 year pre-GFC high above 103.
Gold under $1200, silver under $15 this morning. More pain for the miners on the way.
TR - I think a technical USD chart once a week would be great. Unless somehow all the macro geo-political chaos dies down, I think it will be The Thing to watch the rest of 2018 into 2019.
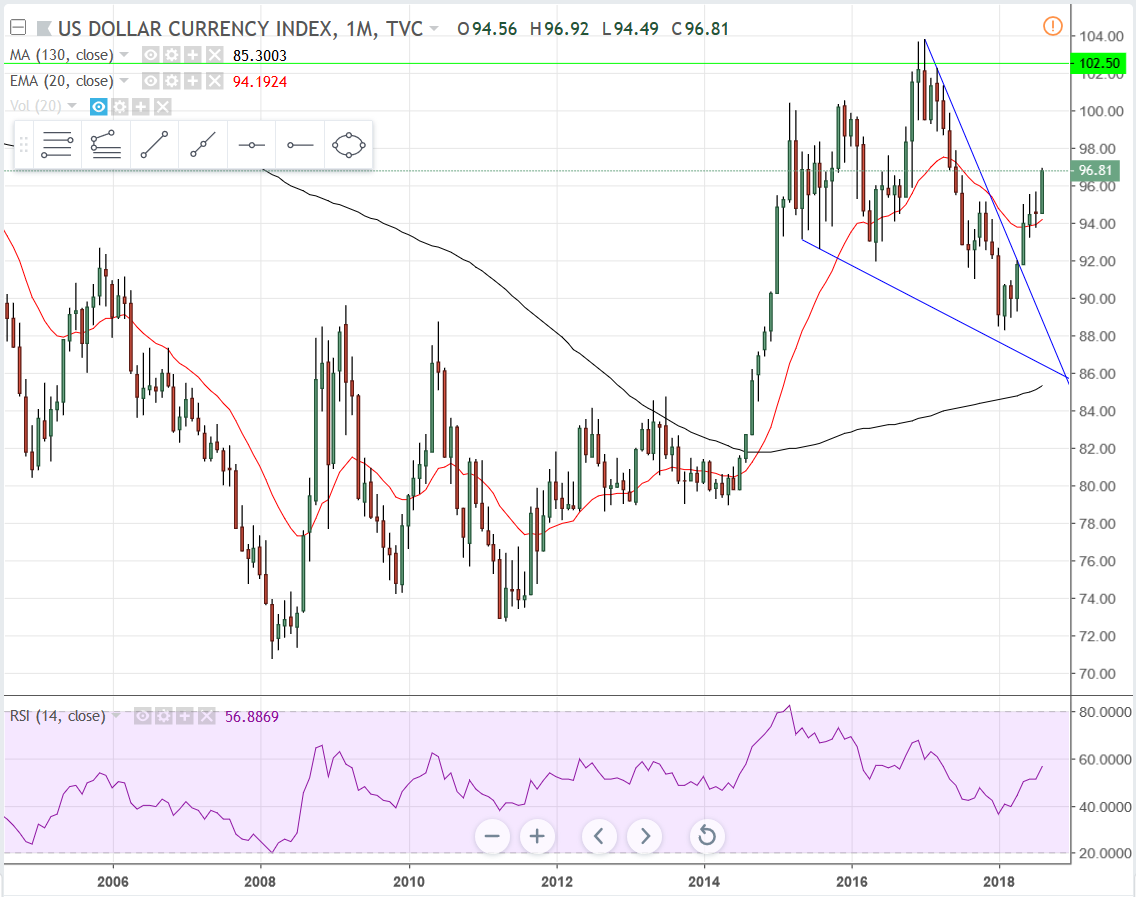
Here’s a monthly interval of the dollar currency index. Looks like the dollar is moving out of a bullish wedge with the target basically back to previous highs (almost). I’ll post the shorter time frame stuff later on if I find anything interesting to show.
Yeah, the chart looks like crap but it’s short term way oversold and even hitting on oversold long term. I don’t mind holding this one if it drops more.
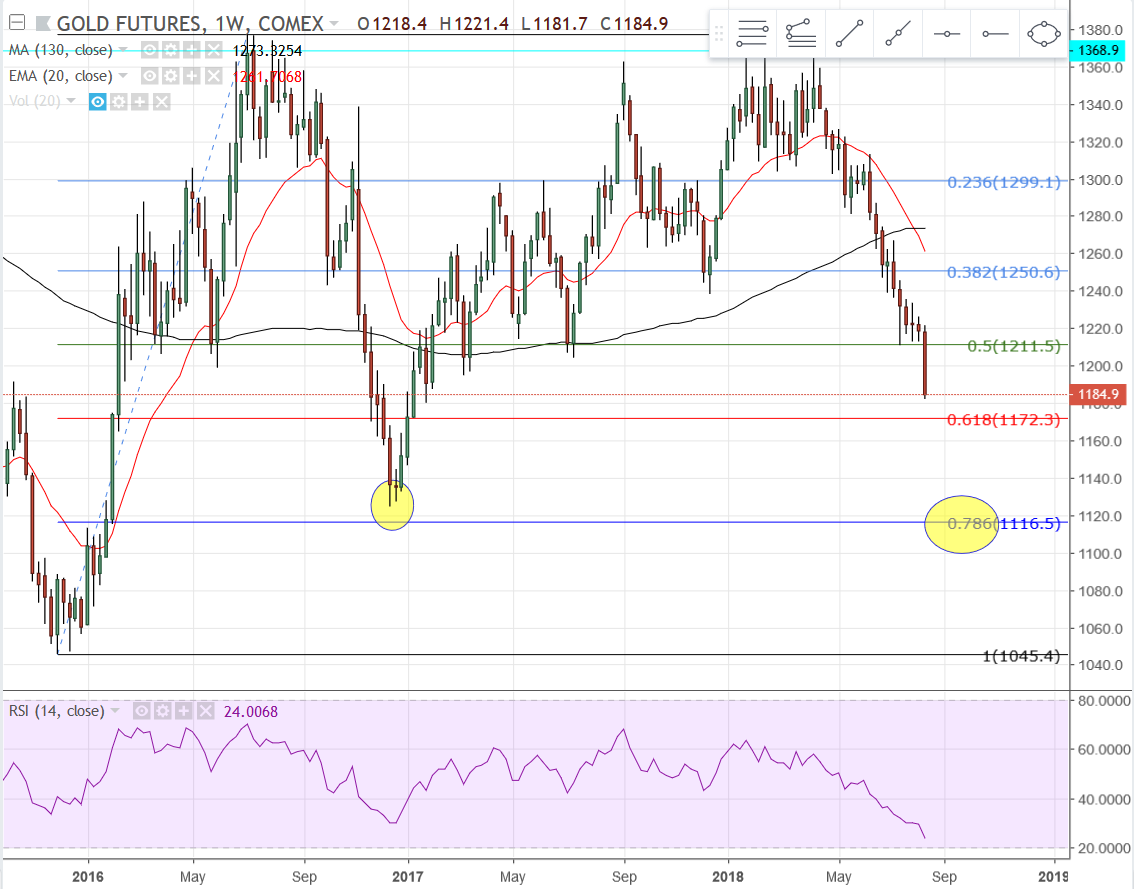
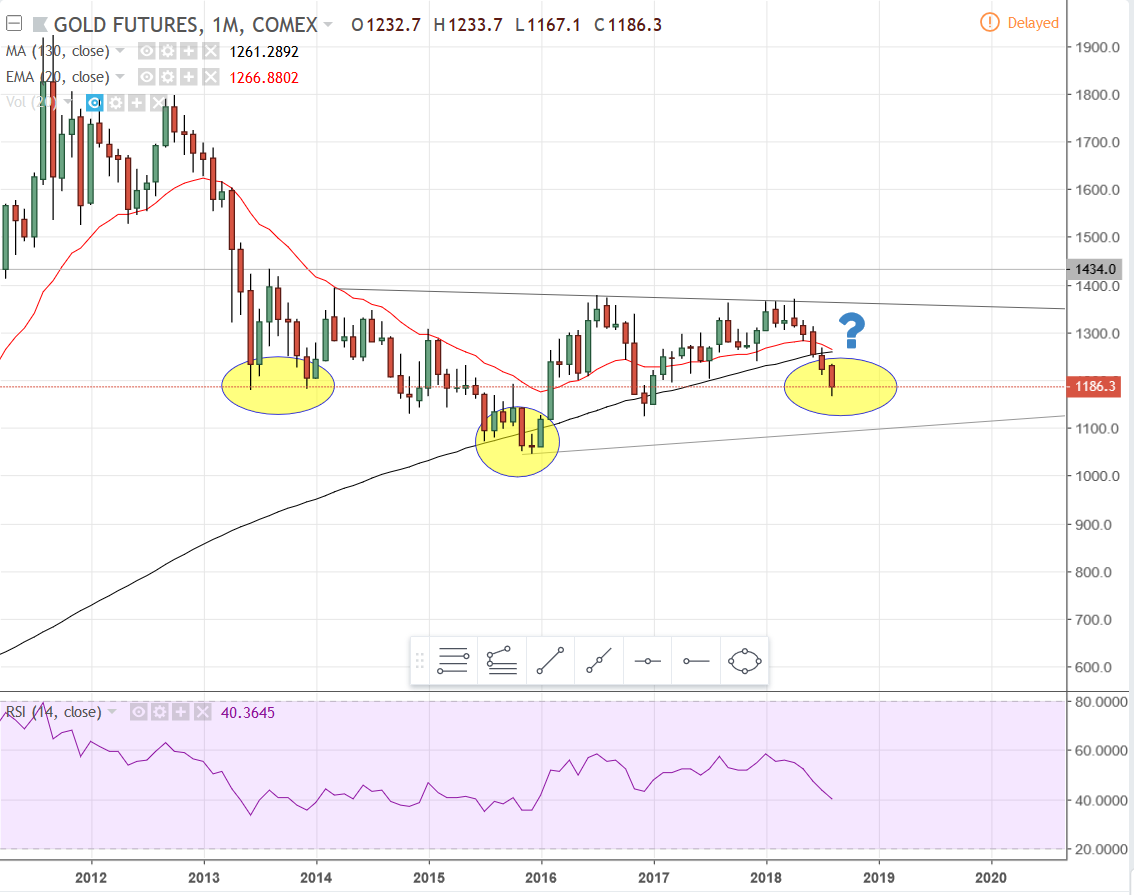
The last time gold dropped it did so from practically the same high that the current drop started from. On the previous drop it almost tagged the 78.6% retracement before bouncing.
Gold: Weekly Interval - Went through the .786 Fib retracement yesterday and has bounced overnight. Nothing more to say about this chart until the weekend.
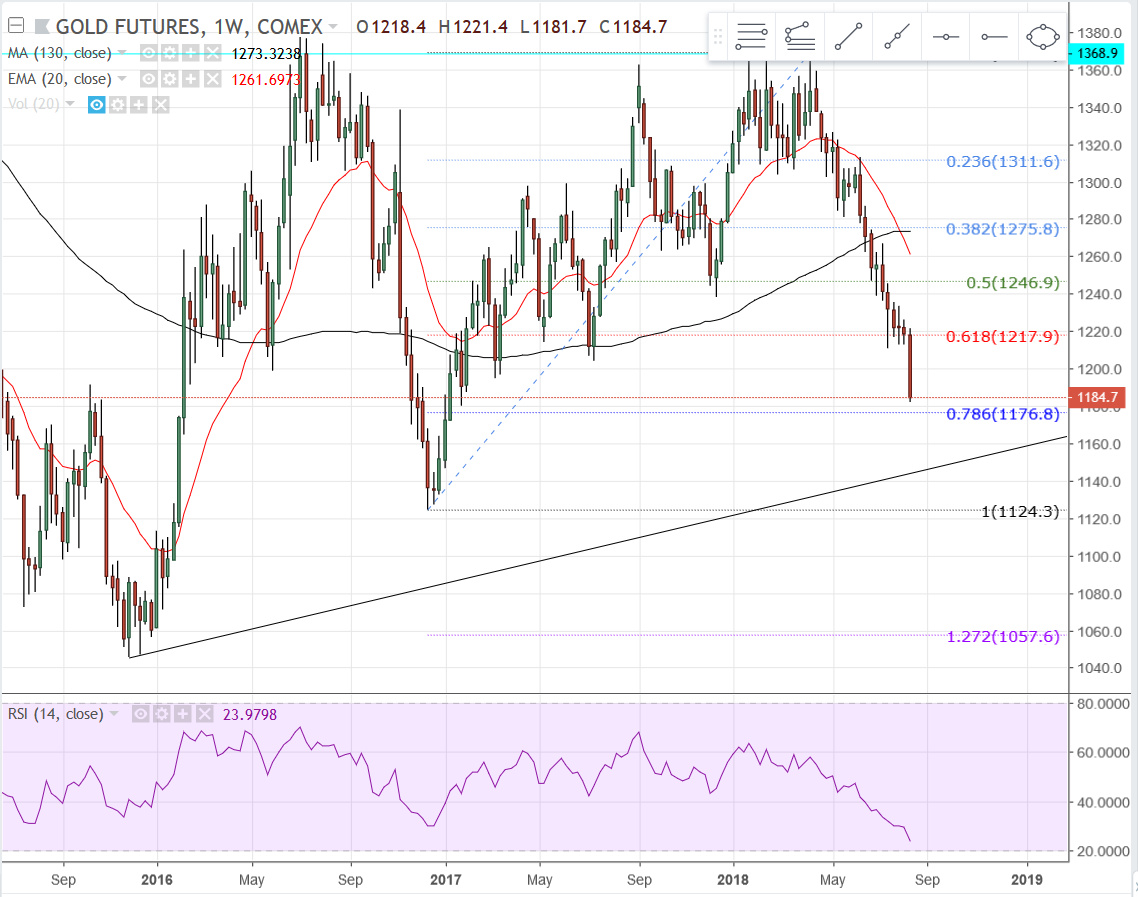
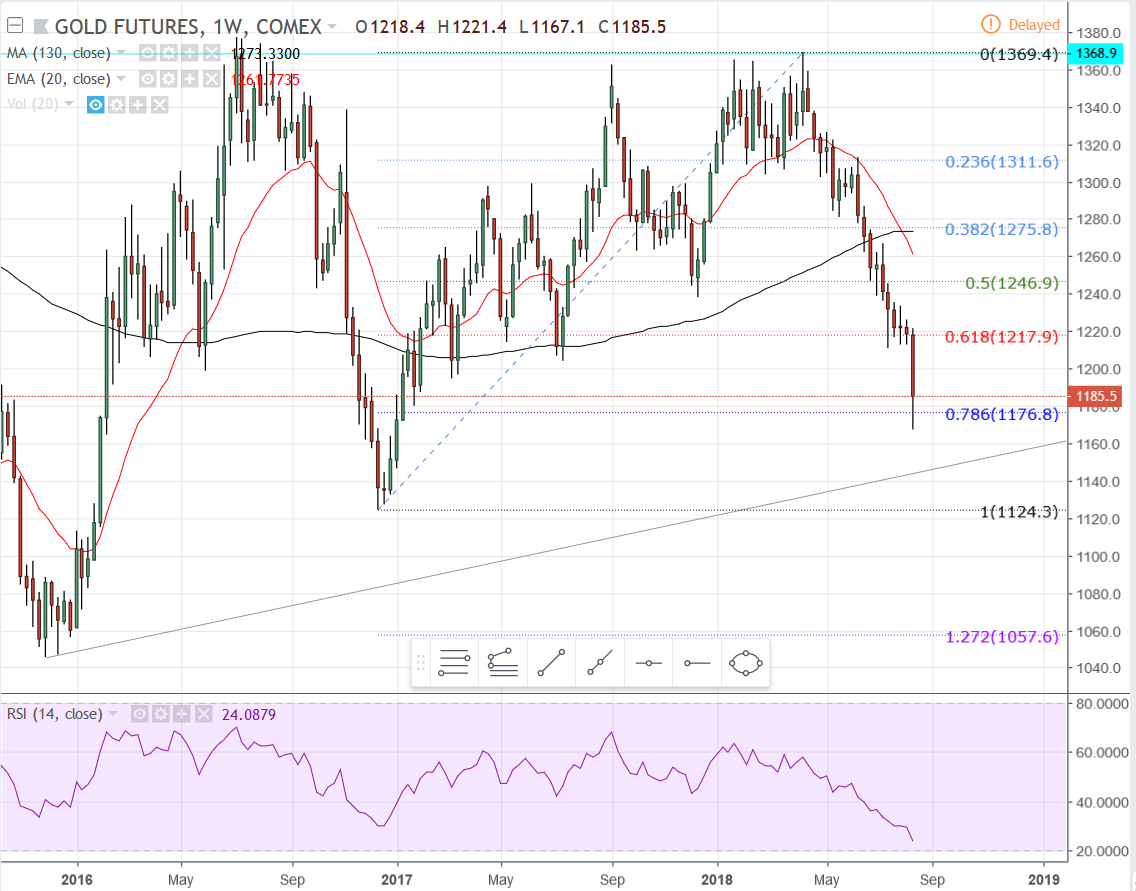
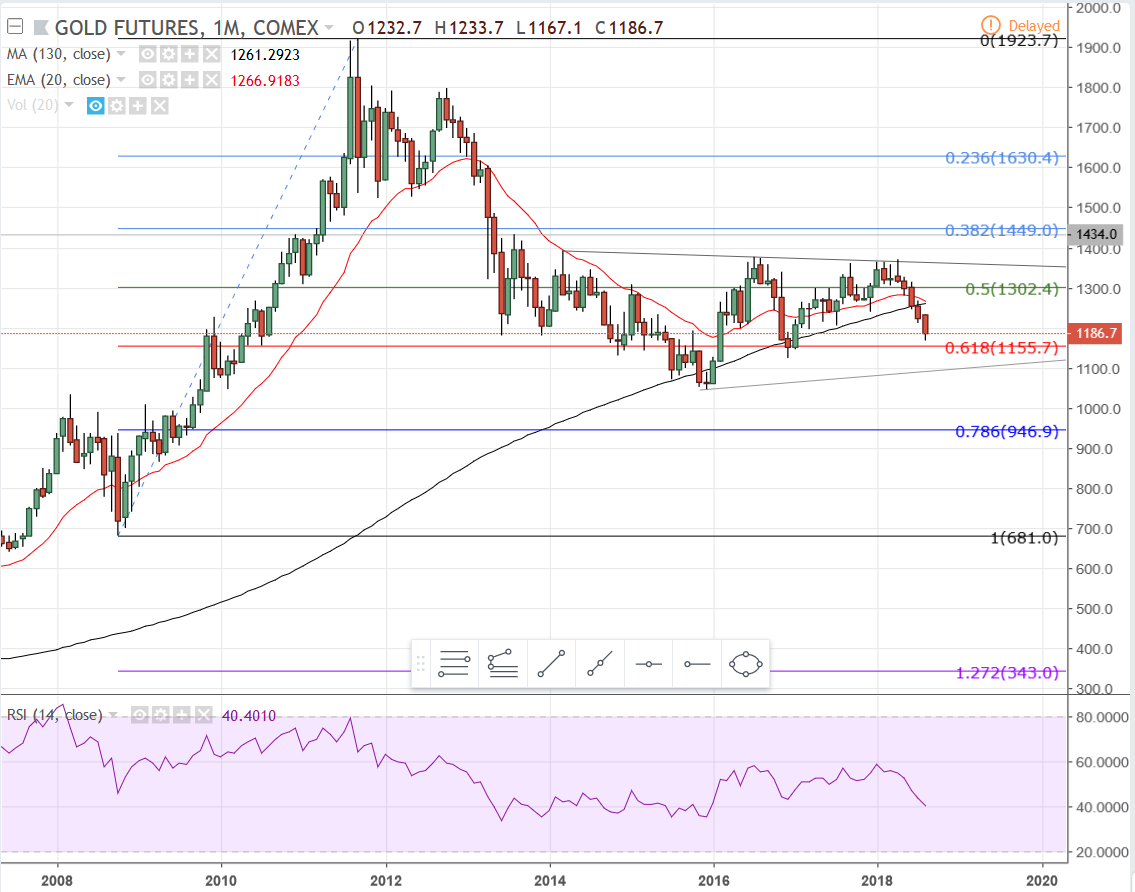
Monthly Interval: This chart shows that gold has established the 1350 - 1400 price range as major resistance. On the other hand, gold has fallen into fairly significant price support between 1200 - 1150. Note the Fibonacci lines here, specifically the 62% retracement level.
You may also have noticed something else on the monthly chart. It’s too soon to tell yet since the right shoulder needs to finish forming, if it is in fact a right shoulder. It could take the rest of this year and the first half of next year before we know the answer to that, but, in this case, the longer it takes to find out the better the chances this is what it is looking like. In the event this turns out to be what we’d all like it to be, we’re looking at a measured move of approximately $300 from a breakout around $1350 which would put us at approximately $1650 for starters.
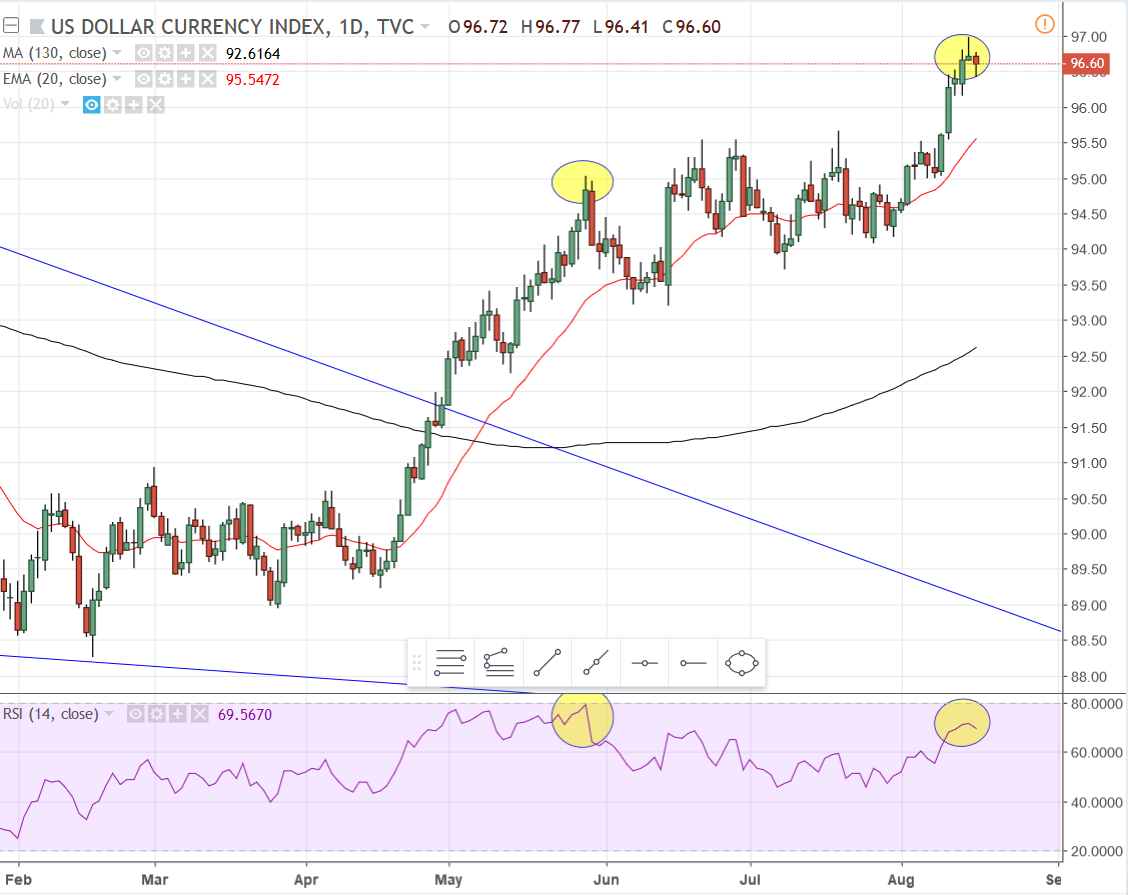
Dollar Daily Interval: The dollar could still push higher from here, but if not then the RSI is showing divergence, an early sign for a potential reversal. Something to keep an eye on. It could be in the process of making a bull flag, but it would have to be a strong push higher to nullify this divergence.
MUX Weekly: So yesterday’s candle does not look good on the chart, but I watched the closing minutes. There was a lot of buying and from my POV we closed at 1.94, regardless of the 1.89 close the candle shows. Regardless, in the event we go lower there isn’t much in the way of support. We’ve got between 1.82 and 1.72 and then the 79% retracement at 1.56. If none of those hold then there really isn’t anything other than those grey lines you see on the bottom of the chart.
(Novo Resources Corp. - see TR’s Charts Post #821)
Novo-Artemis JV Confirms Continuity of Upper Gold-Bearing Conglomerate From Comet Well to Purdy’s Reward
BY GlobeNewswire
— 8:26 AM ET 08/16/2018
VANCOUVER, British Columbia, Aug. 16, 2018 (GLOBE NEWSWIRE) – Novo Resources Corp. (NSRPF) (“Novo” or the “Company”) is pleased to announce that recent surface mapping and trenching indicates the upper gold-bearing conglomerate at Comet Well (80% Novo; 10% Gardner Mining; 10% Smith) appears continuous with the basal gold-bearing conglomerate at Purdy’s Reward (50% Novo; 50% Artemis joint venture on conglomerate and paleoplacer gold hereafter referred to as the “Novo-Artemis JV”), a current explored strike of approximately 3.4 km. These gold-bearing conglomerates remain open along strike to the northeast and southwest and down dip to the southeast into the Fortescue Basin. At Purdy’s Reward, exploration has recently re-commenced where infill drilling and bulk sampling is being undertaken to further evaluate the gold deposit.
Soon after identifying two distinct gold nugget-bearing conglomerate units at Comet Well, Novo noted that nuggets from the upper unit displayed similar large size and flattened shape to those observed in the basal gold-bearing conglomerate uncovered at Purdy’s Reward in late 2017 by the Novo-Artemis JV. Novo and the Novo-Artemis JV have recently conducted mapping and trenching in intermediate areas indicating these conglomerates are one-in-the-same (see Figure 1 below).
Novo and the Novo-Artemis JV are encouraged by the apparent continuity of these gold-bearing conglomerates over an explored strike length of 3.4 km. They are generally shallow and accessible for bulk sampling. Several new trenches opened up in the intermediate area between Comet Well and Purdy’s Reward reveal numerous detector strikes (see Videos 1, 2 and 3 at YouTube, YouTube, and YouTube). Bulk samples (5-10 tonnes) are currently being collected from newly opened areas and will be prioritized in the processing queue.
The upper gold-bearing conglomerate at Comet Well is associated with a distinct mafic volcanic tuff marker bed that helps enable its identification in the field. As the upper gold-bearing conglomerate and associated tuff project northeastward toward Purdy’s Reward, a series of north-northeast trending faults is encountered beyond which the mafic tuff is no longer present. Gold-bearing conglomerates persist, however, stepping down through the stratigraphic section to a position directly on basement. Small fragments of what appear to be mafic tuff occur within the basal gold-bearing conglomerate at Purdy’s Reward (see Figure 2 below).
Novo and the Novo-Artemis JV believe these north-northeast faults must have been active during deposition of the conglomerate beds. Purdy’s Reward was the upthrown block, hence gold-bearing conglomerate was deposited straight onto basement whereas Comet Well was the downthrown block and nuggets were deposited onto older conglomerate beds.
Because these gold-bearing conglomerates display good lateral continuity and are generally shallow, Novo and the Novo-Artemis JV are growing more confident that they will be the main focus of future large-scale bulk sample extraction.
Re-commencement of exploration at Purdy’s Reward
The Novo-Artemis JV recently commenced infill diamond drilling at Purdy’s Reward. These drill holes are utilized to gather information about the depth and thickness of targeted conglomerate units. Given the extremely nuggety nature of the deposit, gold grades are being assessed by bulk sampling. Bulk samples using Novo’s new 5-10 tonne sampling protocol will soon be collected from trenches in areas near where the Novo-Artemis JV collected 300 kg gold-bearing bulk samples in 2017.
Novo’s and the Novo-Artemis JV’s exploration strategy is to generate sufficient geologic and grade data for the gold-bearing conglomerates at Comet Well and Purdy’s Reward to produce a mineralization report, a critical item needed to convert the current exploration licenses to mining leases. The Novo-Artemis JV’s aim is to ultimately move the project toward large-scale bulk sample extraction and testing as a critical means of determining its potential viability with sufficient data available for a mineralization report by the end of 2018. For more details on the Novo-Artemis JV, please refer to the Company’s news release dated August 15, 2017.
Dr. Quinton Hennigh, the Company’s, President and Chairman and a Qualified Person as defined by National Instrument 43-101, has approved the technical contents of this news release.
About Novo Resources Corp. (NSRPF)
Novo’s focus is to explore and develop gold projects in the Pilbara region of Western Australia, and Novo has built up a significant land package covering approximately 12,000 sq km with varying ownership interests. For more information, please contact Leo Karabelas at (416) 543-3120 or e-mail leo@novoresources.com
On Behalf of the Board of Directors,
Novo Resources Corp. (NSRPF)
“Quinton Hennigh”
Quinton Hennigh
President and Chairman
Neither TSX Venture Exchange nor its Regulation Services Provider (as that term is defined in the policies of the TSX Venture Exchange) accepts responsibility for the adequacy or accuracy of this news release.