AUMC? ![]()
1 Like
Thought it was interesting that these guys(GBR) are next to Pure Gold(which is one of the stocks Rob follows). Hmmm maybe some MA in the future??
I found this video clip interesting with Eric Coffin and the CEO. Eric’s been following this play for awhile
http://www.stockhouse.com/opinion/interviews/2018/08/23/ceo-interview-great-bear-resources-on-high-grade-gold-discovery
Nice find Elrac! … for those that follow Rob McEwen and MUX:
Great Bear Resources Announces $10 Million Private Placement, Investment from Rob McEwen and McEwen Mining
August 24, 2018/0 Comments/in News /by Knox Henderson
Vancouver, British Columbia, August 24, 2018 – Great Bear Resources Ltd. (“Great Bear” or the “Company”) (TSXV: GBR) is pleased to announce it will be conducting a private placement financing of units (“Units”), priced at $1.45 per Unit, for gross proceeds of up to $10 million (the “Financing”). Each Unit will consist of one common share and one-half of one common share purchase warrant (a “Warrant”). Each whole Warrant will be exercisable into a common share of Great Bear at a price of $1.75 for a period of two years.
The Company is pleased to announce that Rob McEwen has agreed to purchase $4.8 million of the Financing and that McEwen Mining Inc. has agreed to purchase $1.2 million of the Financing for a total of $6 million. On completion of the Financing, Rob McEwen and McEwen Mining will collectively own 18.8% of Great Bear Resources on a partially diluted basis…
http://greatbearresources.ca/great-bear-resources-announces-10-million-private-placement-investment-from-rob-mcewan-and-mcewen-mining/
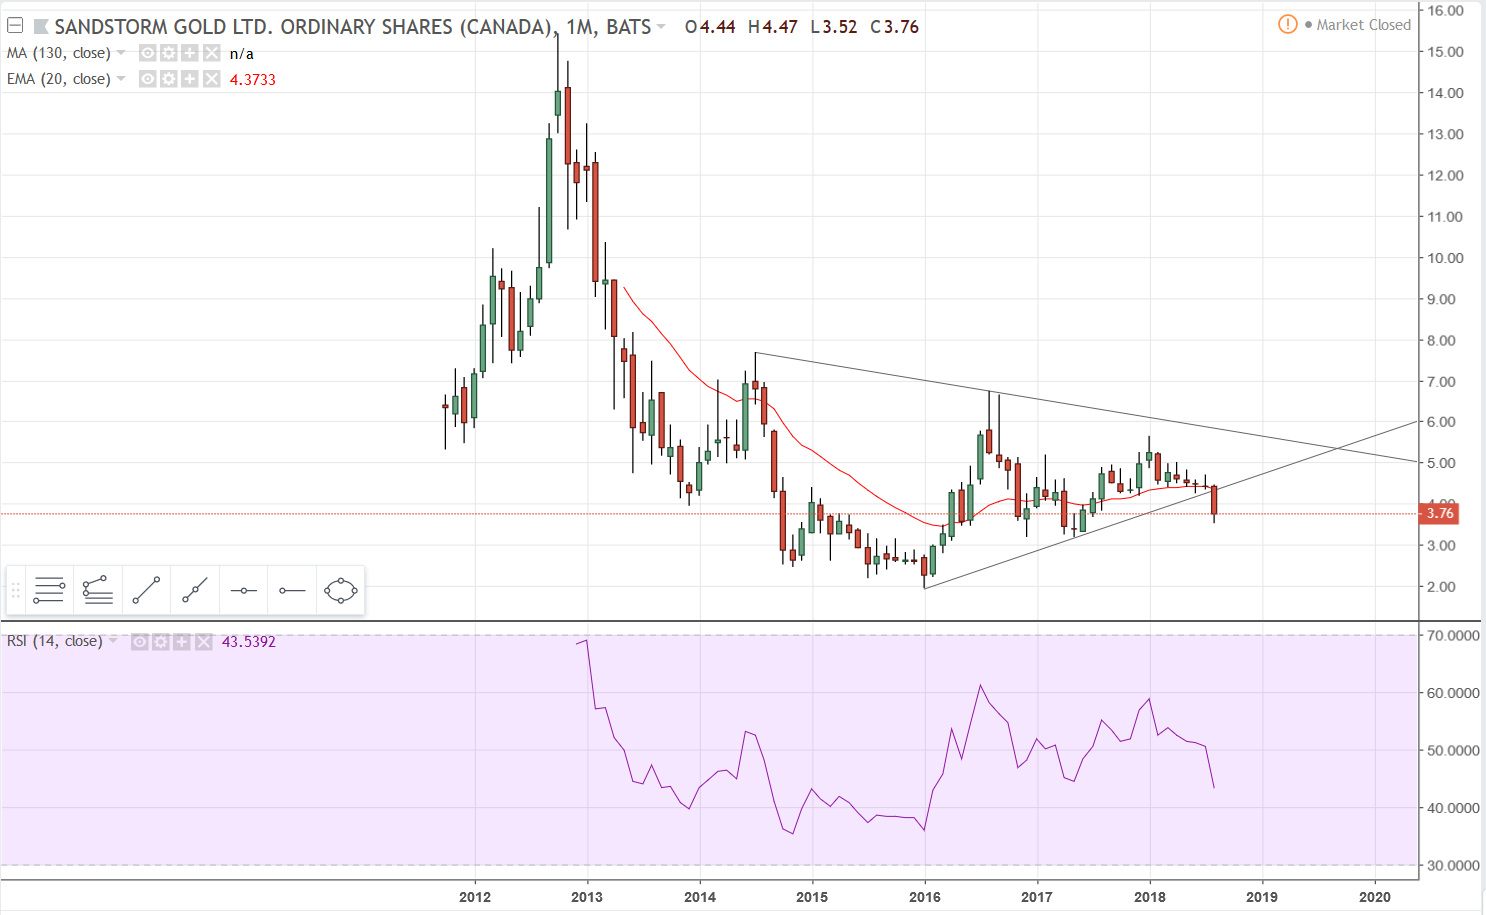
SAND
I’m posting the monthly interval just for the big picture view and to show what could have been trend line support didn’t work out that way. On to the weekly to see where support may lie.
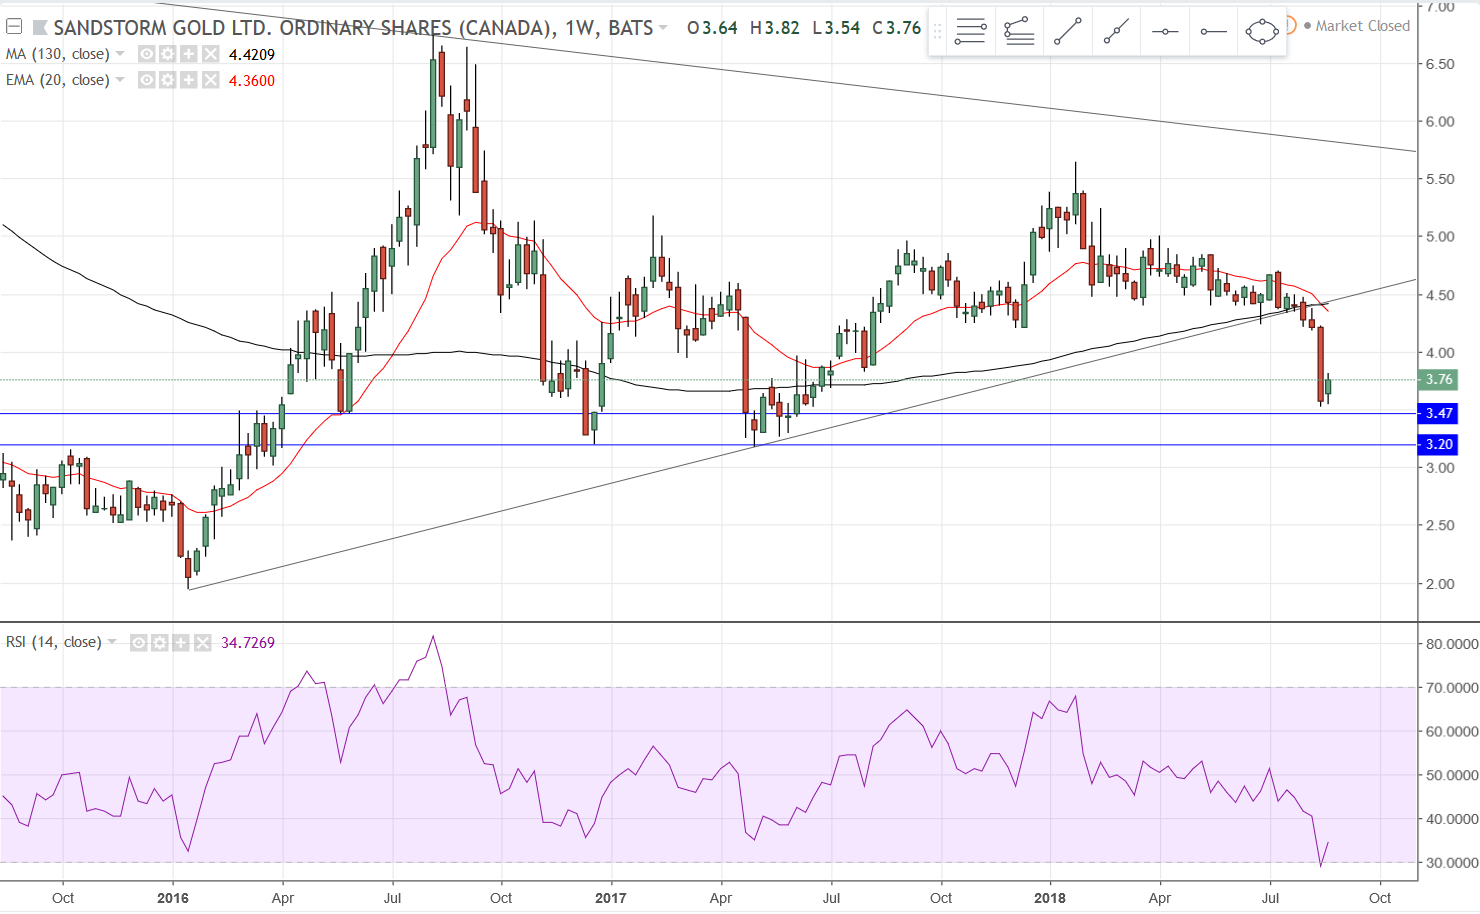
The weekly interval is showing a range of support from 3.47 to 3.19. The RSI is oversold so there could be some consolidation or bounce, but keep an eye out for a bear flag forming, which is more easily seen on the daily chart.
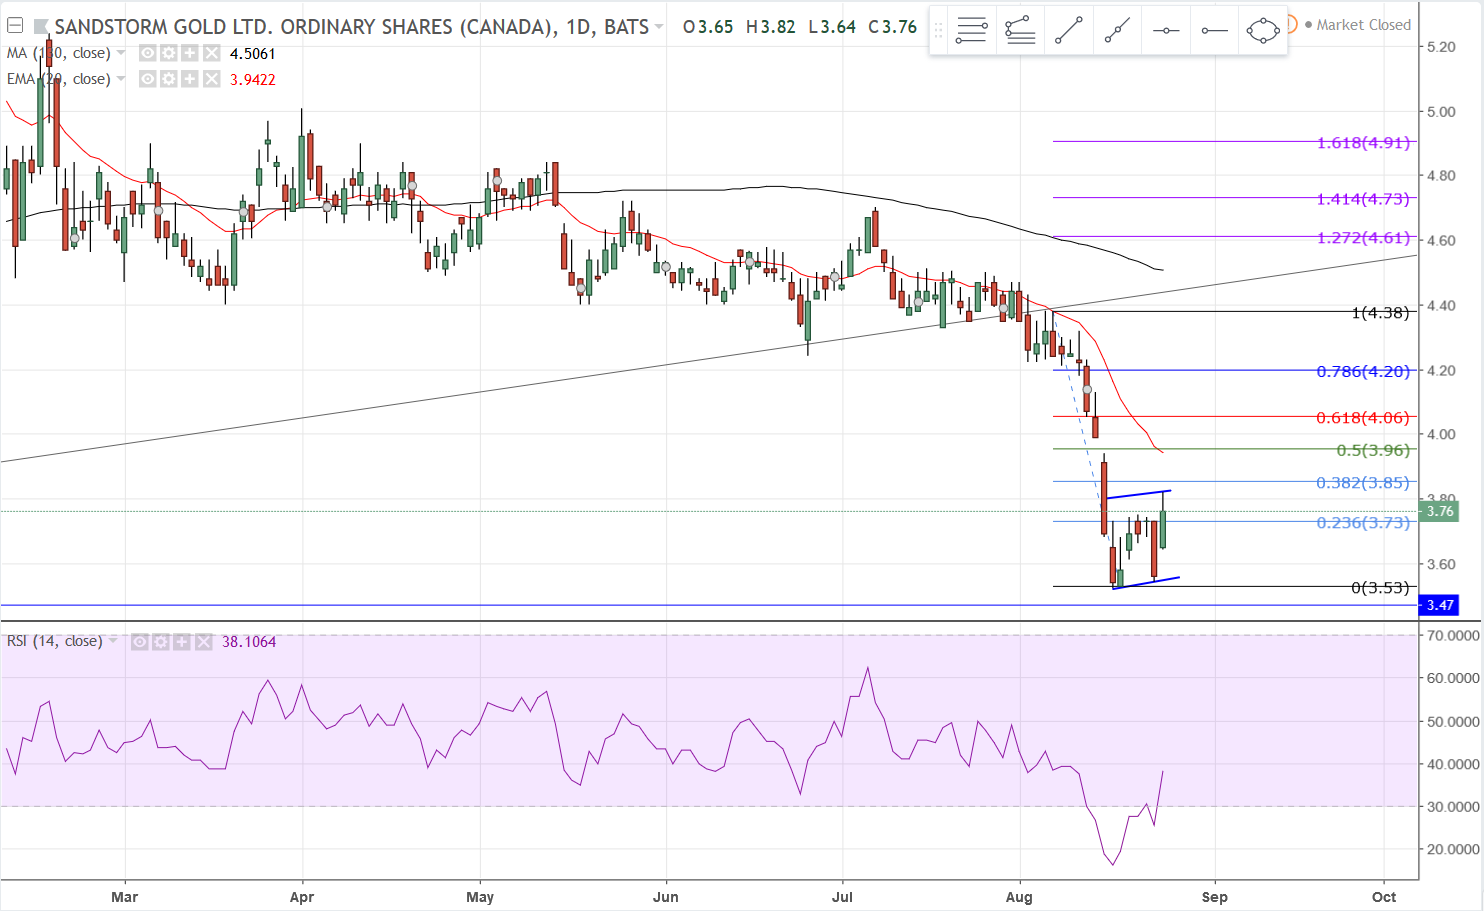
So on the daily interval it appears a bear flag is forming. The downside could take you right into the support range below. Watch for a push above the 20 EMA and also watch the Fibonacci lines. If there’s a move above the 50 or 62% lines and they hold as support, the bear flag is likely nullified. If it pushes back up to the 78.6% level you’ve got a better chance of a reversal. For now I’d be anticipating a move into the blue zone below and see if you get some divergence on the RSI and/or a bottom formation.
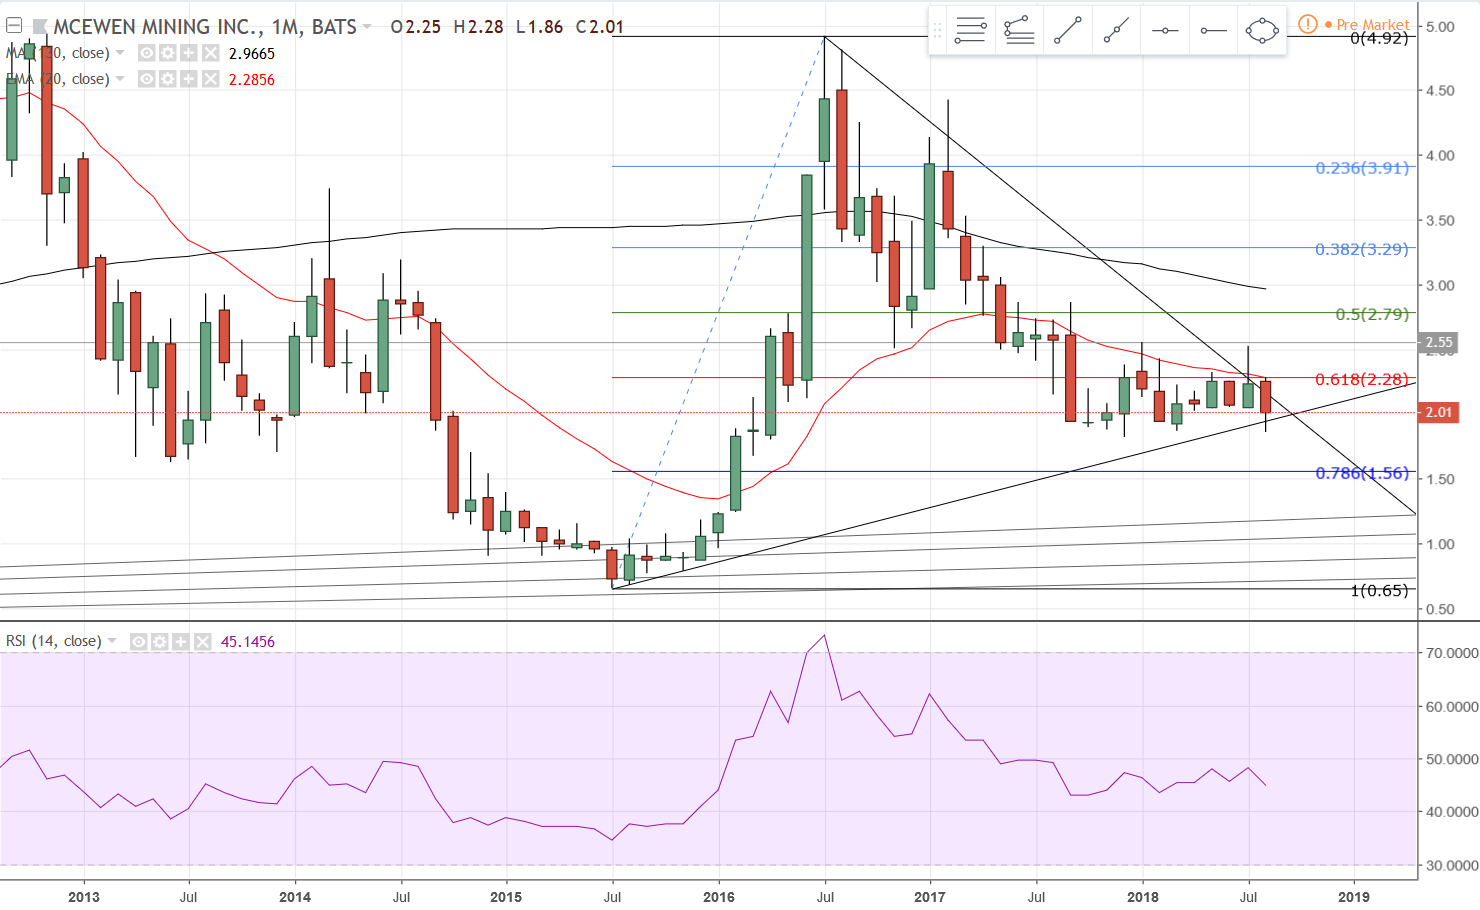
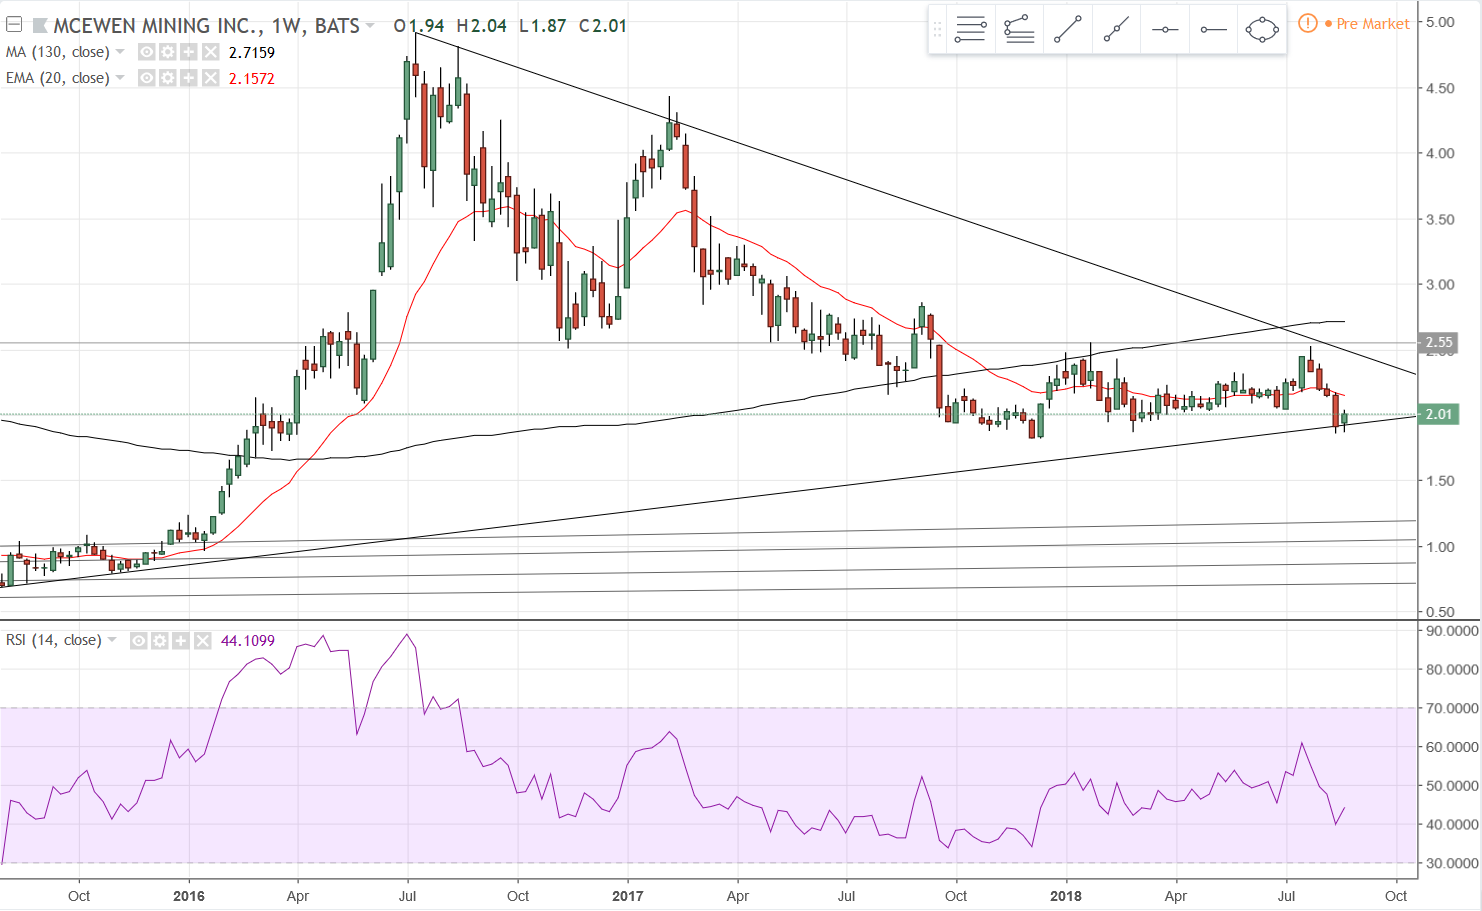
MUX monthly interval shows uptrend line support holding… so far. The 20EMA on this time frame is definitely the resistance to watch. A close above it one of these months and we’re likely off to the races. A break and close below the uptrend line and we’re looking at the 78% Fib retracement at 1.56.
The weekly interval shows the same uptrend line support for two weeks, despite small dips below it. The series of lower grey lines are older uptrend lines, any of which could again act as support.
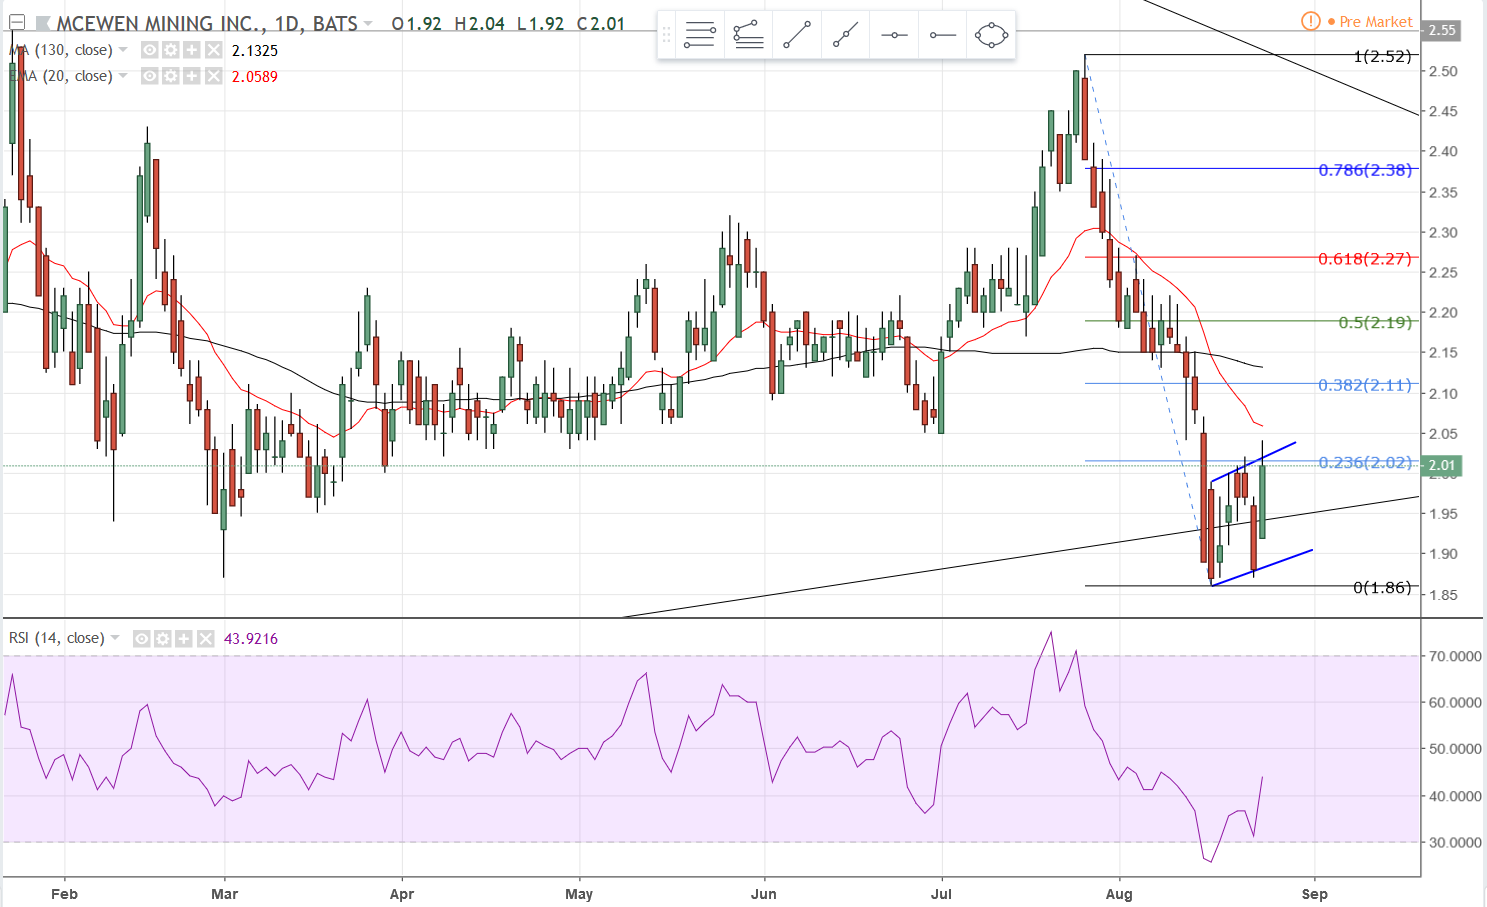
The daily chart looks a lot like the SAND chart. Right now it looks like a bear flag with a drop likely to see 1.50’s, but in the event things go north watch the MA’s and the Fib lines for resistance and support.
2 Likes
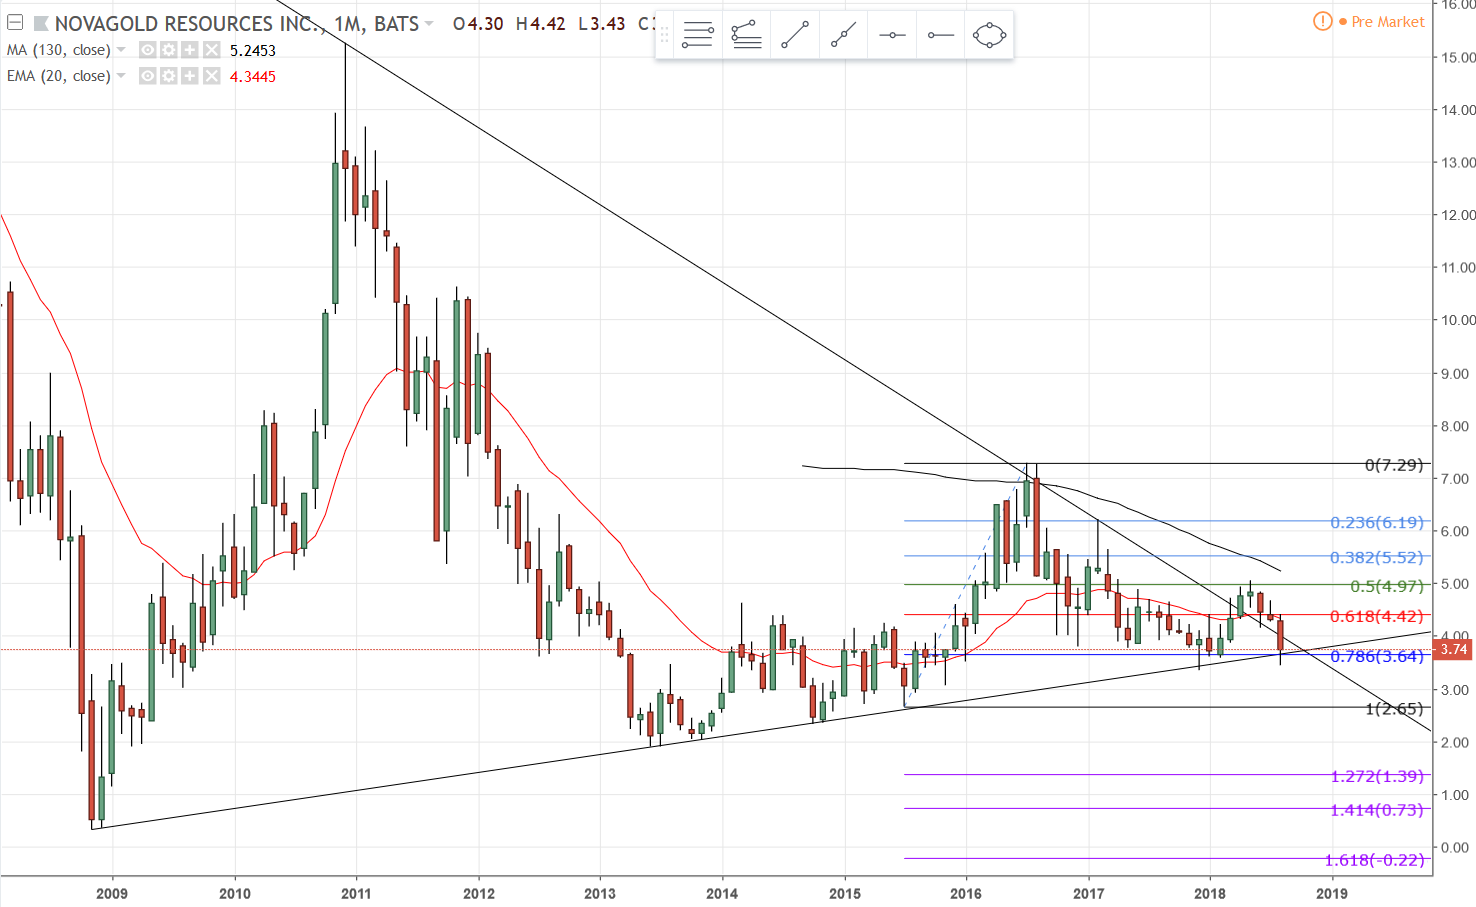
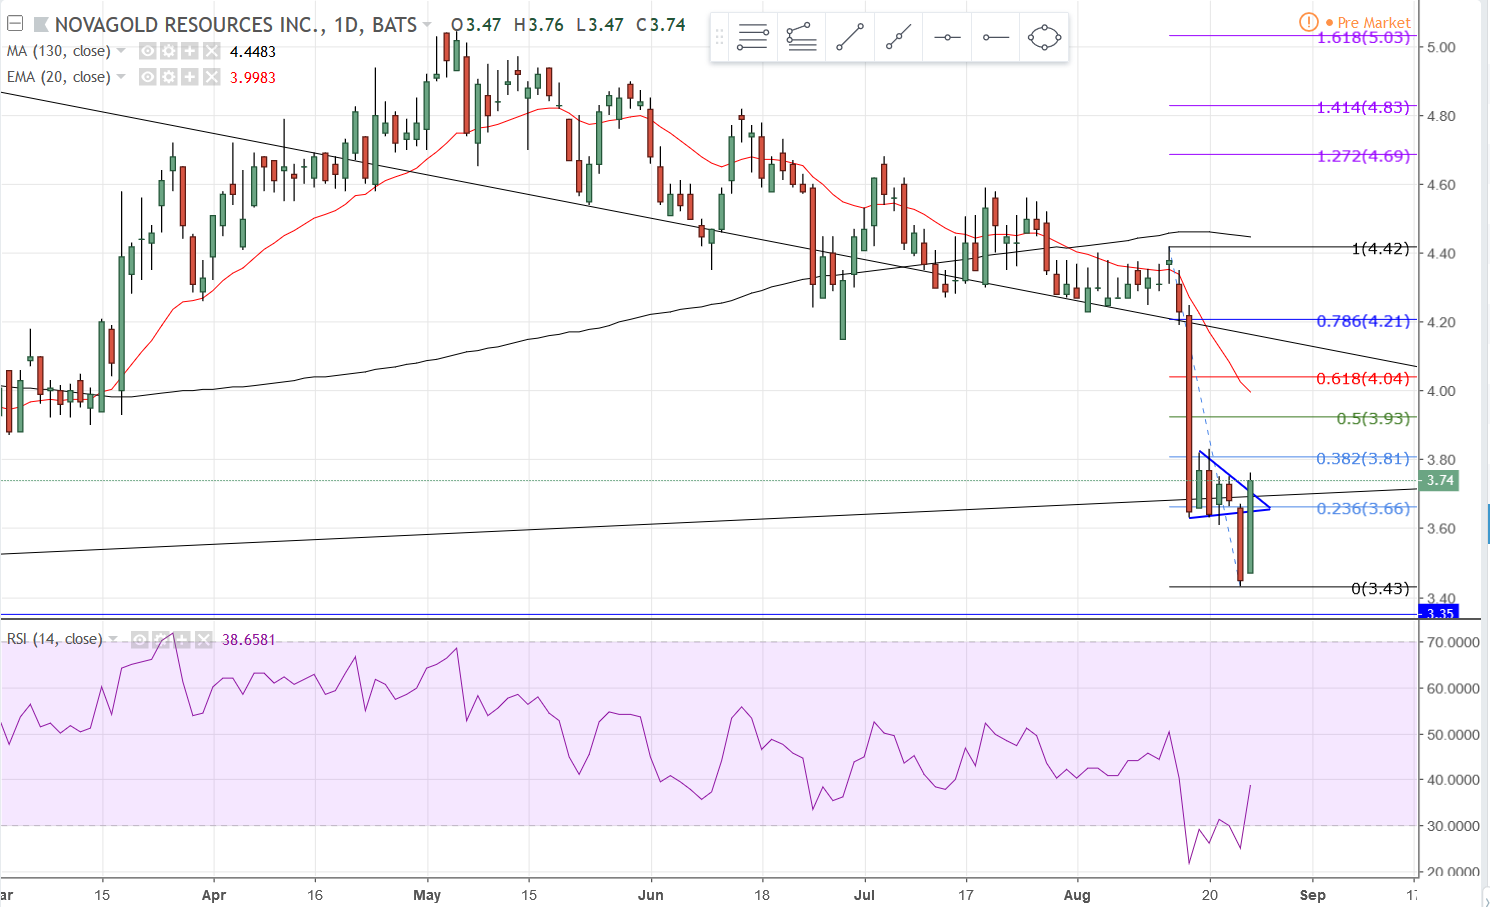
NG monthly interval is similar to the MUX chart, back under the 20 EMA with a dip last week under the major uptrend line. This one is already to the 78% Fib retracement and that uptrend line has been holding like a champ since 2013, although showing some signs of weakness.
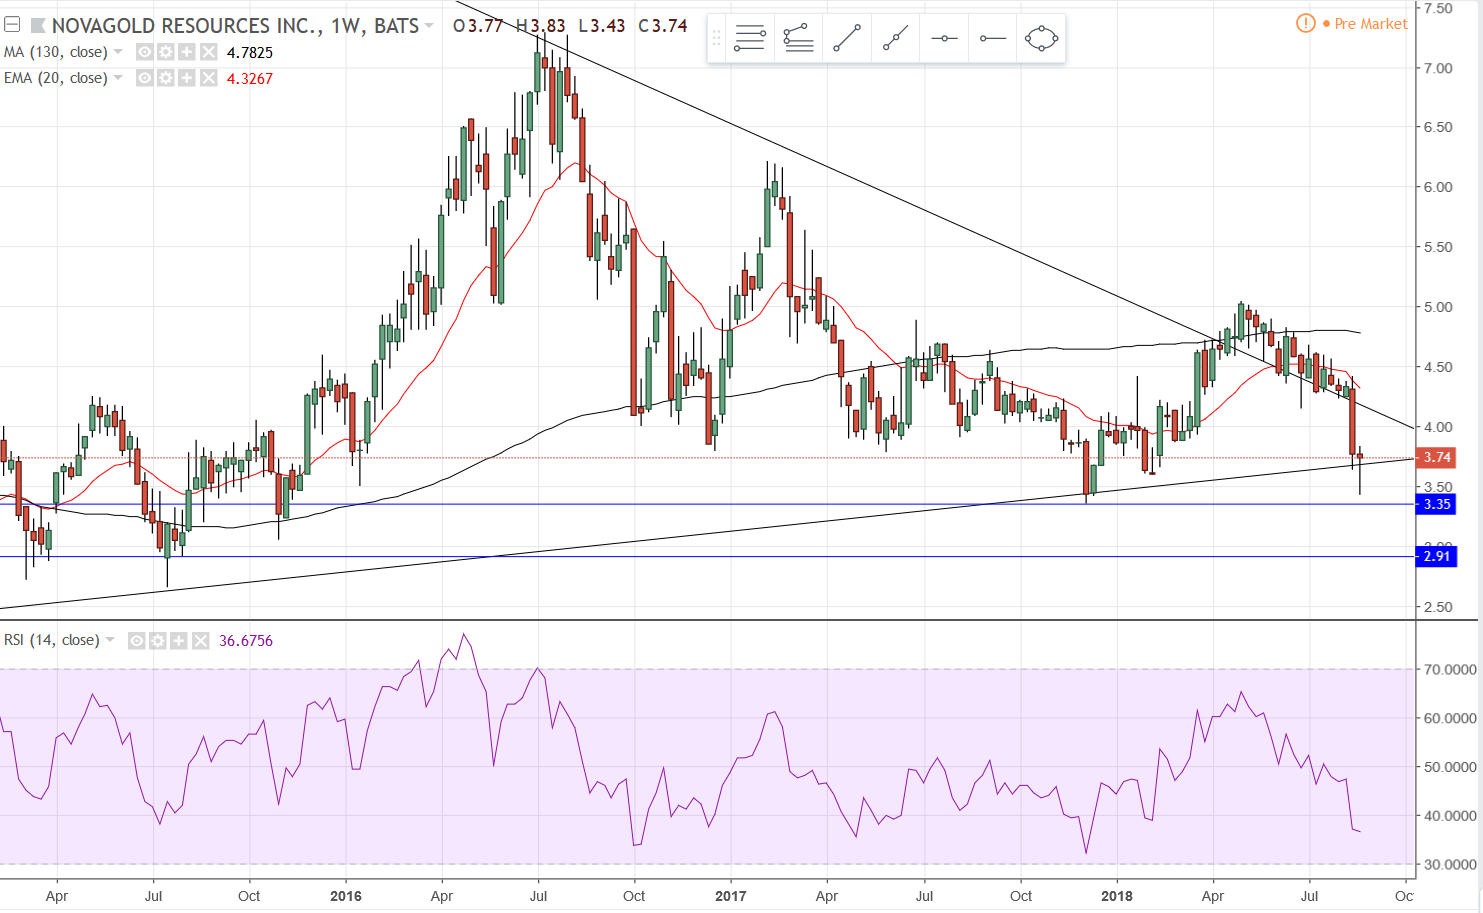
The weekly chart shows a nice rally into the end of last week after a drop below the uptrend line. There’s still room on the RSI for lower prices though. In the event of further downside support is likely to be found in the 3.35 - 2.90 range.
The daily chart provides a little bit of hope in the form of a strong reversal after the drop out of a bear flag. Now watch for upside continuation, or was that just some weekend short covering from oversold levels? What could be occurring with the candles that form the flag and onward is one of those downward trending bear flags that ends up breaking upwards instead of lower. As with the previous stocks posted, watch the action should it reach the 20 EMA and how it behaves at the 50, 62 & 78 % Fib retracements.
4 Likes
Thank you (as always) for the TA Rich.
On the SAND daily chart, I was wondering why you drew the top resistance line of the bear flag hitting the top of the wick of the last candle. Was that just because that was the highest point of the week? I’d be more inclined to draw the top resistance line of the potential bear flag along the tops of the previous few days’ candles which would imply that the bear flag resistance had been broken through on Friday…and then closed right at that resistance line.
Today (with the benefit of hindsight), SAND closed at 3.89 and appears to have broken out of that bear flag on the daily. It appears like it should run to $4.00 to close that gap, that is, if the price of gold holds steady or ticks up some more.
[quote=“cornhuskergold, post:984, topic:1057, full:true”]
A new Dr. Quentin Hennigh (Chair, President and chief geo of Novo Resources) interview.
… [/quote]
Yet another Hennigh interview released:
http://www.kereport.com/wp-content/uploads/0825-1-4-1.mp3
Pic of Artemis building their new gold circuit on their Radio Hill processing plant getting ready for running larger batches of gold ore:
https://twitter.com/BramwellWayne/status/1033896005542899713
2 Likes
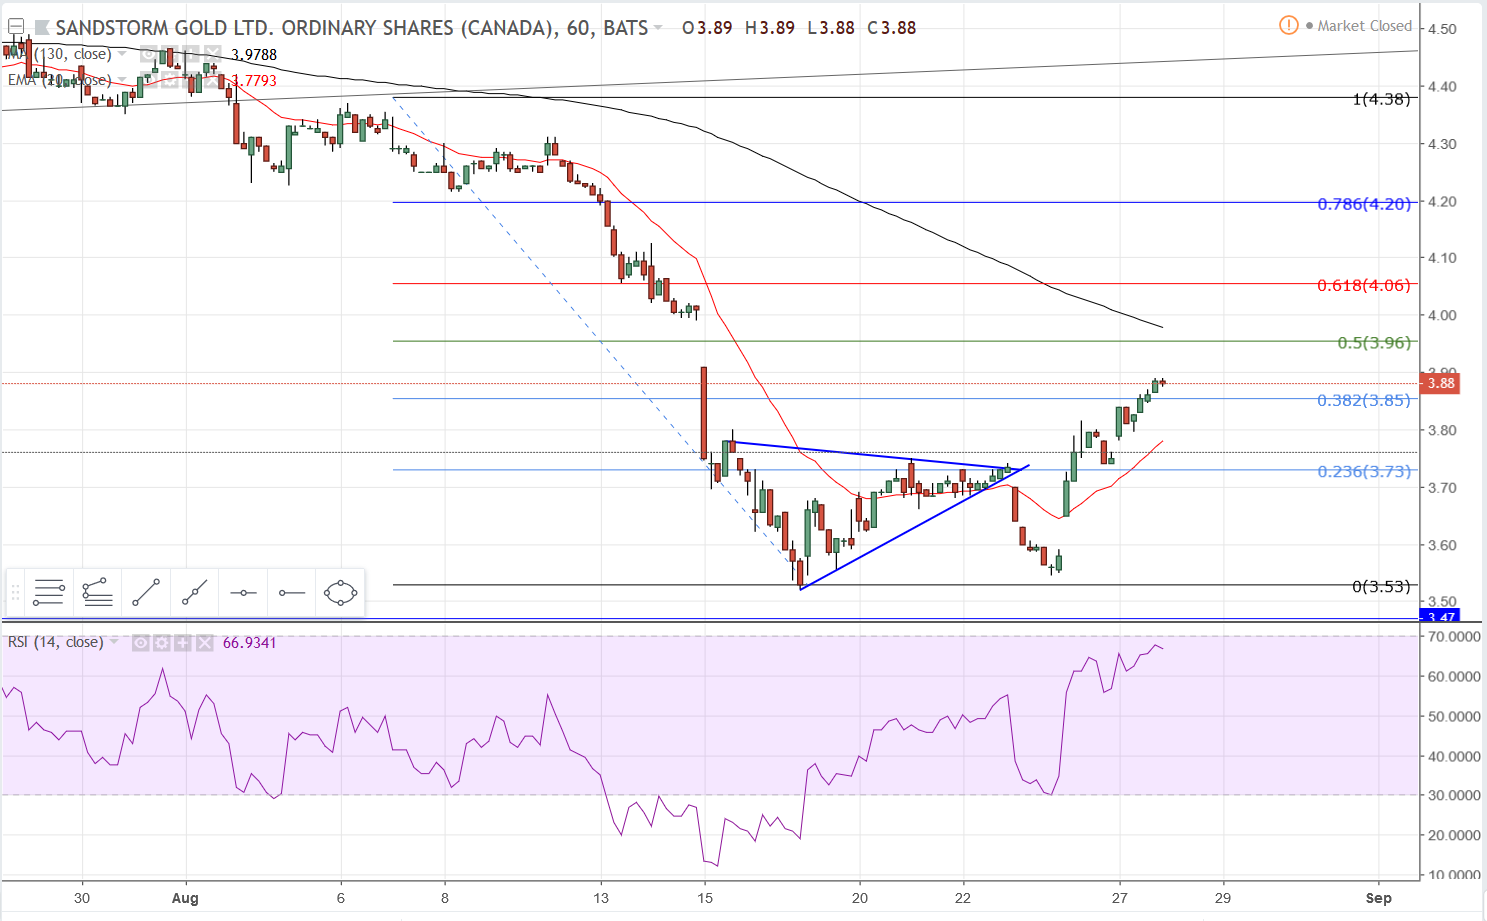
Good catch Rick. The reason why is because I drew the flag using the hourly interval chart but neglected to mention that in the post. Here’s the chart…
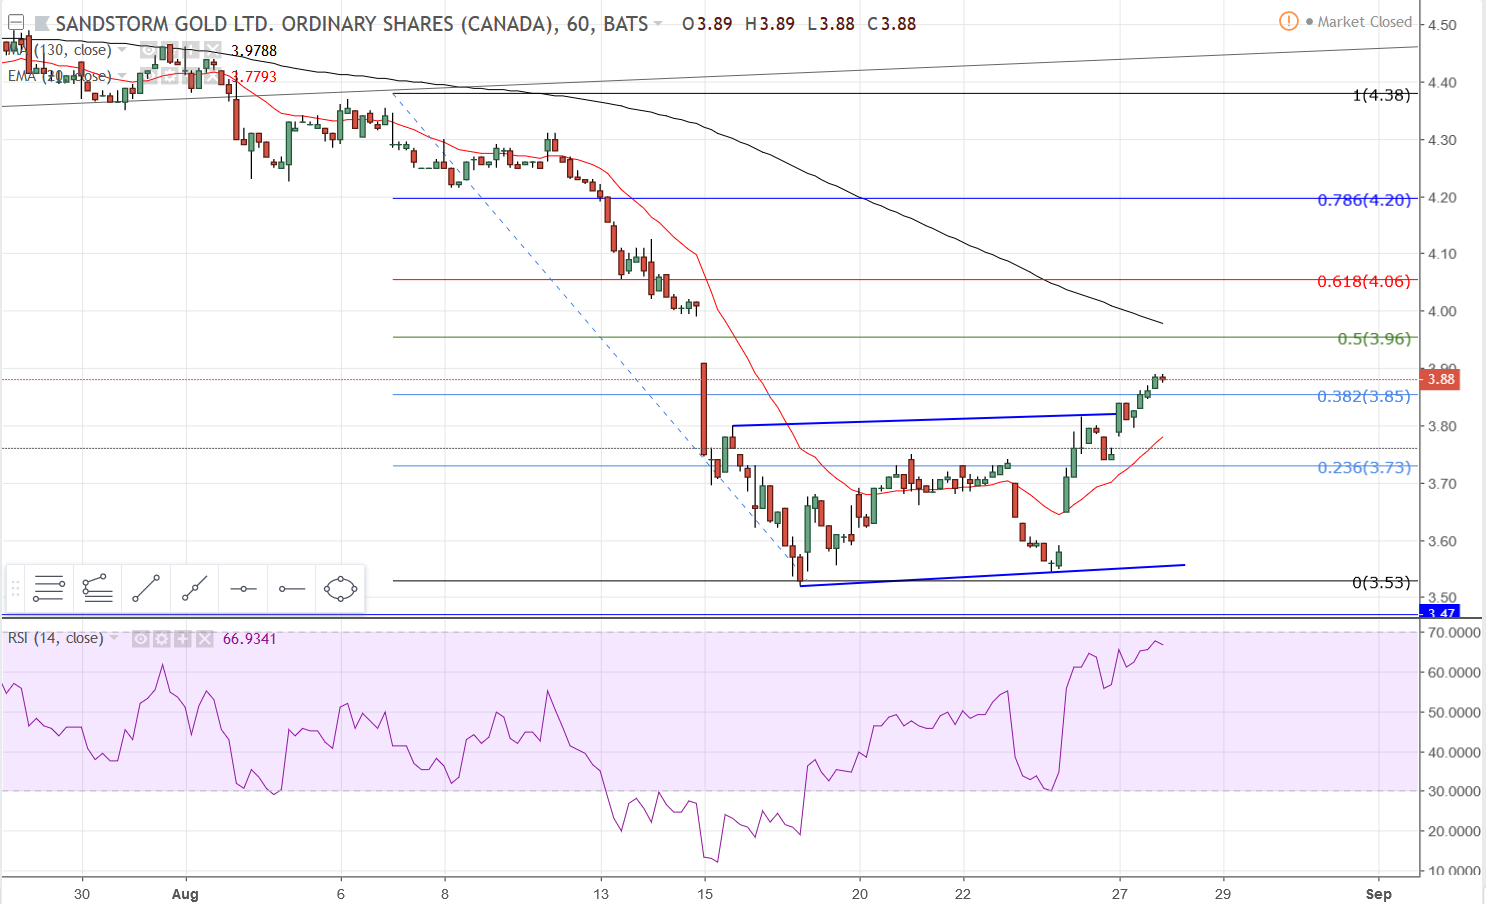
In retrospect, maybe I should have drawn it this way, which shows a drop out of a bear flag only to reverse just shy of a double bottom with follow through today. This looks better, but on the daily chart it’s still under the 20 EMA and there’s three Fib resistance levels to work through, but so far so good.
I figured it wasn’t arbitrary on your part. Thanks for clarifying!
1 Like
Artemis reports a nice drill hole:
132m @ 4.89g/t Au, 0.25% Co and 1.11% Cu from 98m
3 Likes
I[quote=“cornhuskergold, post:1012, topic:1057”]
Artemis reports a nice drill hole:
[/quote]
Nice may be an understatement!
The other drill holes highlighted at Carlow Castle are impressive:
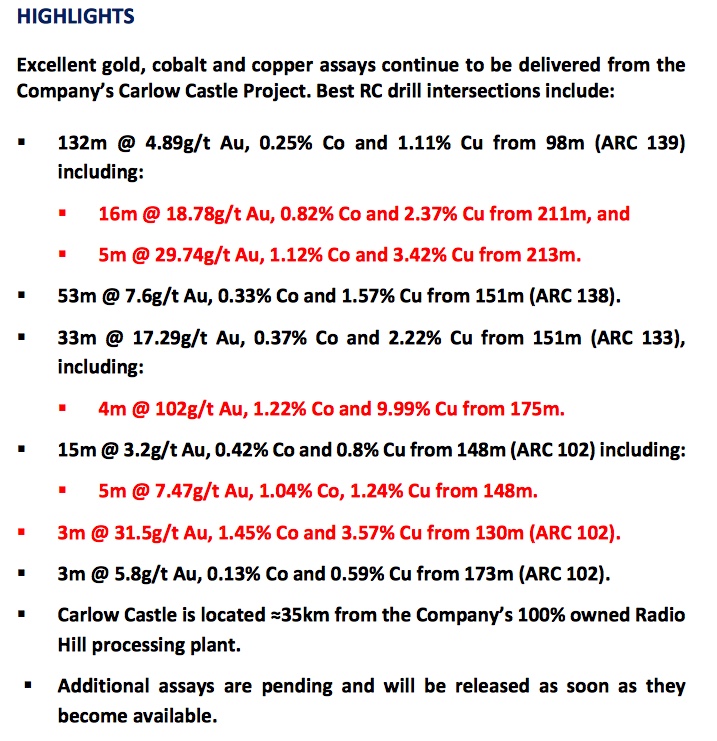
Additional assays are pending. Pilbara also continues to report awesome results.
Of all the Pilbara plays, I’m most heavily weighted in Artemis…and when reports like this keep coming out, I feel like I still don’t have enough. At a $115m market cap it seems like this one has more room to run than a more established outfit like Novo, but I realize that it’s based more on potential and speculation than fundamentals. Regardless, as exploration results continue to come in from all the Pilbara plays, all will get a boost as the district gets further validated.
1 Like
Even better, that’s 115M $AUD, even a little less than that today even up 8+%, or a little less than $80M USD. Seems kinda crazy considering they have $25M+ in the bank (granted they are spending that pretty rapidly).
Up 14.7% on 5.37 million shares traded
From this morning’s email:
Artemis Resources Limited is pleased to announce appointment of Deutsche Gesellschaft für Wertpapieranalyse GmbH, a boutique European investment and financial markets consulting firm based in Frankfurt, Germany to support the Company’s existing listing on the Frankfurt Börse.
Commenting on DGWA’s appointment, Mr Müller said:
“DGWA is pleased to be working with the Artemis team as they expand their presence in the European market. Base, battery and precious metals are well understood here, and Carlow Castle will be of particular interest to European retail, institutional and strategic investors, as many are seeking greater exposure to battery metal opportunities outside of Africa.”
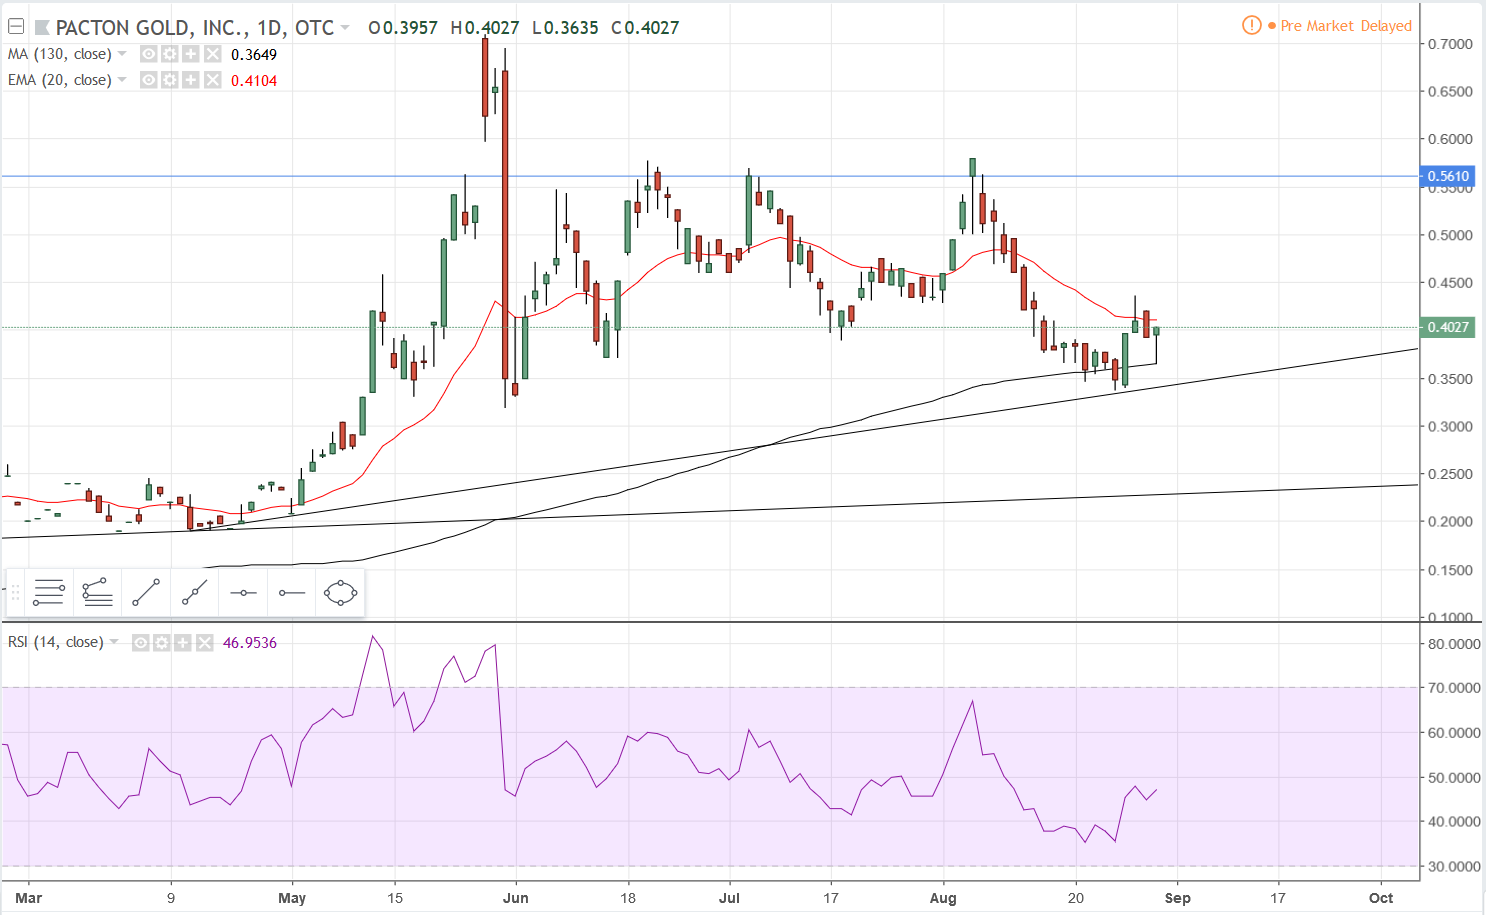
A couple quickie daily interval charts that look interesting…
PACXF has found both uptrend line and 130 MA support with resistance at the 20 EMA. A pop above the 20 EMA looks like it could produce a run to .50 - .56 for a nice percentage trade.
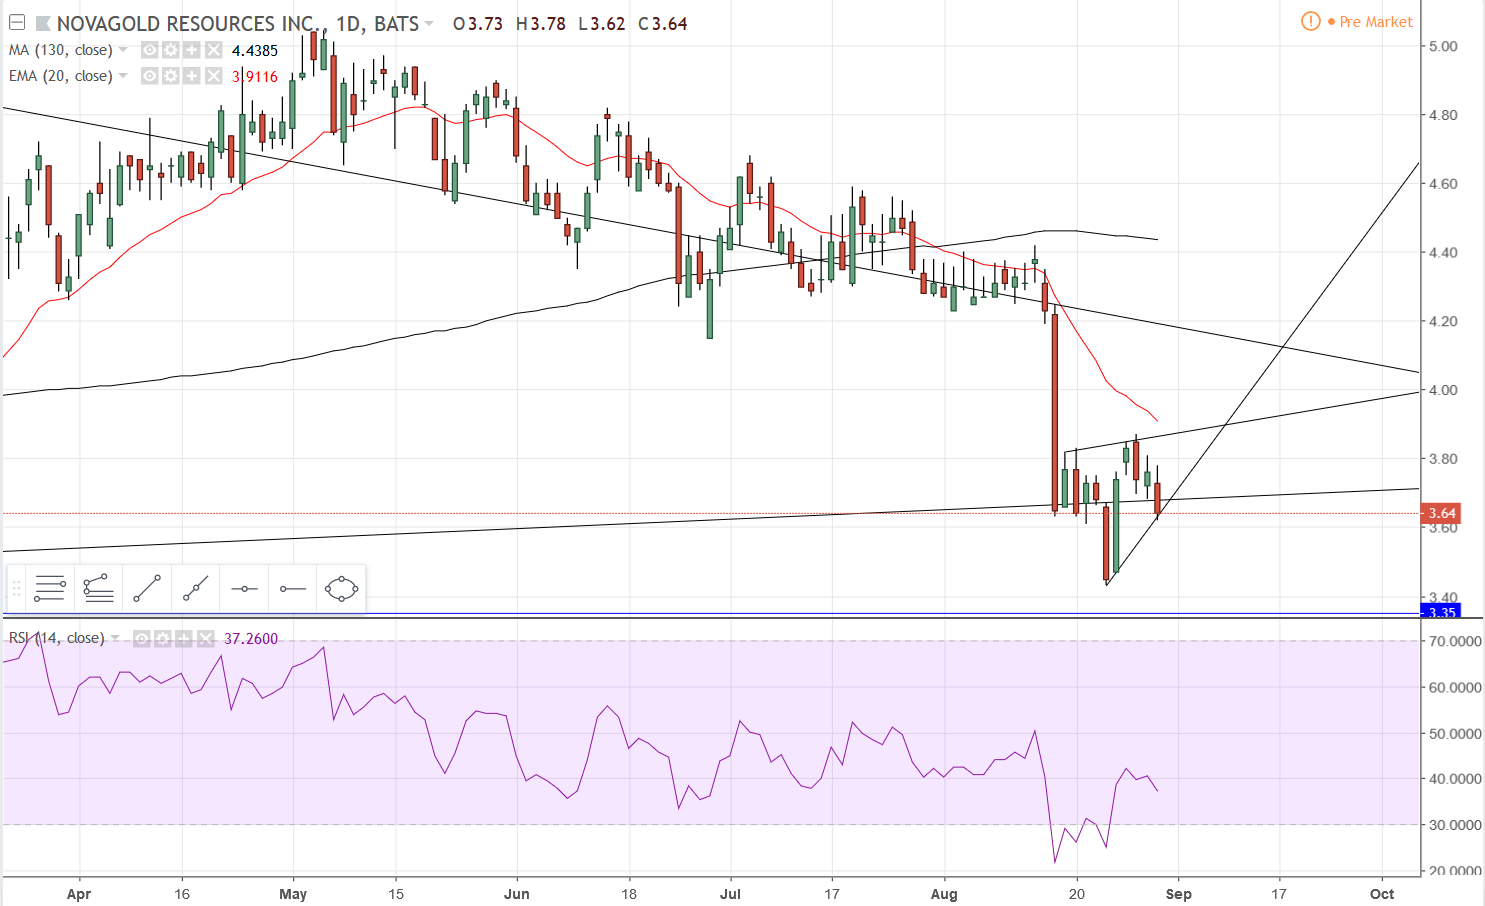
NG could be making an inverted head & shoulders bottom. Today’s candle will be interesting because a move lower would pretty much nullify that. If the formation plays out you’re looking at a move to the low 4.40’s.
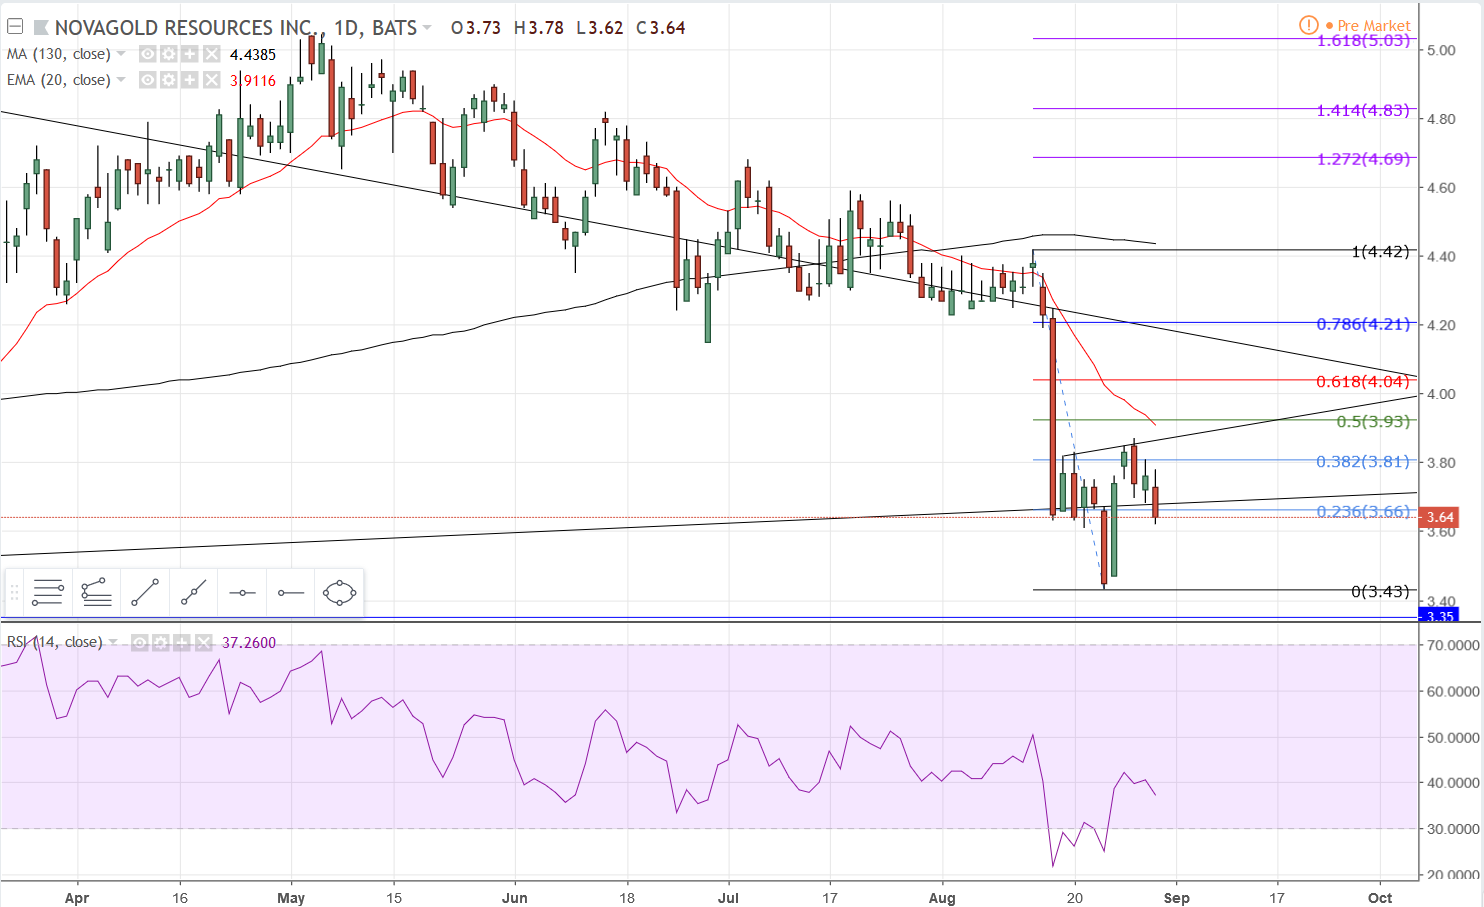
… It might also be making a bearish wedge, so tread carefully…
1 Like
The Gold-Silver Ratio
Is it important?
The gold-silver ratio supports outperformance for silver. The ratio is approaching historic extremes and currently sits at 82. The last time it was this high was March 2016 and silver went on to gain approximately 30% to that summer’s high. The time before, the gold to silver ratio moved to 90 during October of 2008 then silver prices went on a massive rally.
https://www.nasdaq.com/article/elliott-wave-forecast-for-gold-silver-hints-at-a-shiny-future-cm1015958
Actually the gold-silver ratio finished the day around 84.