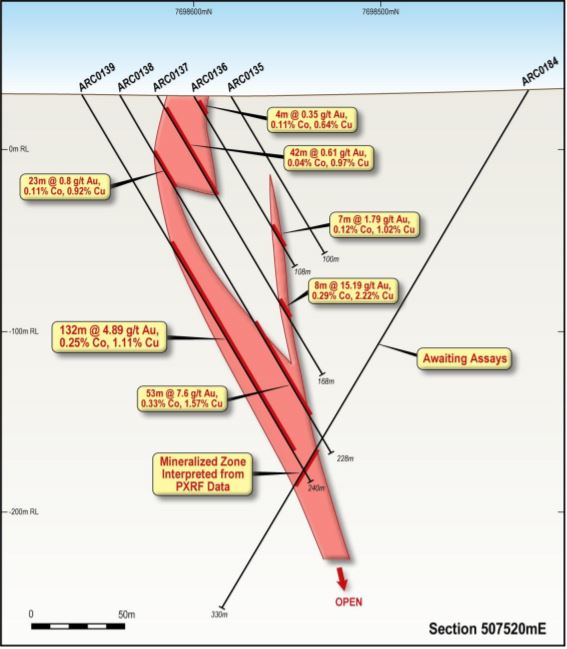
I saw those assays and my eyes just about popped out of my head! Finally, a big huge new discovery that I can get in early on?! Well maybe not.
I noticed that they drilled along the long axis of the deposit so not nearly so impressive as it appears. The upside potential on it is also limited based on the plunging narrow nature of it. Refer to diagram. (I’m not sure of 3-D nature of it…how far does it go into the page so to speak?) Still, the fundamentals of the stock look sound and they sure got a lot of good property to play with.
Rich,
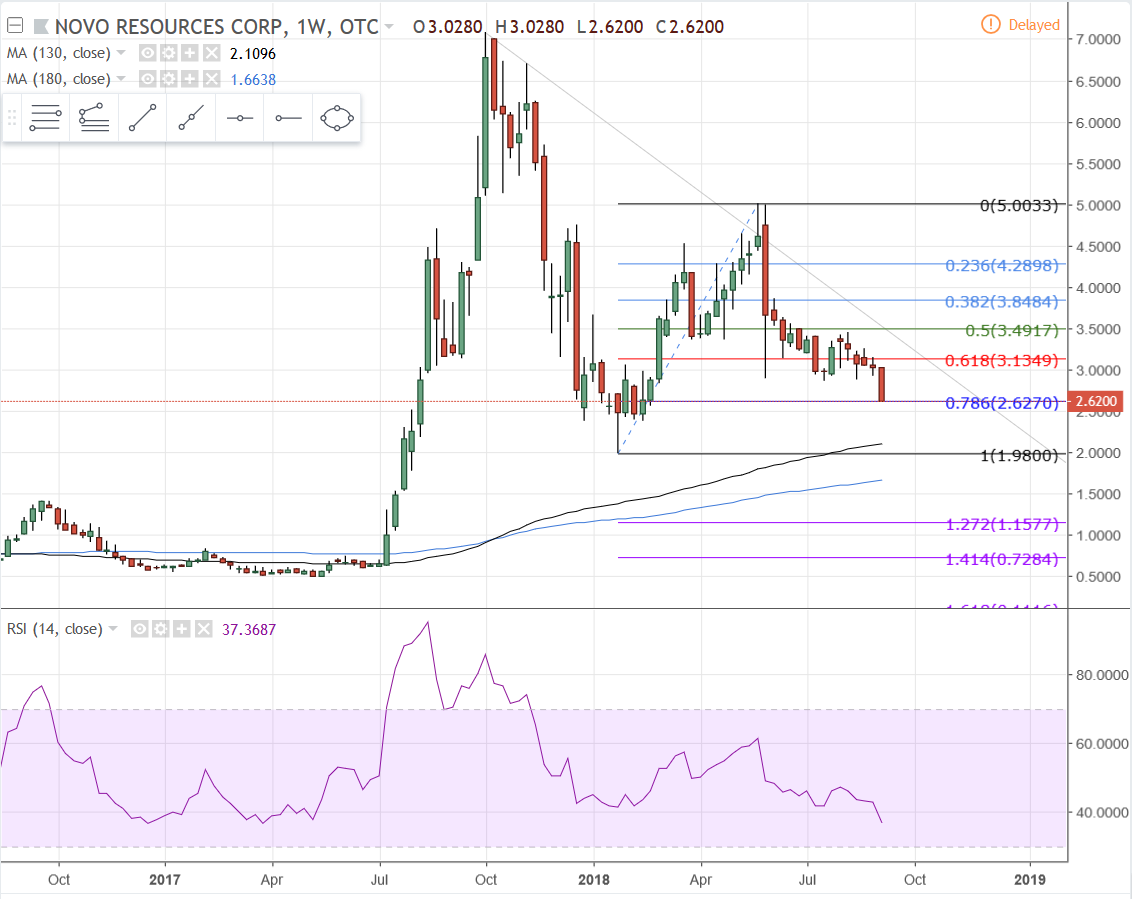
Can you please take a look at NSRPF (Novo Resources). They are one of the key players in the Pilbara Region and they’ve taken quite a hit recently.
Thanks!
The weekly interval shows a retrace right to the 78.6 retracement, which tends to mean there’s a good chance for a eventual full retracement back to 1.98. Watch the 130 MA at 2.10 currently, as well as the 180MA at 1.66. Both those MA’s will dip a couple cents by the time the share price reaches them, if it does.
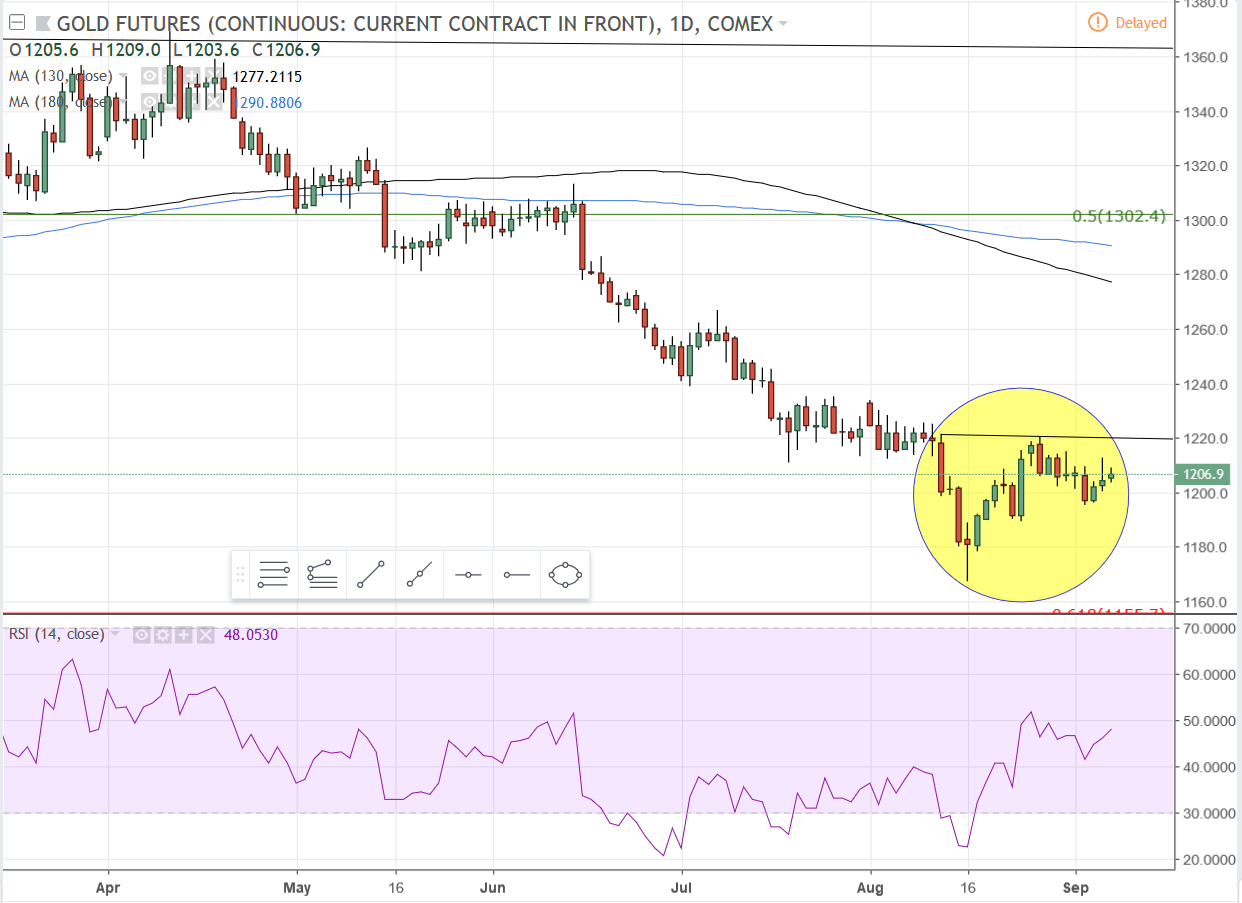
This is the daily interval gold chart. Highlighted is a Adam & Eve bottom formation, very much like a cup & handle except that the “cup” part is “V” shaped instead of “U” shaped. If the formation plays out, the measured move from the breakout should be to around 1260, and it looks like the 130 MA will be right there to meet it as resistance.
PACXF is nearing a test of the 180 MA. It’s over sold but there’s still room on the RSI for more downside. Trend line support is currently around .232.
You’re welcome! You guys really shouldn’t be shy about asking for updates. Most of the time, well… at least quite often, I have the time to do them and they usually don’t take very long. I still enjoy doing TA and it’s actually easier (and I like it) if you guys post when you want me to do one and I’ll get to it asap.
I picked up some physical gold today at around 1202-1203 in the event the earlier mentioned bottom formation plays out. Otherwise, I still think it’s a good long term hold at a good price.