Thanks but I’ll stay away from penny stocks for a while…
1 Like
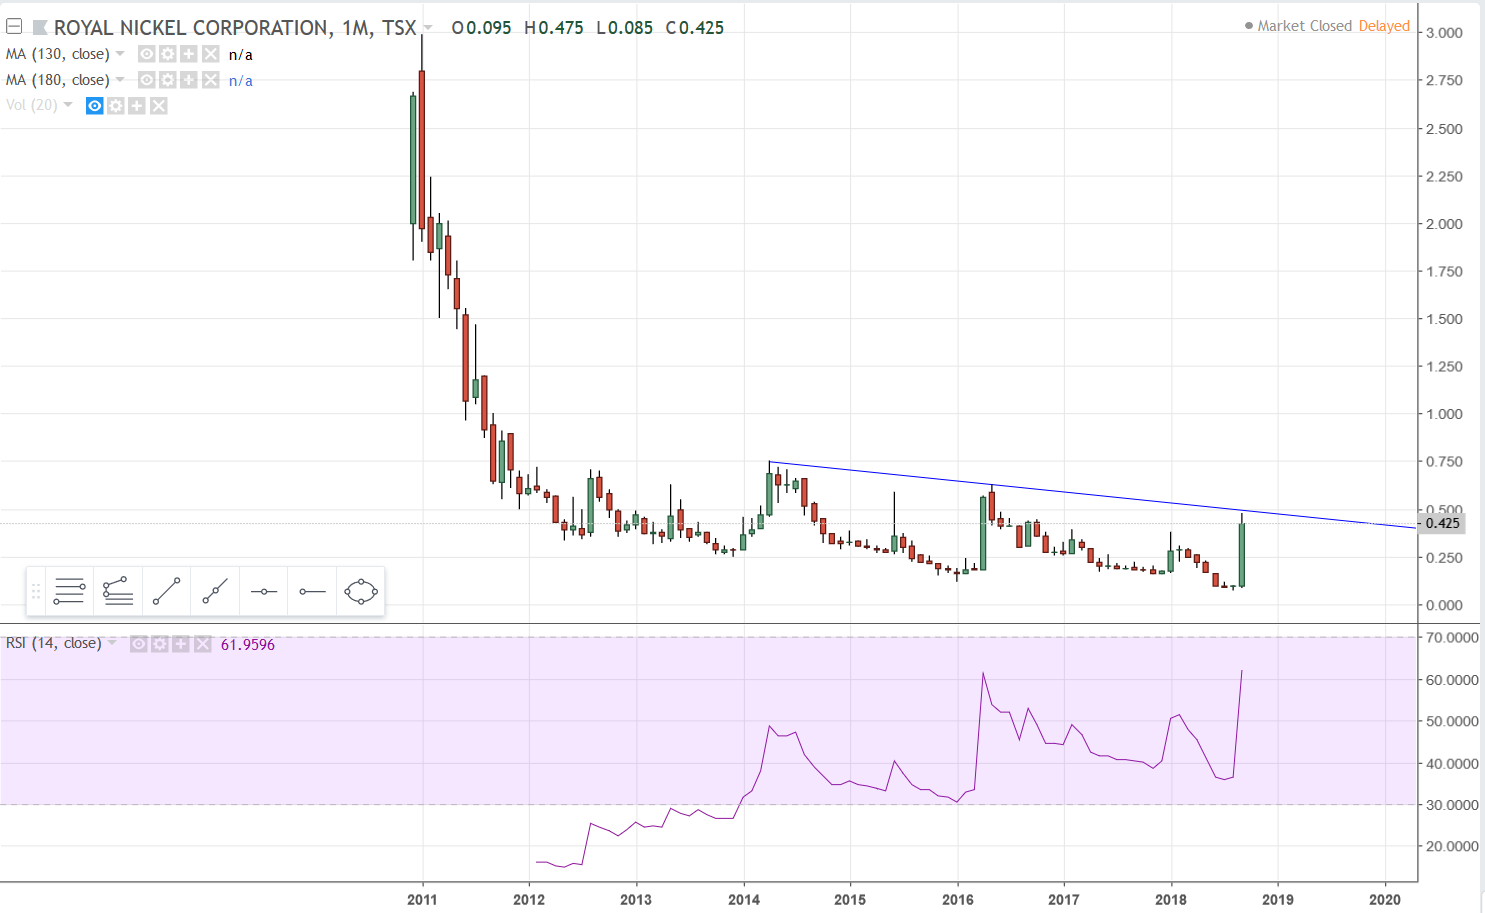
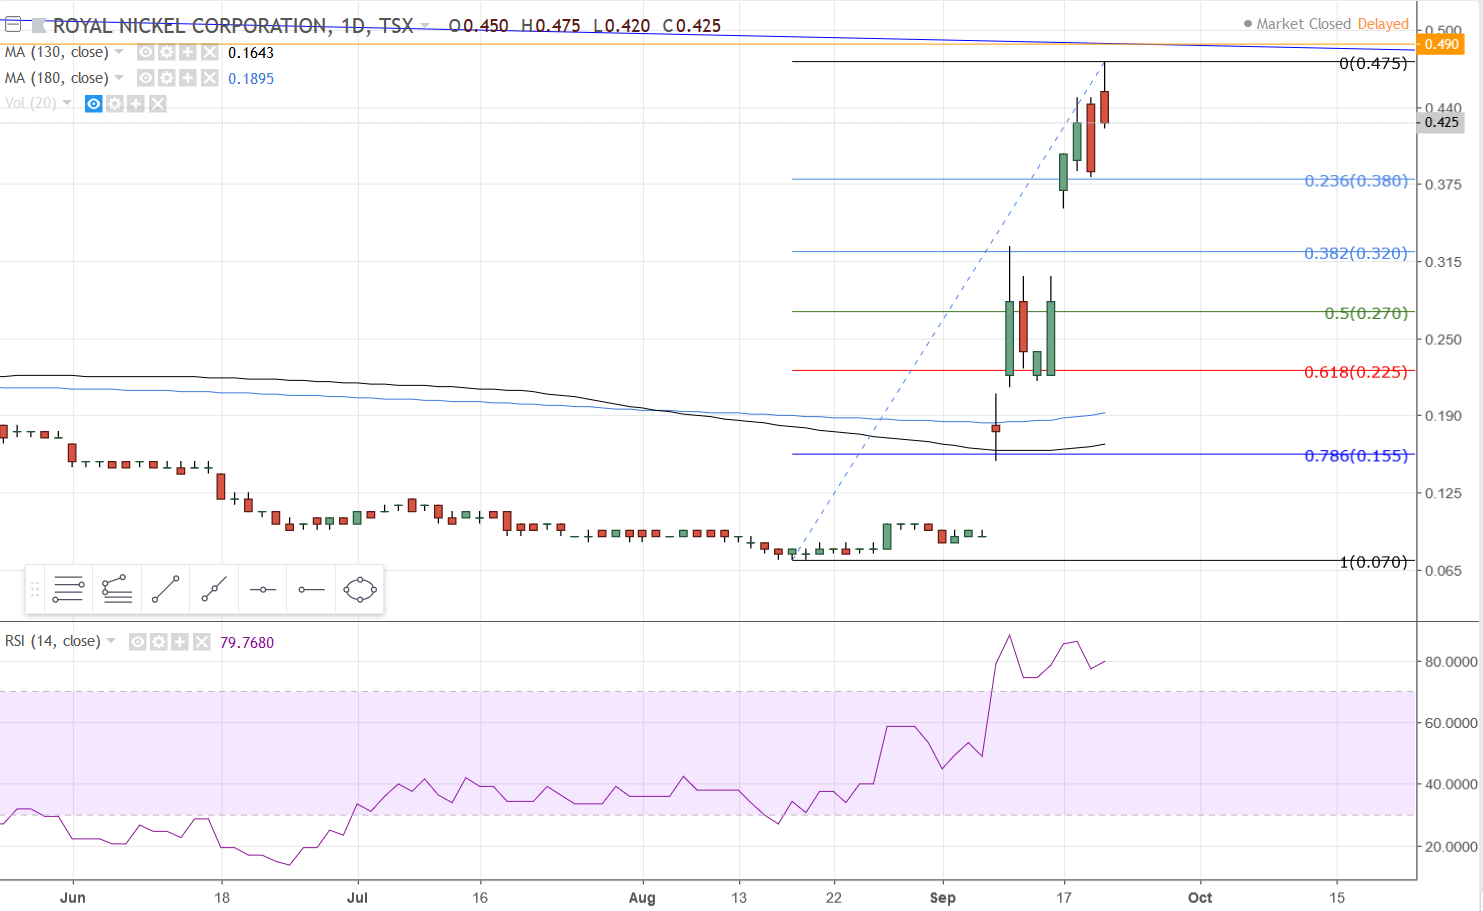
The monthly chart shows price approaching resistance at a 4+ year downtrend line. The daily chart will show this could be hit tomorrow if it gets to .49.
Wednesday the stock closed at .385. It gapped open Thursday at .45 and only dropped to .42. Watch .385 for support, although I expect it could drift lower and eventually fill the gap at .30, if not .095 eventually, depending upon why it moved up the past two weeks. In the event the stock has hit its high and retraces from here, watch the Fibonacci retracement levels for support. If the stock remains strong it won’t go much below the .382 level, but the 50 and 62 levels are common.
1 Like
There isn’t enough info on the monthly and weekly intervals to be very useful, but the daily shows a move above the 130 MA with a close and test of support there today. Watch the MA’s and the trend lines. Volume remains pretty low so if accumulation is occurring nobody is in much of a hurry or are doing it slowly & stealthily.

2 Likes
I guess it depends on the time frame Rick. On the weekly KL is so far maintaining all but the steepest of up trends. There’s some nice volume coming into it this week which could be telling…

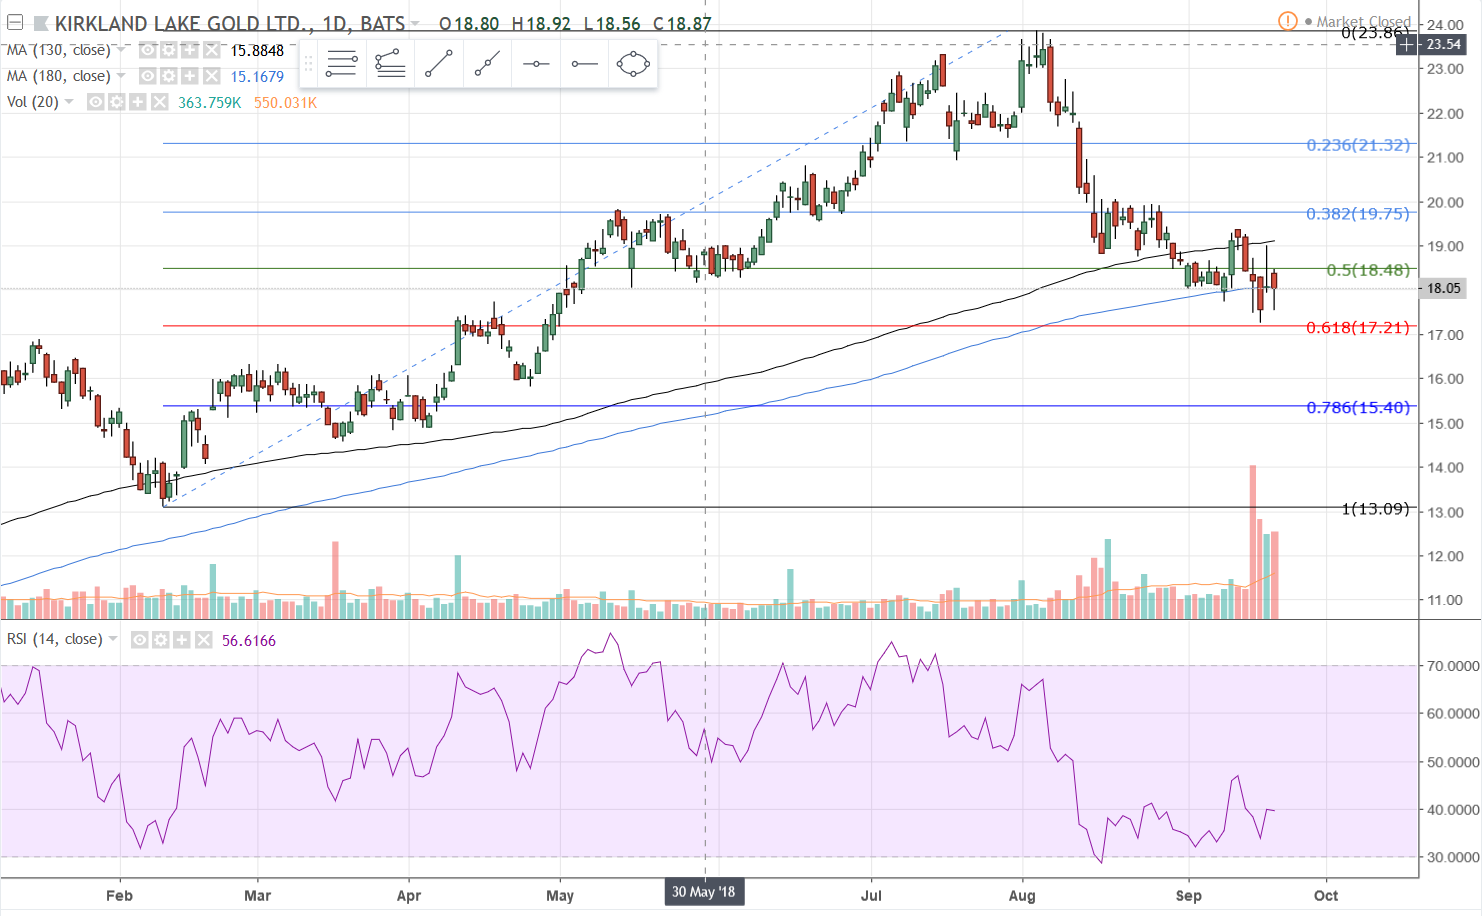
On this daily interval you can see where the rate of selling slowed, when it hit around $19. It made a downward sloping bear flag but didn’t have a typical drop out of the formation. For the past three weeks it has been slowly drifting lower, but with volume increasing as it does so, and with some RSI divergence. It’s doing a decent job holding the 180 MA this week as well, but tomorrow is another day and there is trend line support just above 16.50. The level of volume this has had in the past week causes me to think that someone sees a bargain and/or knows something is coming. Maybe they had some bad news early this week, but a $2 drop in price doesn’t jibe with the volume unless someone is doing a lot of buying.

This is the same daily chart with Fib retracement grid. It isn’t obvious why I started the Fibs where I did on this chart, but if you look at the weekly chart you can see I started the grid at the low of the last significant selloff of the stock, which also marked a double bottom. You can see that the 62% retracement was almost hit and maybe that will be good enough. The stock is in an interesting place right here with the Fibs and the two MA’s. Watch for a bottom confirmation. It’s already got a left shoulder and head for a potential inverted head & shoulders bottom. Another couple weeks to see it play out, or less if it doesn’t come to fruition.
1 Like
Thanks Rich. The company had a few announcements this week, in particular that it has bought back $38.9 million of its stock in the 3rd quarter. Who knows?..maybe they bought back some more in recent days to take advantage of the lower prices. They also announced a .03 dividend.
And they also acquired about 15 million shares of Osisko Mining for $25 million - fueling rumors that they may be looking to take it over.
And yesterday they announced pretty spectactular drill results at their Swan Lake - Victoria, Australia gold project.
289 g/t Au over 7.45 m (ETW 6.0 m), including 2,857 g/t Au over 0.75m (ETW 0.6 m) in hole UDH2551;
155 g/t Au over 11.9 m (ETW 9.9 m), including 1,566 g/t Au over 1.1m (ETW 0.9 m) in UDH2584A;
423 g/t Au over 3.55 m (ETW 3.2 m), including 760 g/t Au over 1.95m (ETW 1.8 m) in UDH2555;
215 g/t Au over 7.2 m (ETW 5.9 m), including 846 g/t Au over 1.55m (ETW 1.3 m) in UDH2590; and
353 g/t Au over 4.0 m (ETW 3.4 m), including 3,740 g/t Au over 0.35m (ETW 0.3 m) in UDH2552.
I was looking to buy KL in the 20s, so anything at current prices is that much more of a bargain for me. I might take a nibble tomorrow.
Artemis Resources:
There’s been an update on the Radio Hill plant:
the construction and refurbishment work associated with the gold circuit will be completed by next quarter.
The Tailings Storage Facility should be approved in October.
And I thought Pretium had lots of visible gold!
Of course KL opens down and as I was setting my bid, it kept rising and hasn’t looked back. Now up 4.5%. I don’t want to chase it and pay a $500 opportunity cost premium because my timing and bid was off. Oh well.
Nice pop on Artemis today, though quite a spread.
1 Like
Artemis looks good technically for a pop up to 18 cents within the next few days.
The fundamentals are rising too.
TR - could you do a chart on GLNCY?
Looking interesting.
Also, Pacton Gold again - PAC.V or PACXF
TIA
Also, FWIW, link to extensive WATCHLIST for Denver Gold Forum (Sun - 23 Sep, 24 Mon - 25 Sep, Tue - 26 Sep, Wed - Sep):
Australia is just the land of giant nuggets of gold these days:
Dr. Quinton Hennigh of Novo Resources is presenting in Denver at 9:15 MT. Live stream available. See link on Novo Resources website under the announcement of the presentation.
This QH interview came out today:
http://www.kereport.com/wp-content/uploads/2018-09-22-Weekend-Special-Quinton-Henigh.mp3
Dr. H. states he has “interesting information” to present on Monday and wants everyone to get it at the same time.
In addition, he discusses their new land acquisition of a few days ago and explains what they see there. In short, they see “watermelon seed” gold as seen in the conglomerates but it is in alluvial form having been washed out of the conglomerates into local extensive gravel beds. They were able to identify the source conglomerates. And, btw, this is 150km east of where they are exploring the conglomerates with Artemis and on their own property once again lending evidence to the extensive nature of the conglomerate gold.
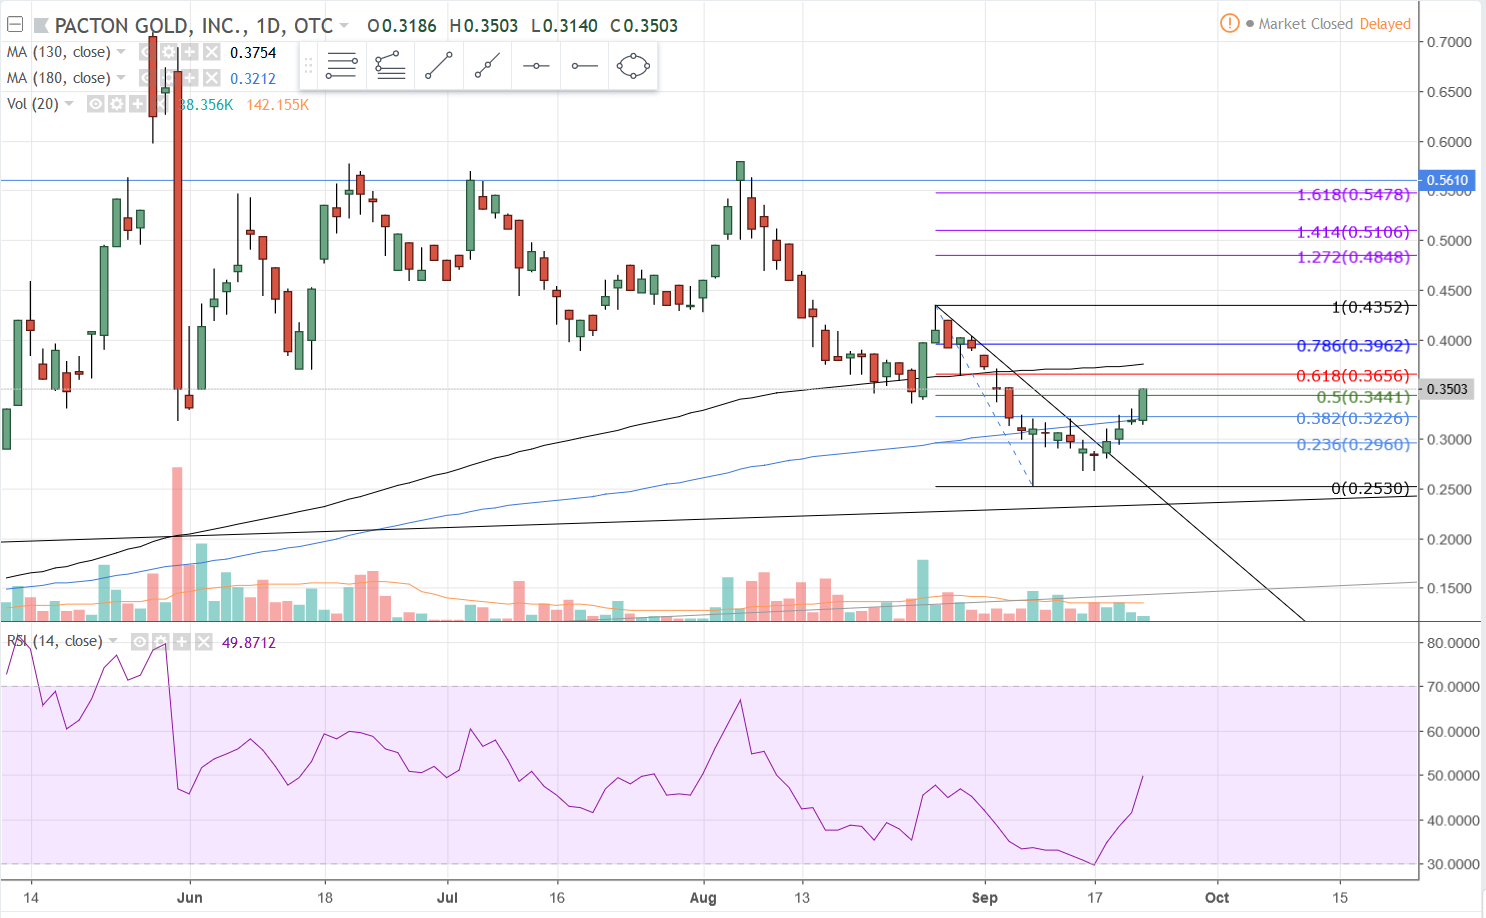
PACXF Daily
This one made what looks like a adam & eve bottom formation and, in the process, broke above a short term downtrend line. The breakout of the formation was also a break above the 180 MA. RSI is at 50 so you’re not near overbought. The 130 MA resistance is just above at .3754. Volume has been less than spectacular. Next week is easy… watch the 62% retracement level and the 130 MA for resistance. If you get a break above the 130 and a test of support there then watch for the test of resistance at the last swing high of .4352.
1 Like
GLNCY Weekly
The price has been hanging around the 130 MA the past couple months with a hint of a move to the 180 a week prior that didn’t get there. Last week a breakout move occurred above the previous swing high with close to 3x the 20 week avg volume and a close .04 off the high. It all bodes well for further upside next week.

A number of things to be aware of on the daily chart. First just notice the RSI divergence marked by the red trend lines, an early indicator to watch for a trend reversal. Next, the yellow horizontal line represents immediate overhead resistance at 8.80 - 8.90, and notice also a downtrend line right in that area that should be respected. Next, the Fibonacci grid shows the 50% retracement coming up at 9.05 with the 130 MA hovering just above. Finally, the RSI is nearing overbought. So, although there may be some early upside next week, I would watch for a quick retracement to the low to mid $8. Keep an eye on the uptrend line.

1 Like
Pilbara Conglomerate - What’s coming next?
In this post, I’ve made a few comparisons that show volatility over different time periods for a few of the the many conglomerate plays; mostly from an article CHG posted some time time ago titled “Conglomerate Gold in the Pilabra: A Brief History and Next Steps.”
When looking at different time periods on charts, each time period has an ever-changing reference point as time moves forward.
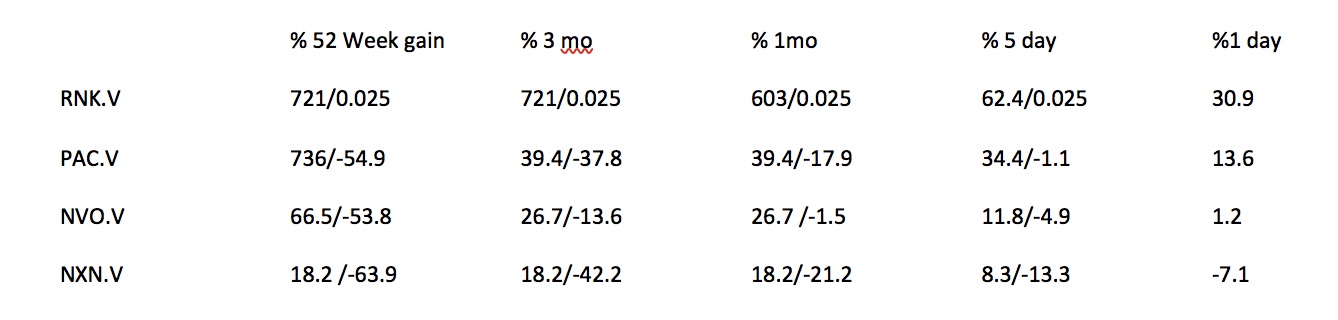
The Pilbara Conglomerate group is quite interesting in this respect. Originally on Aug 1 (post 788), I only showed the % change referenced from the period low. I should have also included the % change from the period high, since as a different reference point is chosen within the time frame a significantly different perspective can be appreciated. Below I show the Canadian traded companies as of Friday, Sept. 21.
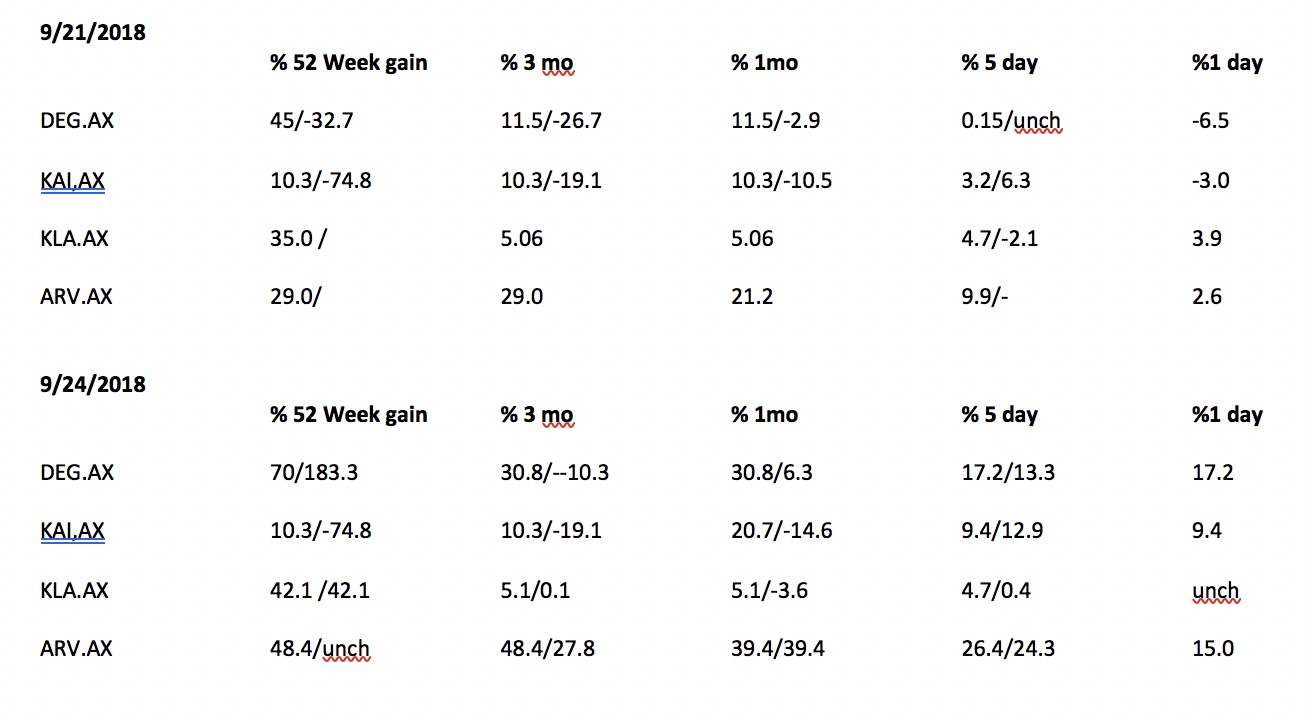
The ASX exchange companies are presently trading as I post and are changing rapidly. Artemis Resources is up 12.5% from Friday’s close with a volume over 1.5M (0.164 USD). I will try to get to the ASX exchange tomorrow after the close. Hopefully, during the next three days of the Denver Gold Forum, how these stocks are trading will become much clearer for those on the forum who are interested. Some of the stocks are very fast paced movers, others … not so much.
note: %Gain or %Loss show below is computed from the period Low & period High (designated below as “gain or loss from period low/ gain or loss from period high”)
Post edited after Australian close by me - added ASX stocks FYI only (note: I did not complete analysis before market opened Sunday afternoon, I’m posting the partially completed % change as of the close on Friday 9/21/2018 - there are substantial changes over the weekend; tonight’s close is complete for each period as shown with date 9/24/2018 (may anticipate tomorrow’s movement IMO, unless there is news):
Barrick and Randgold to merge:
Artemis up 15% overnight with other Pilbara plays in anticipation of this mornings presentation by Novo in Denver.
1 Like
The gold market is full of headlines today:
RNC extends high grade gold structures by 200m:
https://web.tmxmoney.com/article.php?newsid=7516431920664286&qm_symbol=RNX
I didn’t jump on this one because it’s hard for me to see how this keeps giving in the long term, that is, it seems safer to assume this sort of high grade gold bolders are limited in extent. But there’s no doubt it’s a run away PR train at this point. And there’s no doubt that the $38M announced to date changes the short to mid-term outlook of the company.
Of associated interest, is how does all this headline news affect the gold shares market in general if at all? Let’s see what Novo has to say.
1 Like