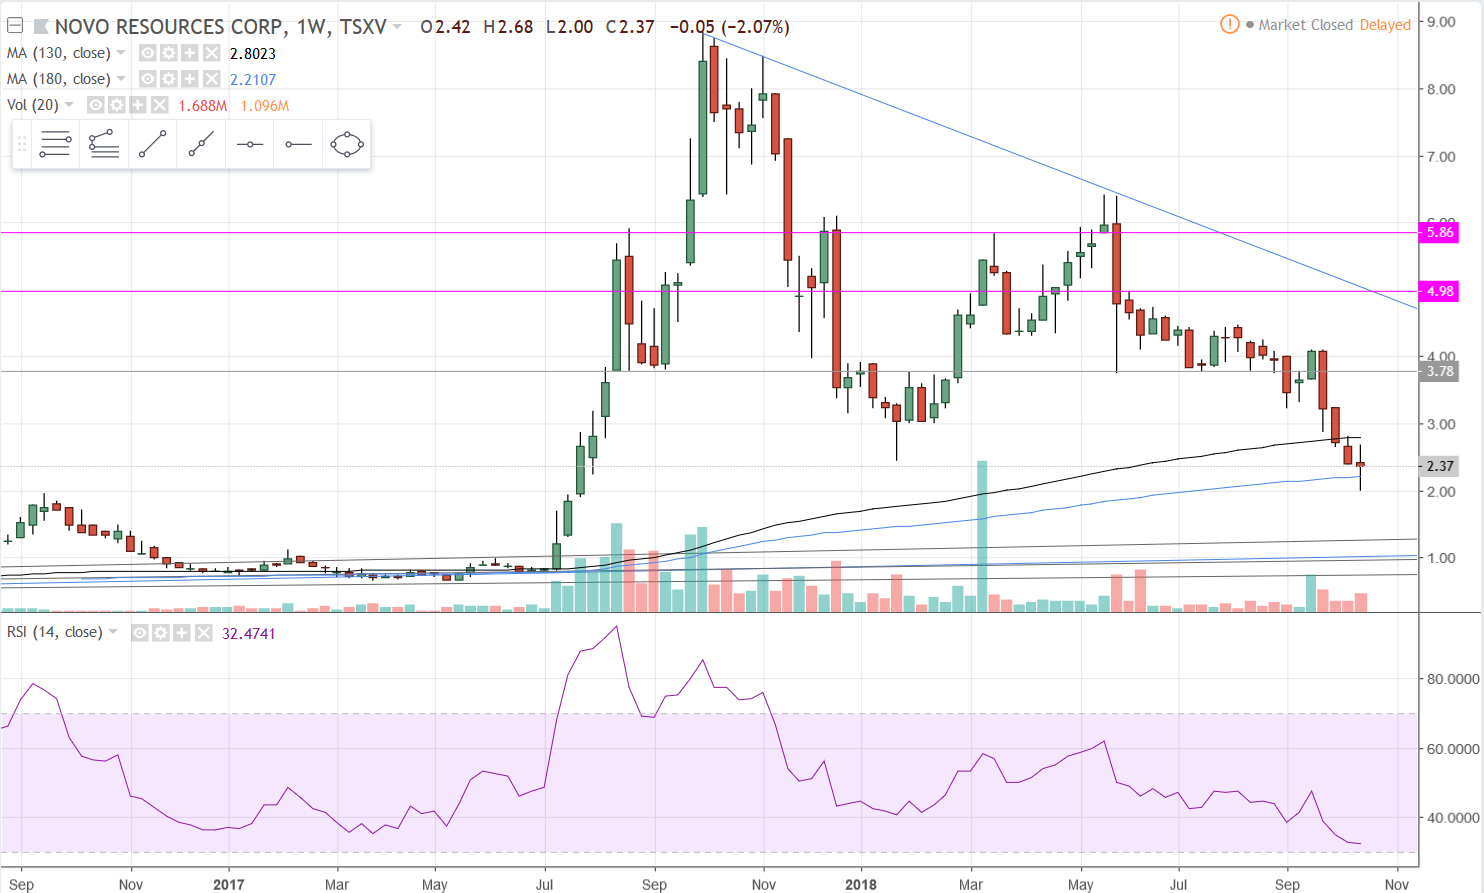
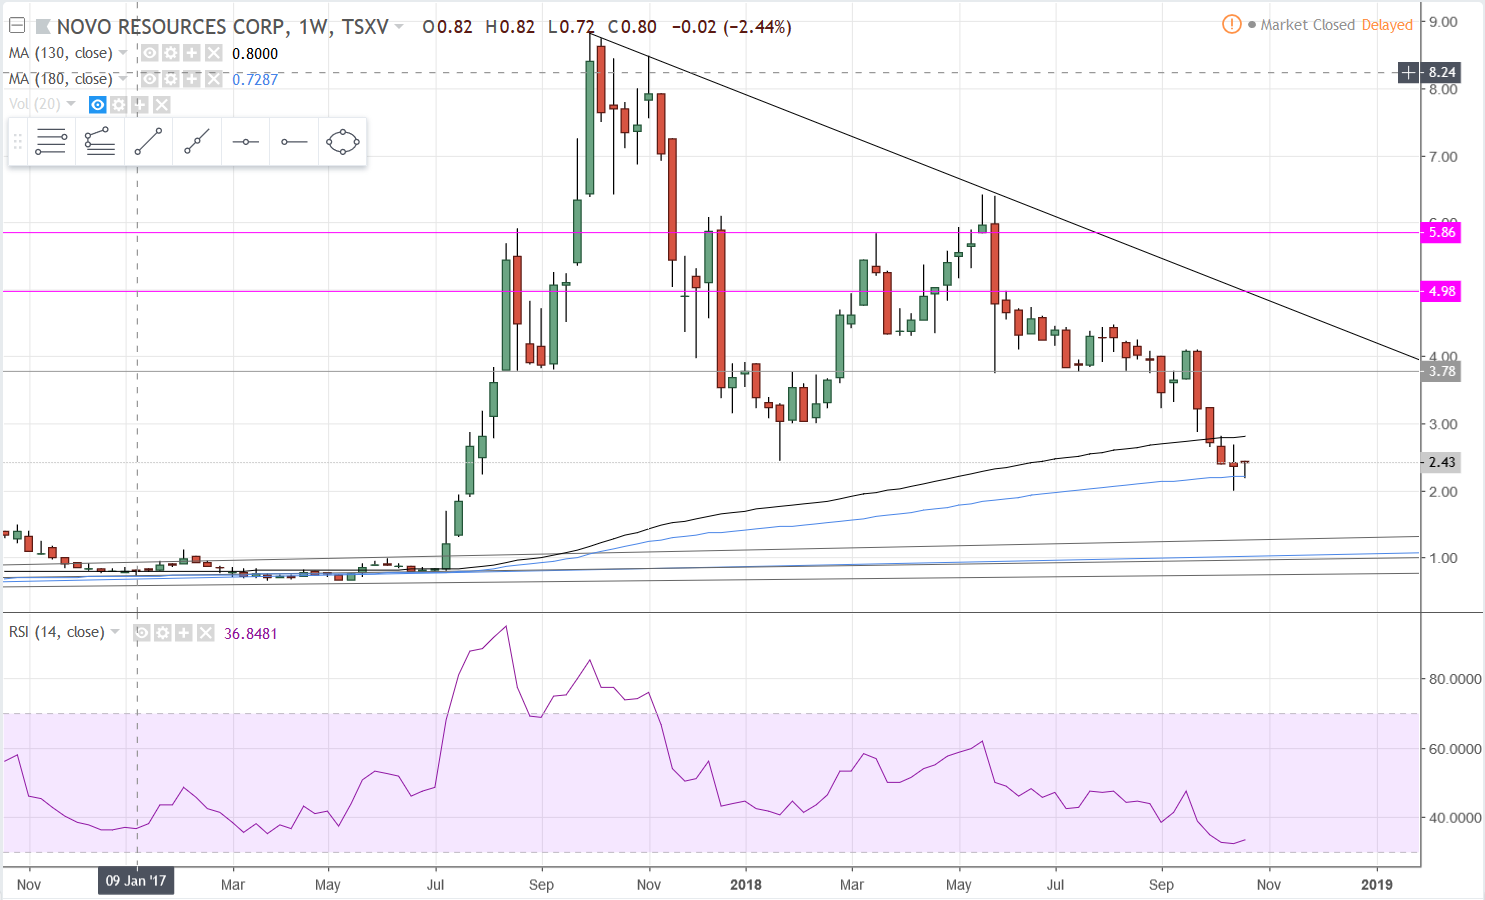
NVO Weekly (The prices are different for the Canadian vs the American stock, but the charts are the same so the analysis applies to both). This so far appears to have found support at the 180 MA on the weekly interval, with resistance at the 130 MA, currently at 2.80.
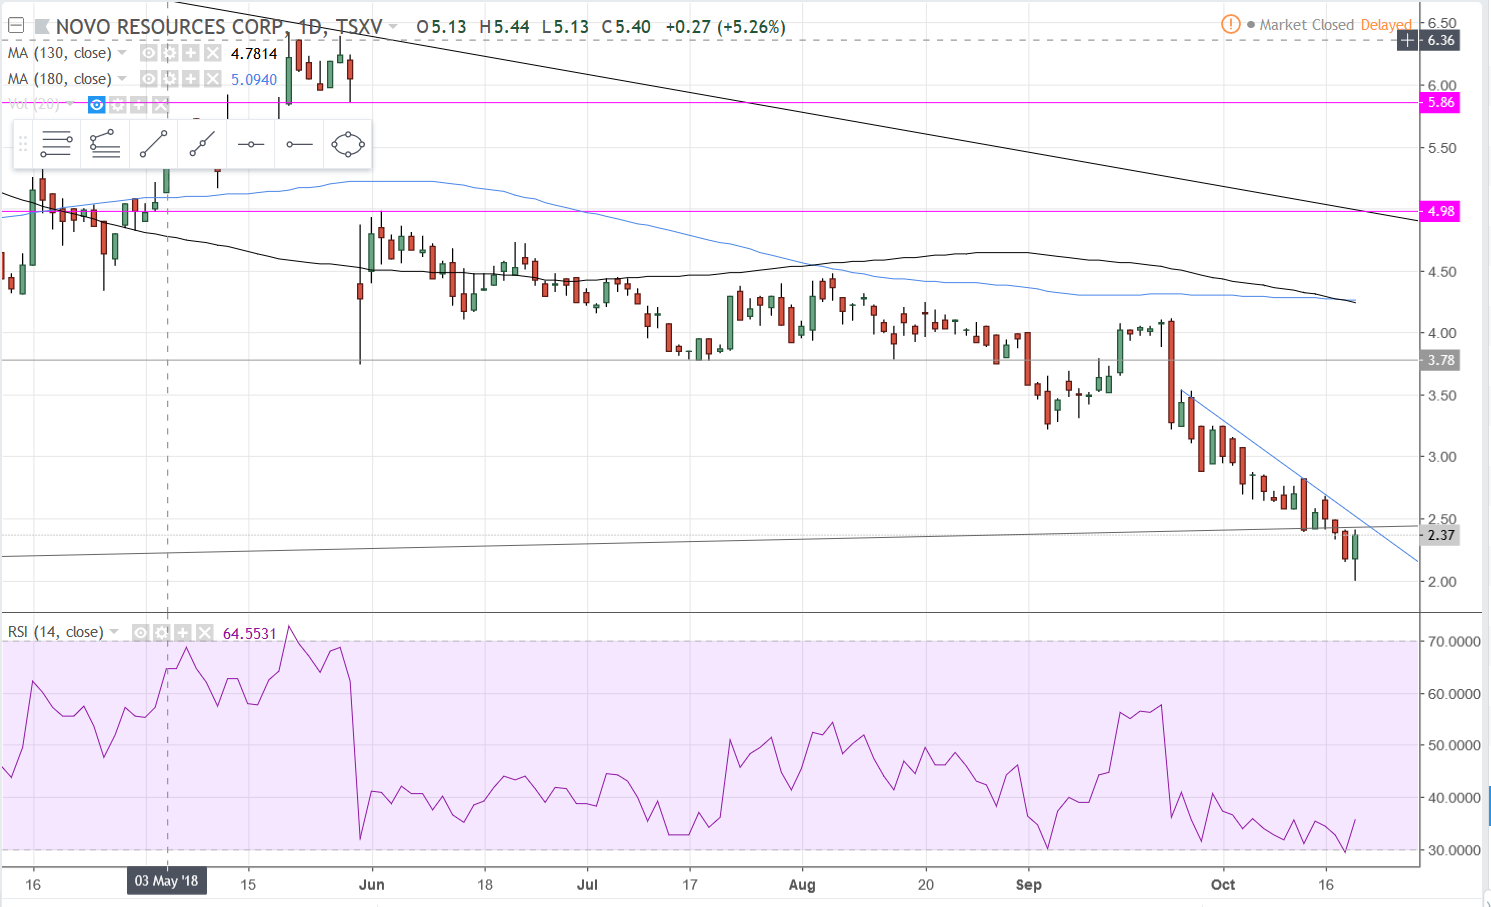
The daily interval chart shows downtrend line resistance at about 2.46. A move above the last swing high of 2.82 would be positive if support is found at that level. The downtrend is still intact, but there are positive signs for a potential reversal. Too soon to tell though.
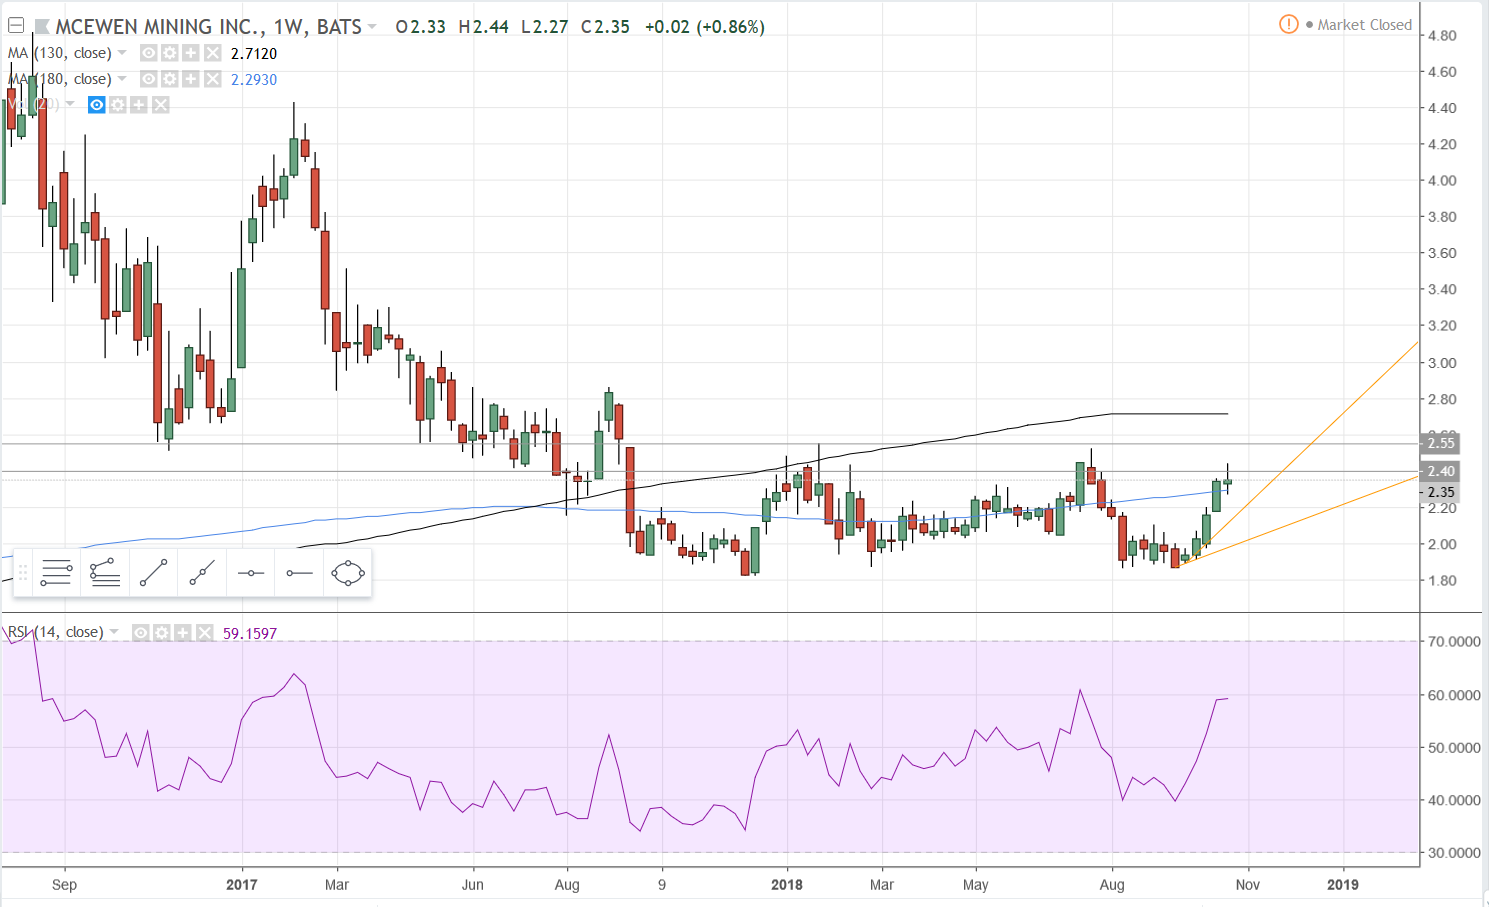
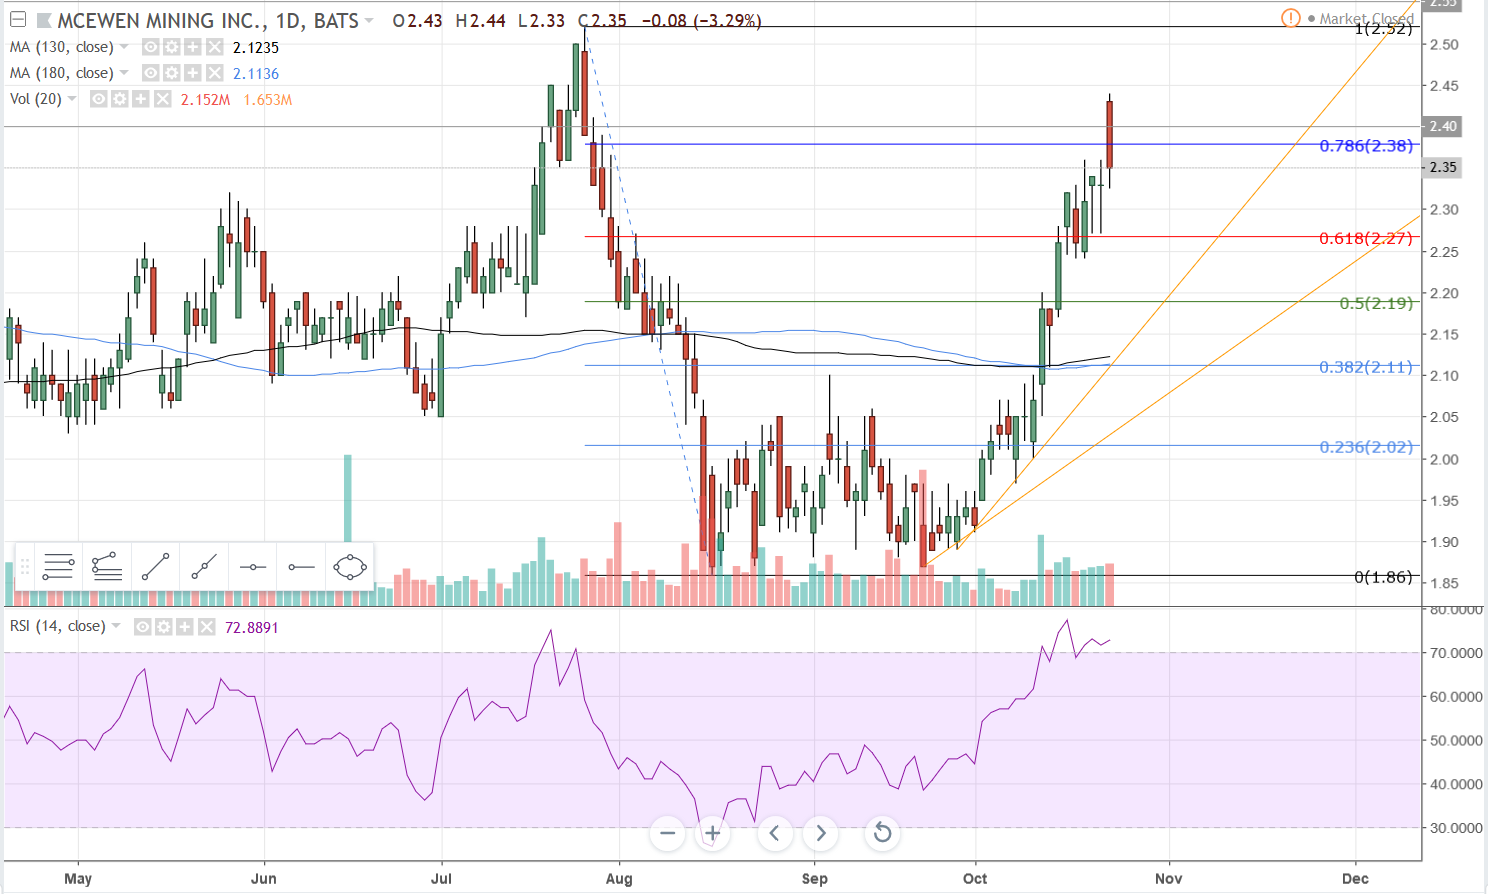
MUX Weekly - The move and weekly close above the 180 MA is a positive. 2.40 is a line created by a gap that occurred in the stock last September which can still act as resistance. 2.52 is the last swing high with 2.55 before that. Watch those areas for resistance, along with the 130 MA at 2.71, although I doubt we see that before a significant pullback.
The daily interval shows a nice move above double resistance with the 130 and 180 right on top of each other. The stock is forming a flag at the 62% retracement level. The chance of a complete retracement back to previous highs is more likely to occur when the 78% level is reached, although I’d be careful because the stock is overbought. Once the highs for this run have been reached, watch for support at the trend lines drawn, Fibonacci retracements, specifically the 50 and 62% levels, and the 130/180 MA’s. If this trend stays strong it will hold a test of the 20 MA which is not on this chart. I own 10k shares with a 1.97 basis. They are in an investment account and I intend to hold them long term, but if I were trading them I would definitely be looking to sell, but more than likely would have sold at least to take out my basis on Thurs or Friday last week.
…If the the downtrend line resistance on the daily interval is broken, as is indicated on the following chart although it’s about as close as it can get. Volume is not impressive if a bottom is being formed here.
So far this week MUX is holding the 180 MA support, but also so far this week it is rejecting the 2.40’s which you can see has been solid resistance all year with only minor breaches. For the long term perspective, when MUX gets above the 2.40 - 2.55 range and makes support out of it we’ll be very happy.
The daily interval chart is overbought, and today’s push higher was sold off quite aggressively. I fully expect the stock to pull back from here. MUX hit a higher price but not a higher RSI reading, which is divergence, so I’m expecting a pullback from here. MUX more or less mimick’s the movement of gold and I’ll post three intervals of gold charts next that all tell me that gold is either ready to pull back from this run now, or get to around 1270 and then pull back. (How far I don’t know, but I expect a retracement to begin this week if certain resistance isn’t broken through promptly, possibly as soon as tomorrow).
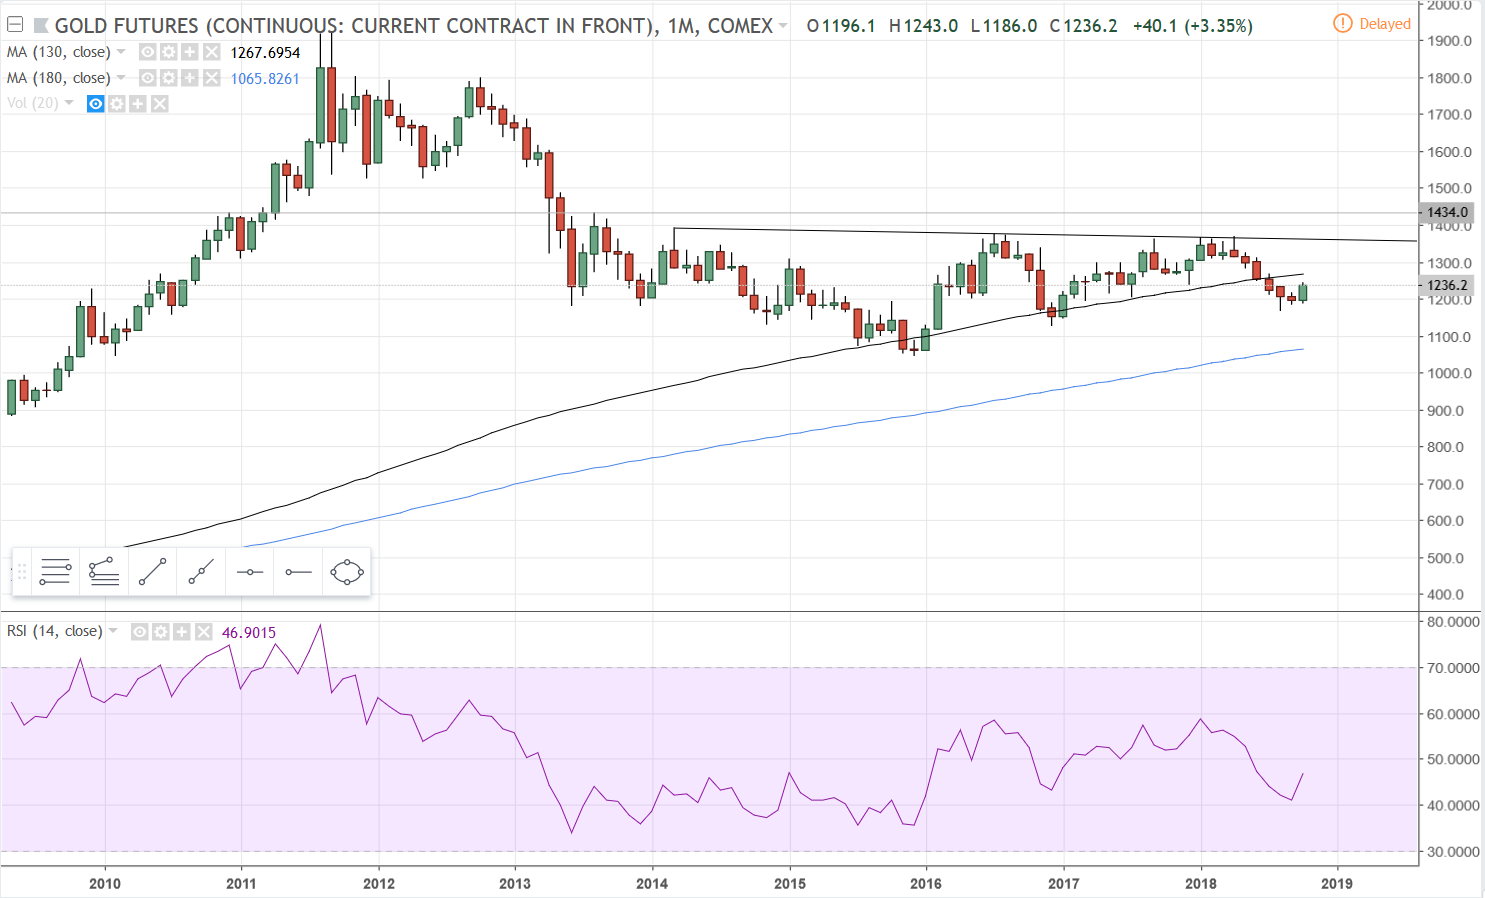
In July gold lost its support from the 130 MA and fell further from there. It has this month been moving up to test the resistance of that MA. Currently, that resistance is around 1267.70. Pay attention to what it does if it gets that high on this run. (If you scroll up to my last gold postings I was discussing the potential of an adam & eve bottom formation with a target of 1274 if there was a breakout. My error was that I was looking at the daily chart and not the weekly. The formation is playing out, but not yet to the target. This post will continue to show the resistance being faced before that target can be hit).
On the weekly interval, gold has hit the bottom of the 180 MA, pushed up through, and thus far has fallen back below it. If the week closes above it, watch this 130 MA, at 1270, which is aligned well with the monthly 130.
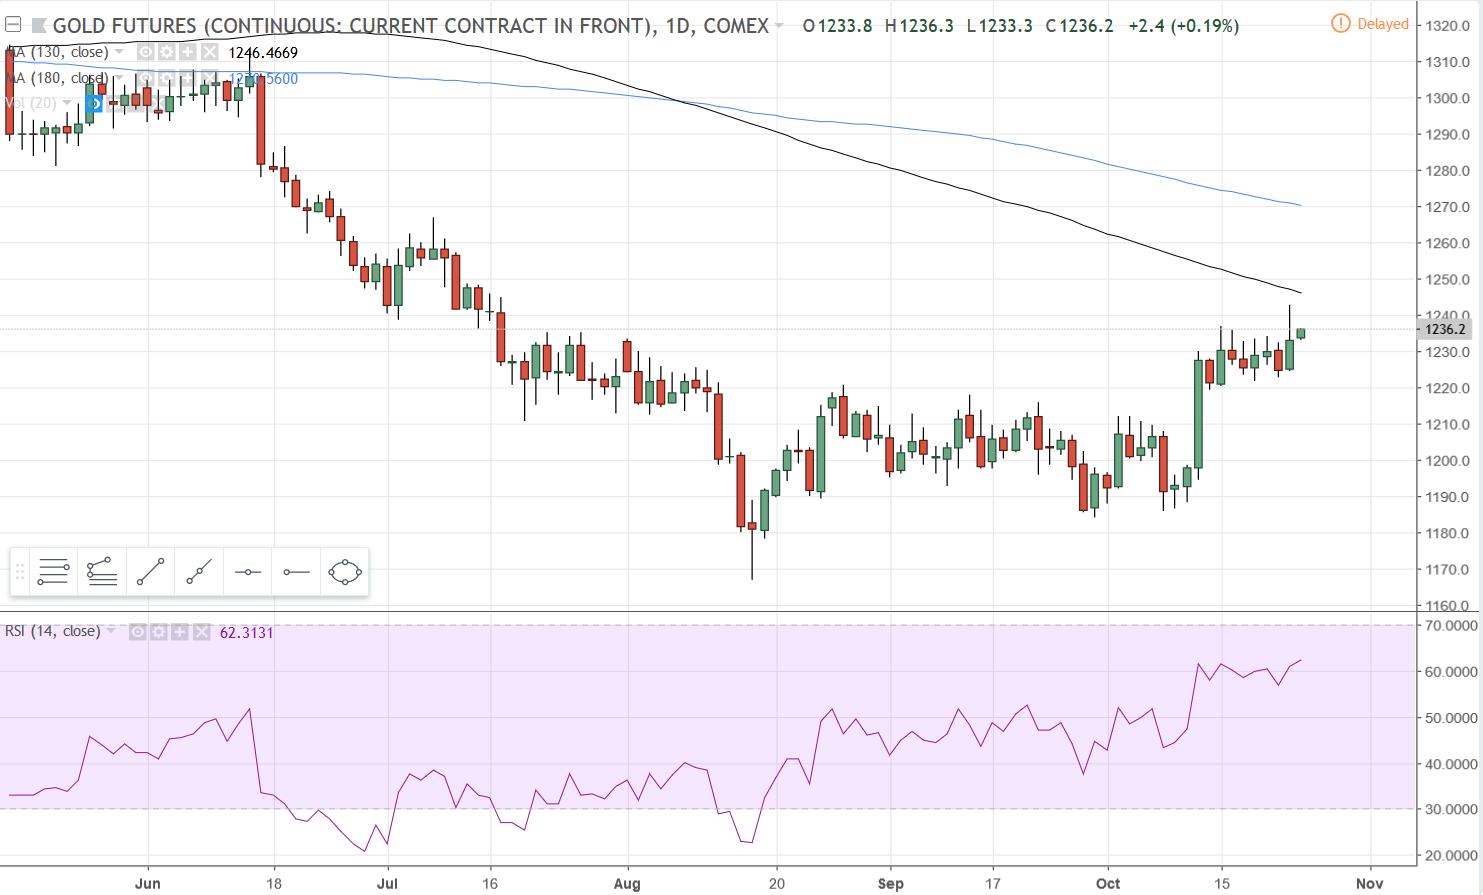
On the daily interval, gold came very close to tagging the 130 MA and sold off around half of that move by the end of the day. So far the night session has regained some of that drop. If gold continues higher the 180 is sitting there lined up nicely with the 130 MA’s on the previous charts at 1270.
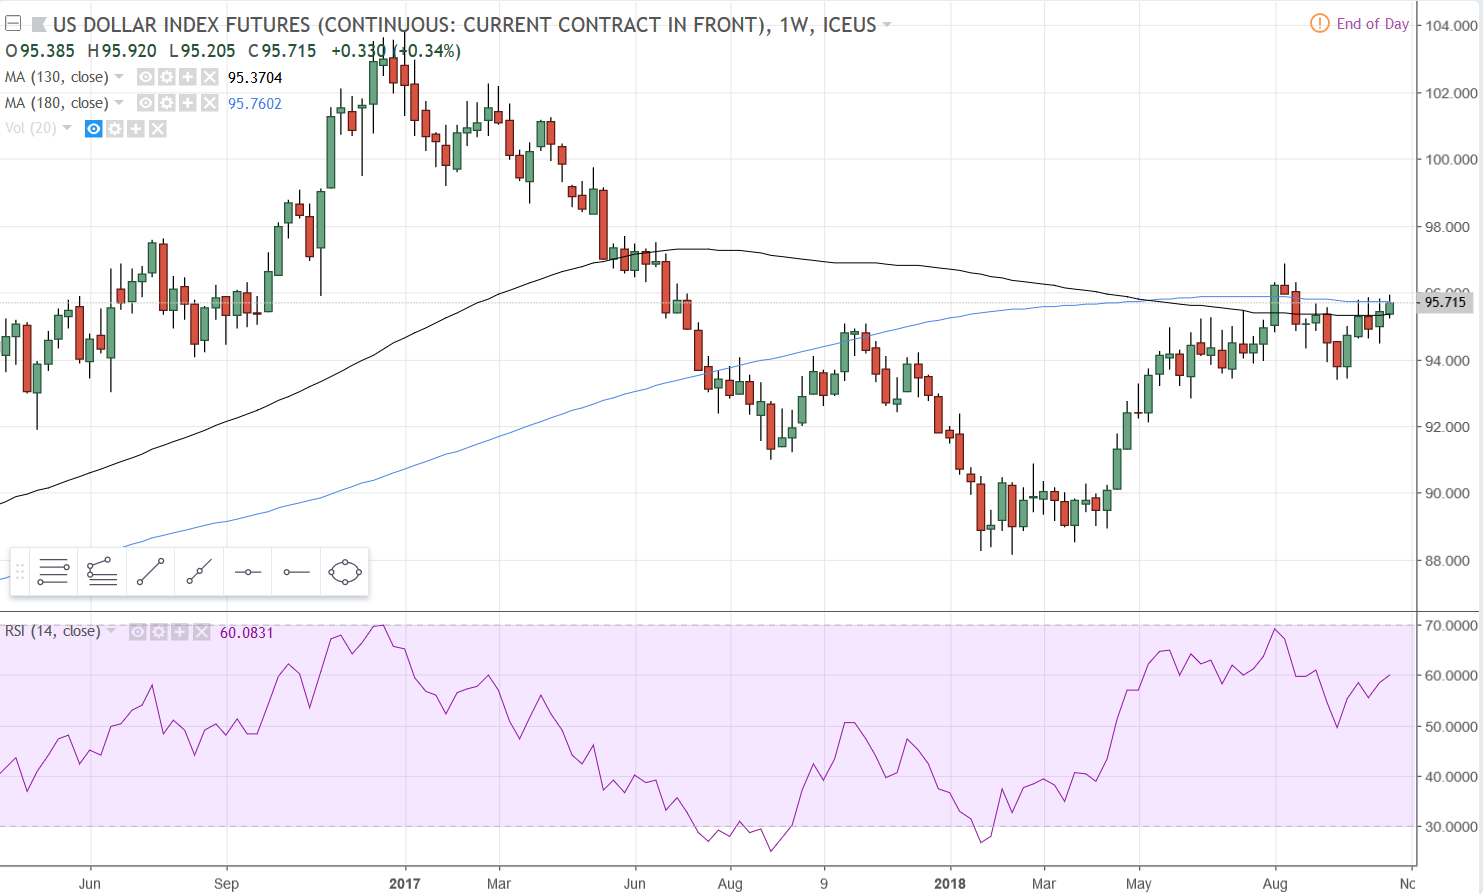
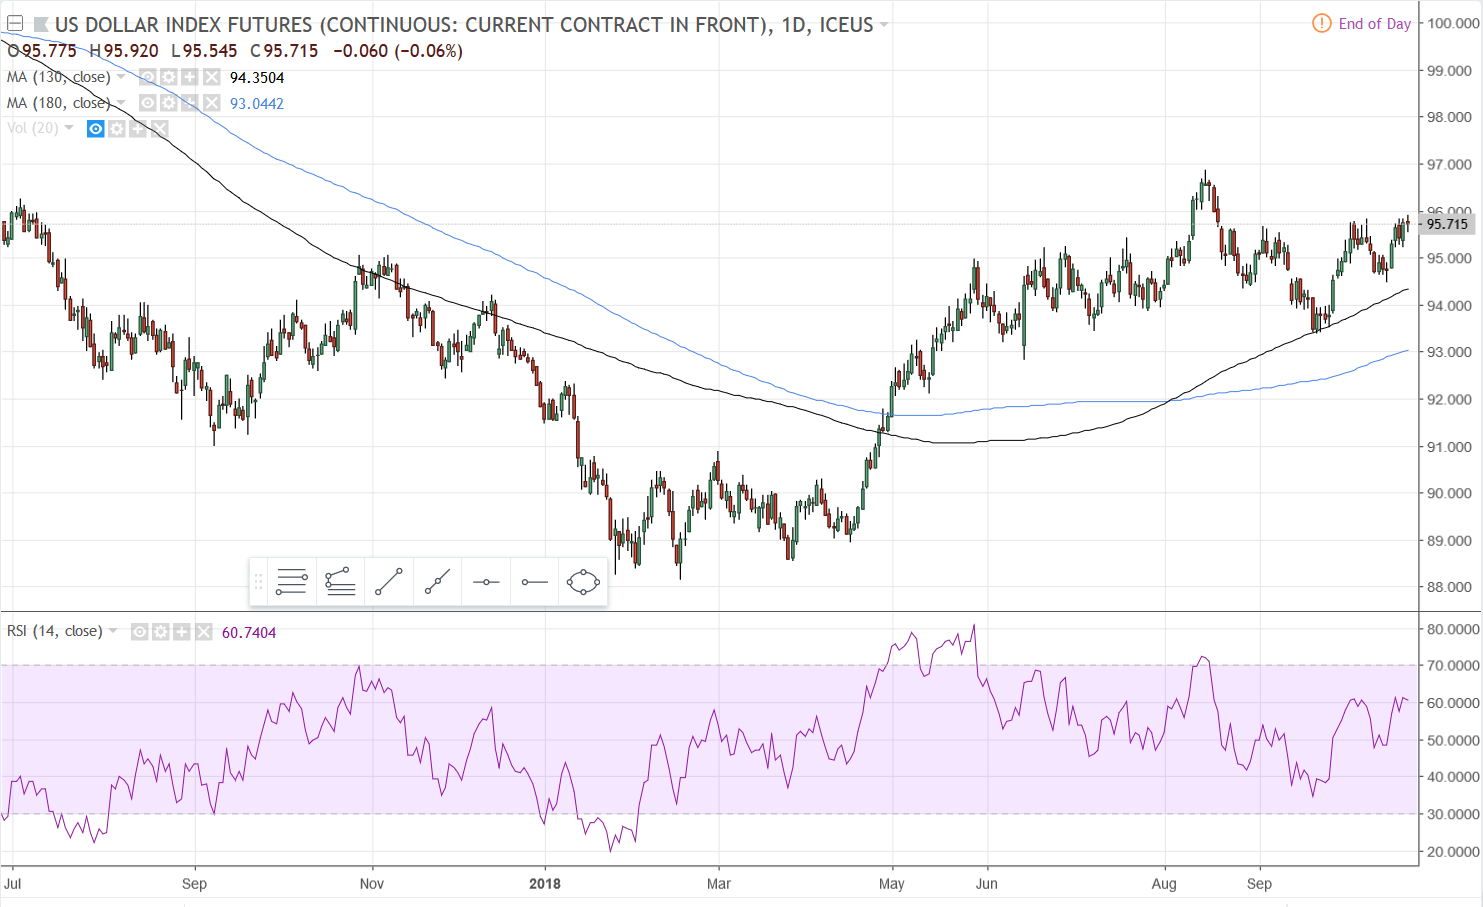
The dollar is again bumping up against the weekly 180 MA and this week so far has found support above the 130 MA after finally getting a close above it last week. There could be a bullish pennant formation here, but one chart doesn’t tell the whole story.
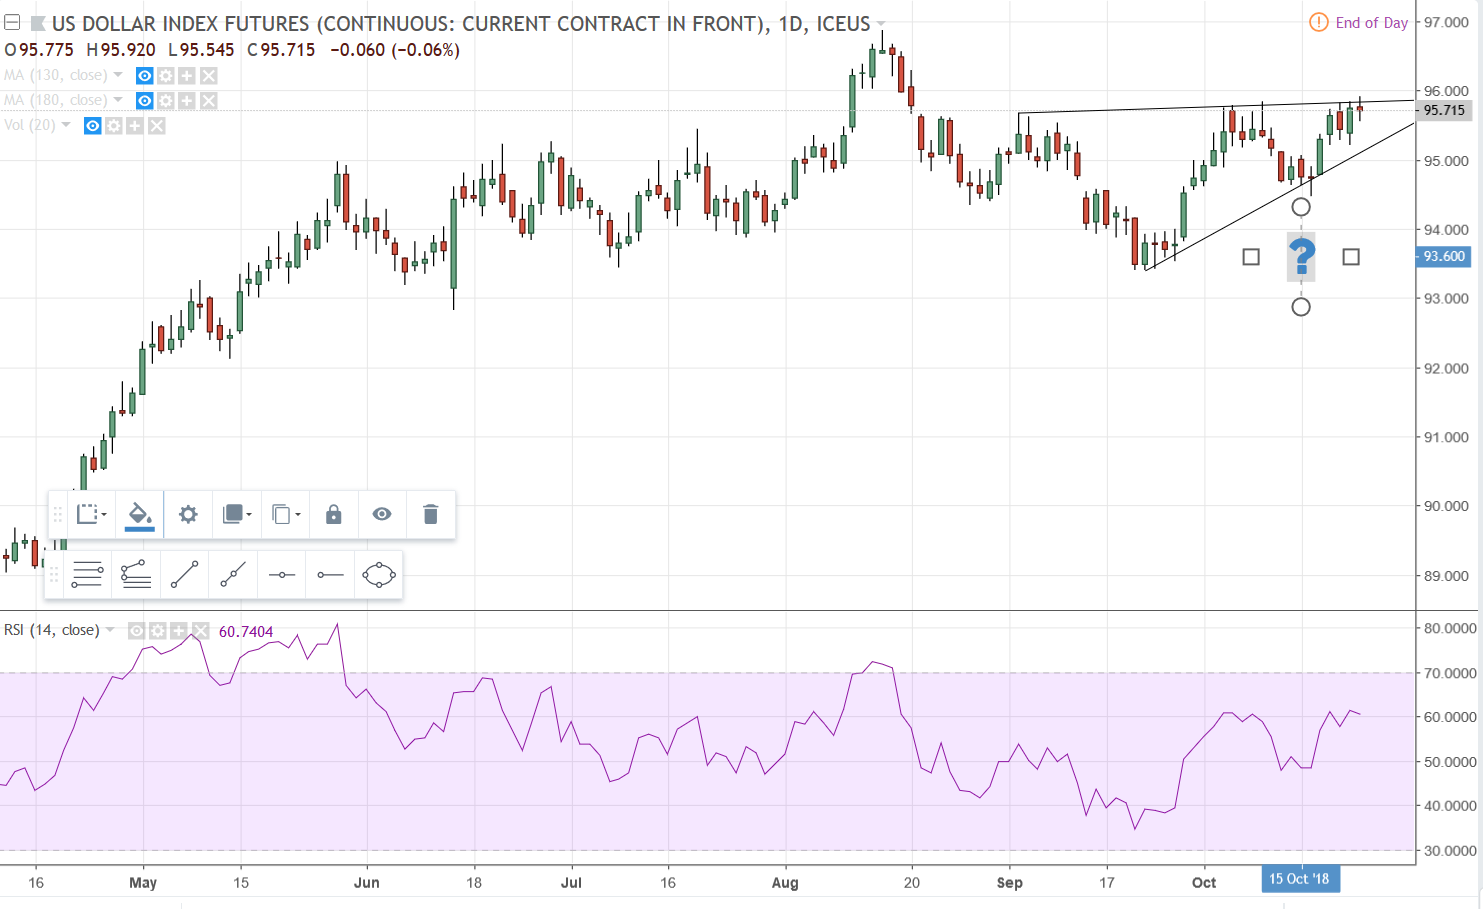
The daily interval shows how my two favorite MA’s were resistance during the downtrend and have now become support during the uptrend. The first two charts show the dollar getting squeezed between up-trending support and resistance that is just beginning to turn downward. And there’s more…
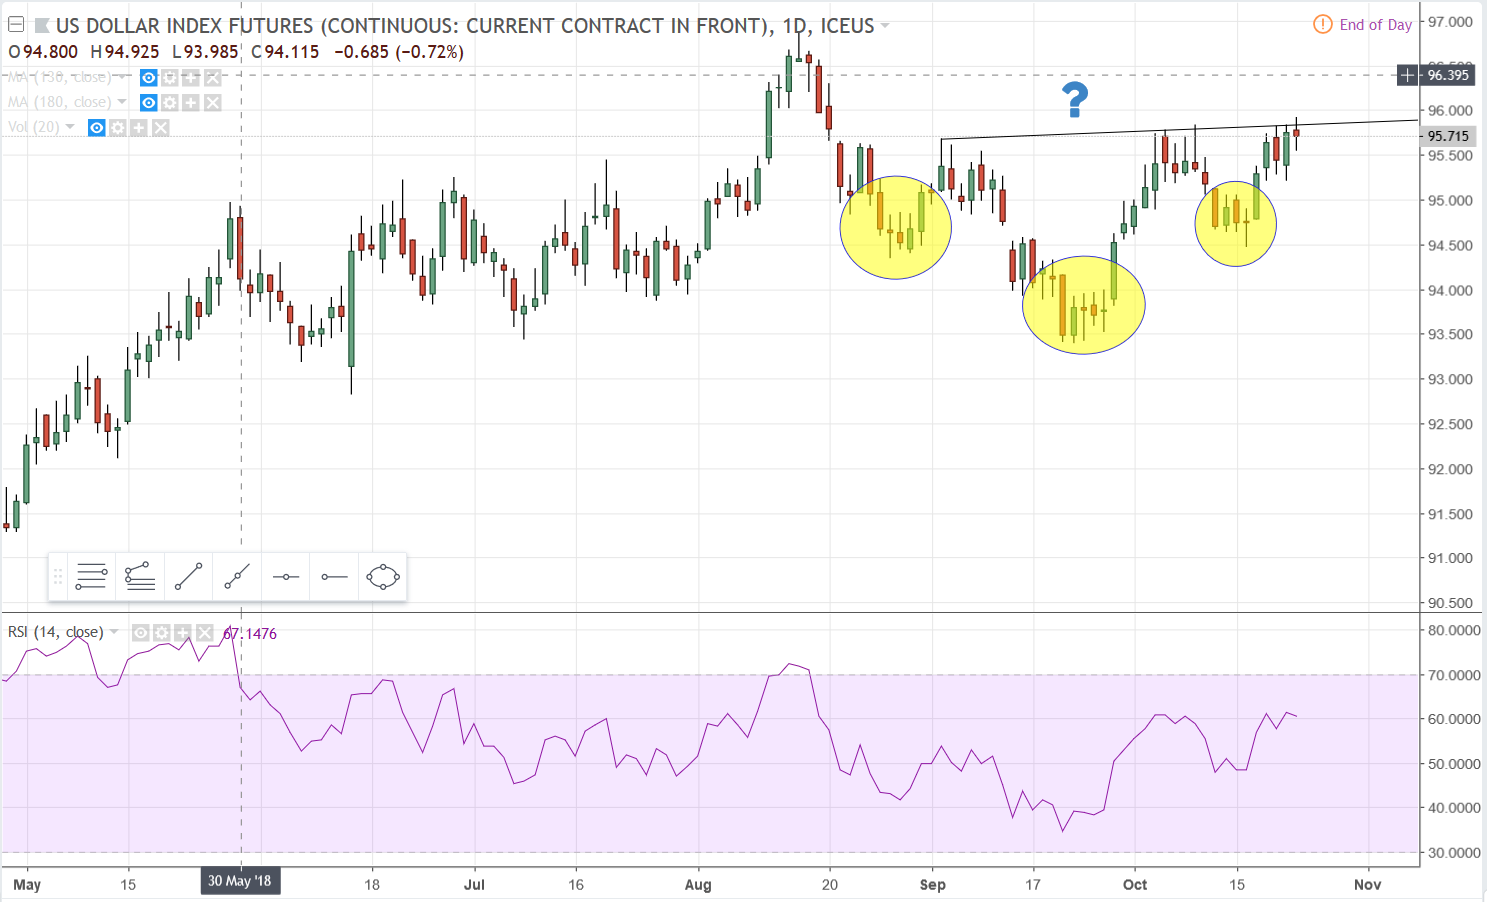
There’s a problem though because this is the same chart, only it outlines a very symmetrical inverted head & shoulders formation which is bullish. If this formation plays out we’re looking at a target of around 98.50.
No negative news. ARTTF is one that I feel has mitigated some of the speculation by their processing facility. I think it’s a buying opportunity, but then again, i thought .124 was a great price. I hate seeing profits go. Same with MUX and SAND, but those are long term holds.
all miners are taking a beating today market up about 500 pts. yesterday the market was down 600 pts and most miners were down again. this totally unstable market. MUX as this moment 7.58 down, been a long time since I seen it drop so much in a day.
Excellent commentary and clarification of the bulk samples report by Quinton Hennigh. The brief take away was an explanation that the samples were taken above and below the gold bearing conglomerates. This was necessary to define the boundaries and attain a representative estimate of grade, distribution and continuity of the units sampled. This also explains why some of the sampling in the report was barren. Much larger bulk sampling will be required with the goal to attain mining leases. When comparing gold contained in the Witwatersrand region of South Africa, Hennigh stated the gold found in the Fortescue formations in the Karratha region was different. A rough comparison could be made based on gold content per square kilometer which turned out to be quite promising, as well as remarkable.
Although grades in the Witwatersrand region averaged higher, the mineable thickness was only approximately 1.1 meter. The lower grade of the sampled Comet Well project had an aggregate thickness of approximately 2.5-3.5 meters. Hennigh stated based on preliminary indications this could yield comparable values to the Witwatersrand as much as 20 tons/AU per sq Kilometer! This is still early in the very preliminary stages of the prospective Comet Well/Purdy’s Reward projects. My summary may not be entirely accurate, but this was my first impression of what was stated. The next step is to attain larger bulk samples over a large area.
Makes sense - very matter-of-fact. The market has over-punished Novo due to delays in getting the results and less bullish comments by Sprott, QH et al about the impending results and the change in focus to the newly-acquired Engina project area. The company has done a lot to acquire land tenements in Pilbara and set themselves up to be a major player if the Pilbara deposits turn out to be economic, but to me the market is saying, “OK, enough hype, let’s get something concrete going here”. This batch of results, even though it was justified, didn’t exactly wow impatient shareholders and triggered the further sell-off. Not just on Novo, but De Grey, Pacton et al as well.
I hope the bottom is in here, though I don’t know what catalysts within the company are in the near-term to cause a bonafide change in direction. I’d like to continue to see results of gold finds from other Pilbara companies.