The only other thing to add to what HR has to say, I saw on another thread that a number of gold producers that have gone through a reverse recently have fared exceptionally well after the consolidation. Not sure why but presumably because the share price gets above the limit that various investment funds are allowed to start investing in. Since KRR is more or less done with issuing shares besides some existing warrants/options, I’m not overly concerned about the reverse. Rather, I might stay around till after the reverse to see if a little bounce is realized. Hope that helps.
« Impact: Mildly Positive
Karora Resources announced that it has sold its remaining 28% interest
in the Dumont nickel project in Quebec to Waterton Global Resource
Management Inc. (currently 72%-ownership of Dumont) for total
consideration of up to $48M. In our view, Karora was not receiving
value from the market for its interest in Dumont, and its sale provides
the company with cash in the bank to spend on its Beta Hunt and
Higginsville operations. Steady operating results coupled with the
expected increase in exploration news should help the stock continue
to re-rate and close the valuation gap with peers.
Highlights:
• Transaction details. In exchange for its 28% interest in Dumont,
Karora will receive $10.7M in cash on closing, comprising $7.4M from
Waterton for its interest and a $3.3M refund of Karora’s share of the
cash held in the Dumont JV. Karora will also have the right to receive
15% of the net proceeds from a future Dumont sale or monetization
event, up to a maximum of an additional $40.2M. We also note that
the transaction is expected to close by the end of July, at which time
Waterton will assume management and operation of Dumont.
• Unlocking value from Dumont. Our prior NAV estimates ascribed an
in-situ value of $167M (~$0.24/sh) for Dumont; however, we believe
the market was ascribing this asset zero value in Karora’s share. This
sale converts the Dumont interest into cash that can used for
exploration and operating improvement in Australia, activities that
we expect to have a positive impact on the share price. As such, while
the sale reduces our NAVPS estimate to $1.41/sh (was $1.64/sh), our
one-year forward NTM EBITDA based target of C$1.30, remains
unchanged.
• Exploration news flow key to continued re-rating. With royalties
reduced ~10% on the company’s operations in Western Australia, we
expect to see increased exploration news from Beta Hunt and
Higginsville. At Higginsville, we anticipate steady positive news flow
to support an updated resource and LOM plan (H2/20). At Beta Hunt,
exploration could confirm higher grade zones in the “High-Grade
Contact Zone” that could increase the overall grade of the mine. We
believe continued exploration success may justify a mill expansion at
Higginsville, and plan to adjust our estimates with continued success.
Valuation:
We are maintaining our BUY rating and target of C$1.30/sh. Our target
is based on 6.0x our one-year forward NTM EBITDA estimate of C$145.6M
(unchanged). We also note that the company announced that it intends
to conduct a 1:4.5 share consolidation within the next 7-14 days. Karora
trades at a discount to peers at 3.3x 2021E EBITDA and 0.5x NAV (peers at
5.9x and 1.1x, respectively). Upcoming catalysts include: 1) Q2/20
Financial results (Q3/20), 2) Exploration updates (ongoing) and 3)
Updated Higginsville resource (H2/20). »
Thanks for the feed back everything makes sense what you gents are saying, This is one company I am excited about as I believe there is a tone of potential here. This would be the first reverse split I could come away with a smile.
I found one reference in an interview with their CEO from another board. “He was all fired up in the interview. He mentioned that he had 15 institutional investors lined up and waiting (some of them) to buy in (once the price meets their criteria)”. The rather odd 4.5 to 1 share consolidation ratio suggests that they be targeting a specific price to gather in this investment dollars that are waiting on the sidelines.
That would be nice, I am looking at adding to my position as I’ve done well thus fare with an average cost of .55 but not sure whether to do it before or after split. So am I correct that at the current share price say at .80 we should be $3.50 after the reverse split depending on what price they will use of course.
I think you should hope for some sort of large scale market correction and then jump in independent of the reverse. I have a very low cost basis only because I got most my shares during the pandemic plunge knowing that KRR would recover since its financial position was improving so rapidly. Going forward with the nickel deal closing in about a week(another $10 M in cash), the jump in gold prices (more cash), the Beta Hunt now back in full swing(think big gold nuggets and more cash), ore sorters coming that should allow them to increase production(more cash),I think KRR’s cash position may nearly double by the next quarter. Perhaps some sort of dollar cost average buying strategy makes the most sense?
Welcome to the Novo party train!! Fyi…I think Aretemis is responsible for the recent minor downturn. Their Novo shares just recently became tradable I think.
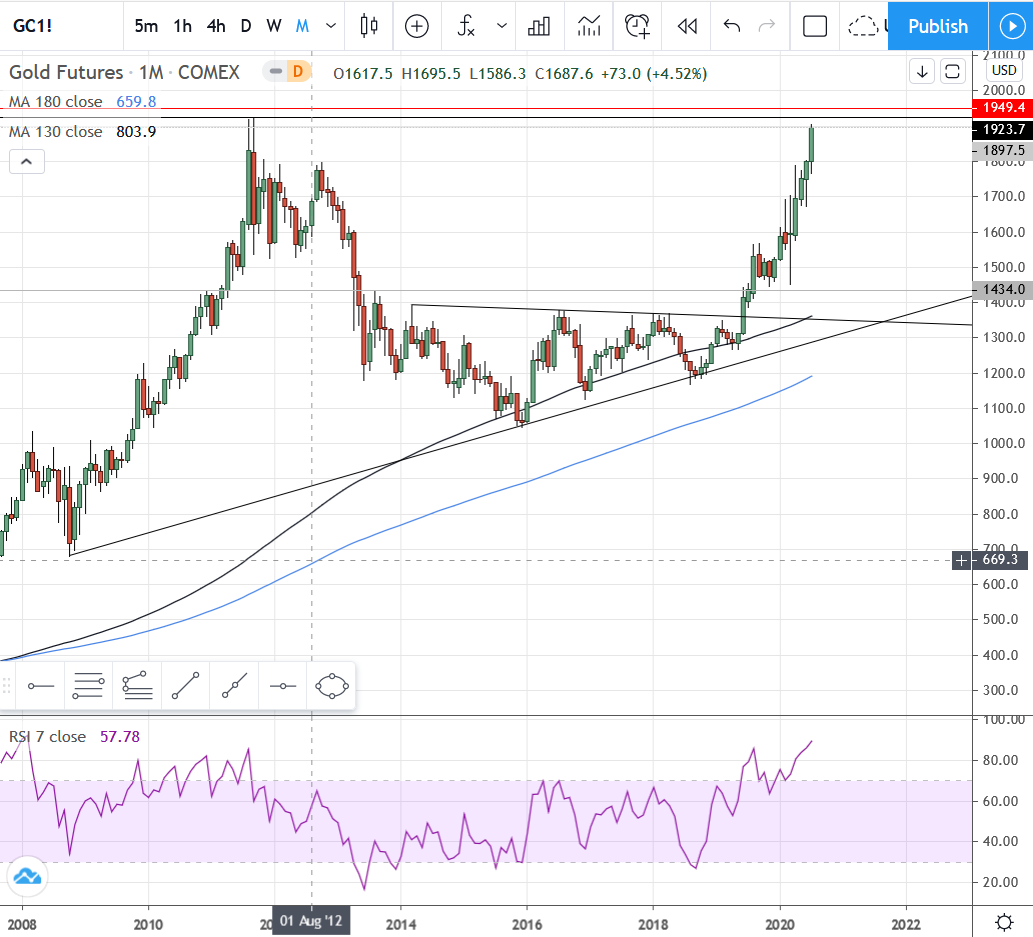
The first chart is the monthly interval for gold. This is simply to show where gold is at in relation to its all-time high in 2011. It’s currently at 1897.5 after hitting just under 1905 last week. The previous high according to this data was 1923.7, represented by the black line just above last week’s candle. The red line just above that at 1949.4 is the target price of the inverted head and shoulders formation you’ll see on the next daily interval chart.
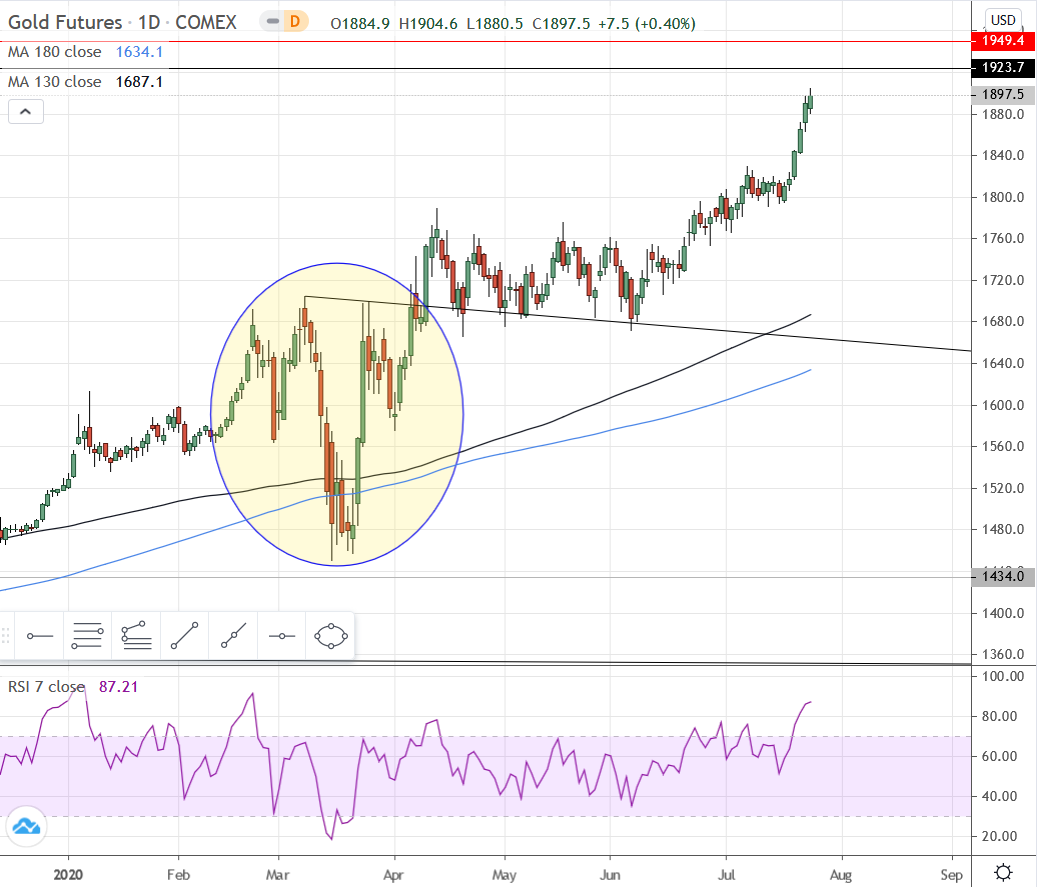
At least one good thing has come out of the Balonavirus we’ve all been enjoying so much, and that is this lovely inverted head and shoulders bottom formation in gold, highlighted for your viewing pleasure. Charting logic dictates that gold is in a long-term overbought state, and needs a pullback/consolidation before fulfilling its 1949.4 destiny, (although I thought that about silver at 20.84 and it defied me all the way to 23.67, so I guess we’ll see how anxious gold is to hit the target starting tomorrow evening).
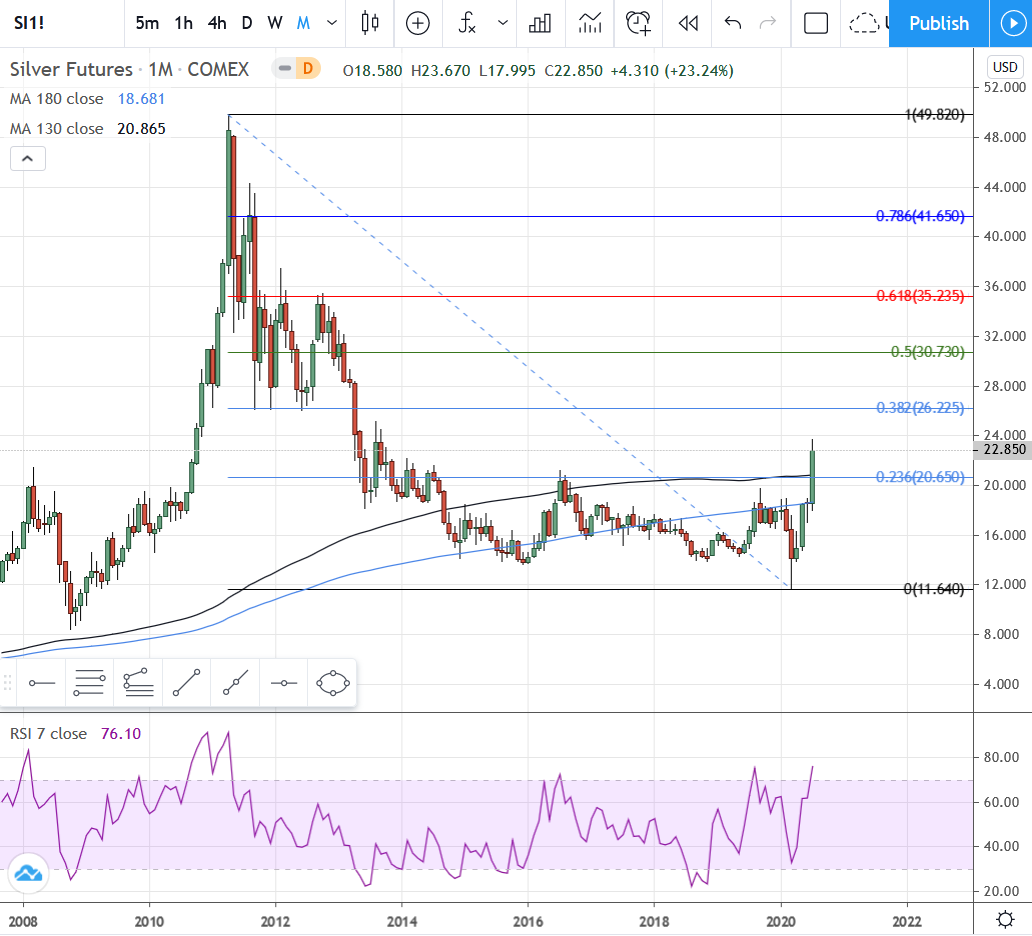
When you compare this monthly interval chart for silver with that of gold above, you can see that silver had no problem following gold down from the all-time highs they hit together, but when gold broke above its 5-year resistance level in mid-2019, silver for whatever reason did not make that move. Where gold has nearly retraced its entire drop, silver has only retraced a quarter of it thus far. The 38% retracement level on this chart, at around 26 - 27, is likely to provide some resistance and a level for price consolidation before moving up to the 50% level. Time will tell. Right now silver, like gold, is overbought on the charts, but that might not mean a whole lot in the current state of world affairs.
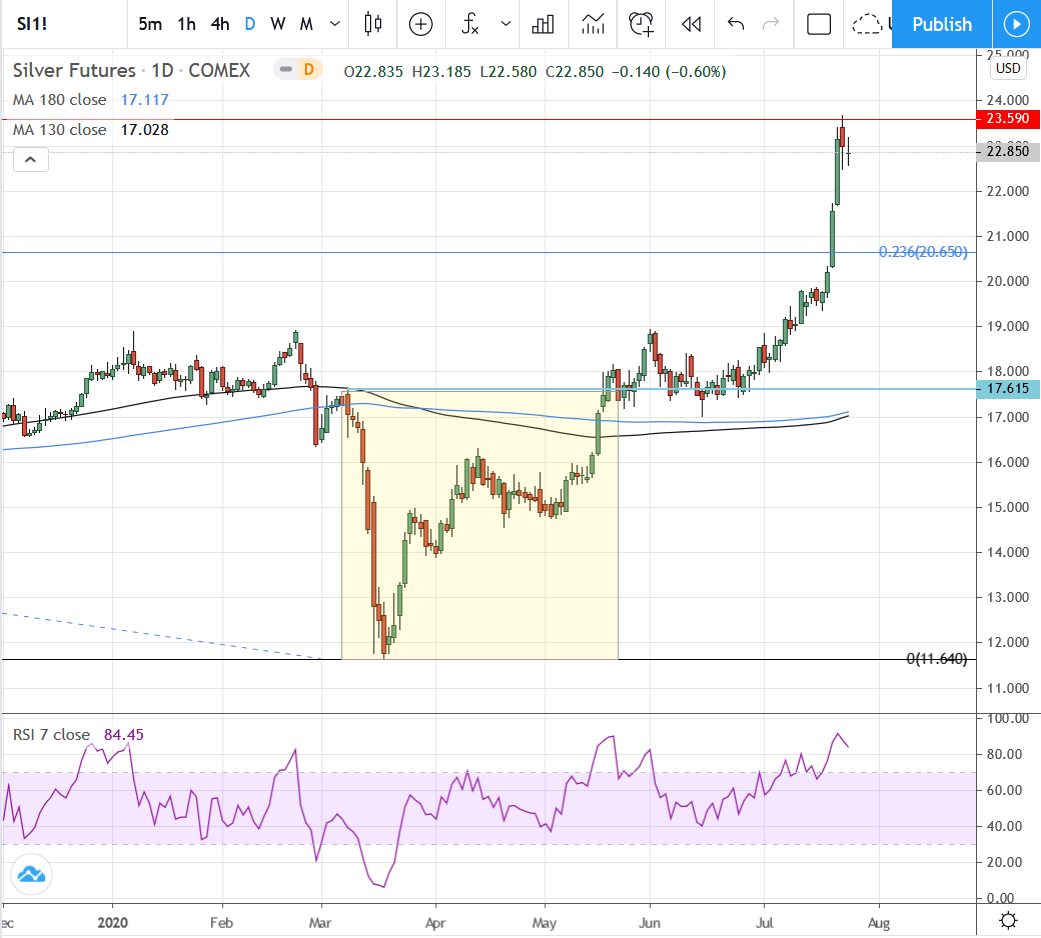
As for the daily chart, while gold chose to use the inverted H&S to escape its doldrums, silver instead opted for an adam & eve bottom formation, highlighted for ease of viewing. Silver has already hit the target price of the formation, but is now forming a flag presumably in preparation for its next push higher. Watch the Fibonacci levels on the above chart for resistance/consolidation areas during silver’s move back to its old high.
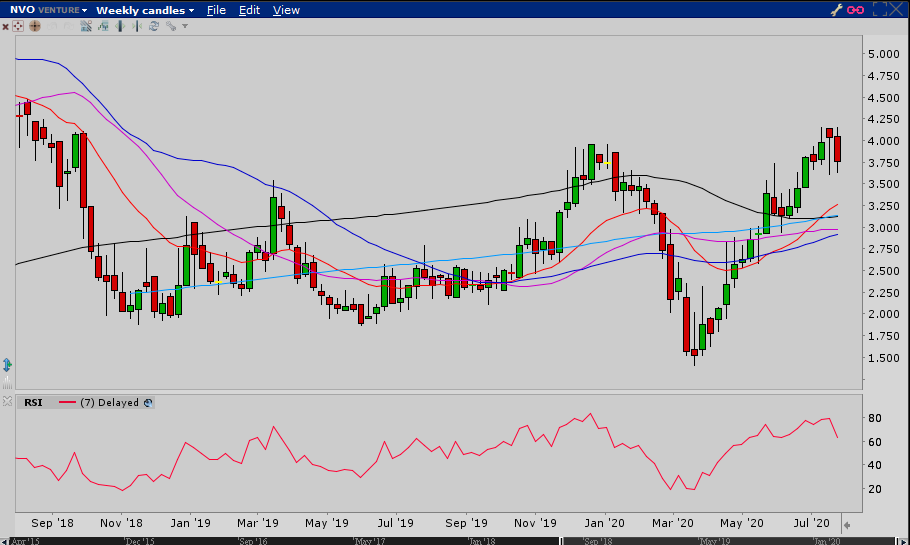
The weekly interval chart shows a complete recovery of the Covid drop, with a bit of retracement starting last week. The RSI shows overbought so perhaps a bit more of a pullback coming. The rise from the 1.41 low hit in March had one pause in June for three weeks after the $3 level was hit. The shortest moving average I use, the 20 EMA which is red, is currently at 3.26. I would appreciate a buying opp there, but it won’t necessarily be hit, as the next charts will show…
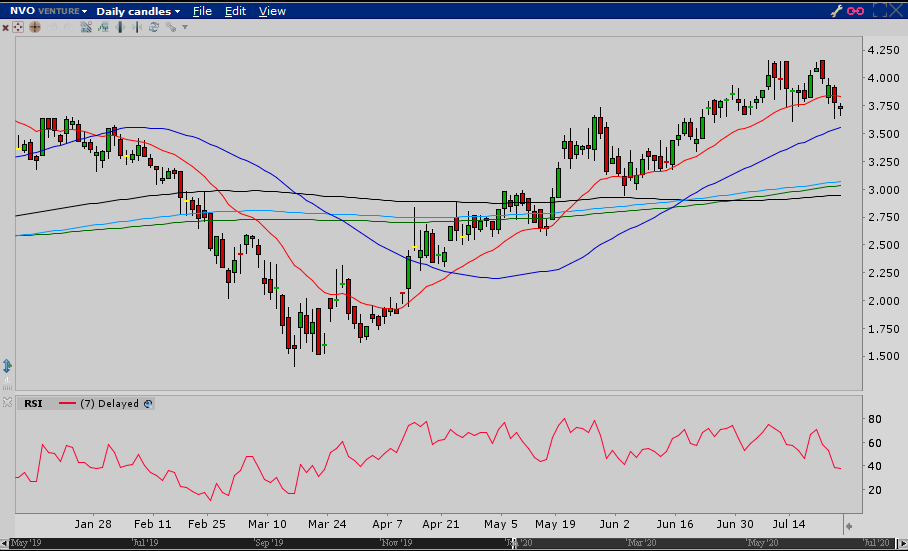
On the daily chart you can see the double bottom that formed mid-March. Once price crossed above the 20 EMA it has essentially held as support the entire ride up above $4, until last Thursday. Now the next moving average support on this chart is the 50 MA (blue) at 3.56. The RSI here is now down below 40, nearing oversold but not necessarily indicating a bottom yet. There’s a lot of MA support in the low $3’s, but at this point I’d be surprised to see 3.25. Last thing to note here is that, looking at the grouping of candles from the beginning of July to now, there is a potential inverted head & shoulders formation. The left shoulder is already formed and last week’s trading has made the left side of what could end up being the head. A move back above $4 this week would further confirm the potential of this formation, OR it could turn out to be an eve & adam formation which are rare, but do occur. Typically either of those formations are seen at bottoms, but they can form during pullbacks in up trends, so I’ll be keeping an eye on this.
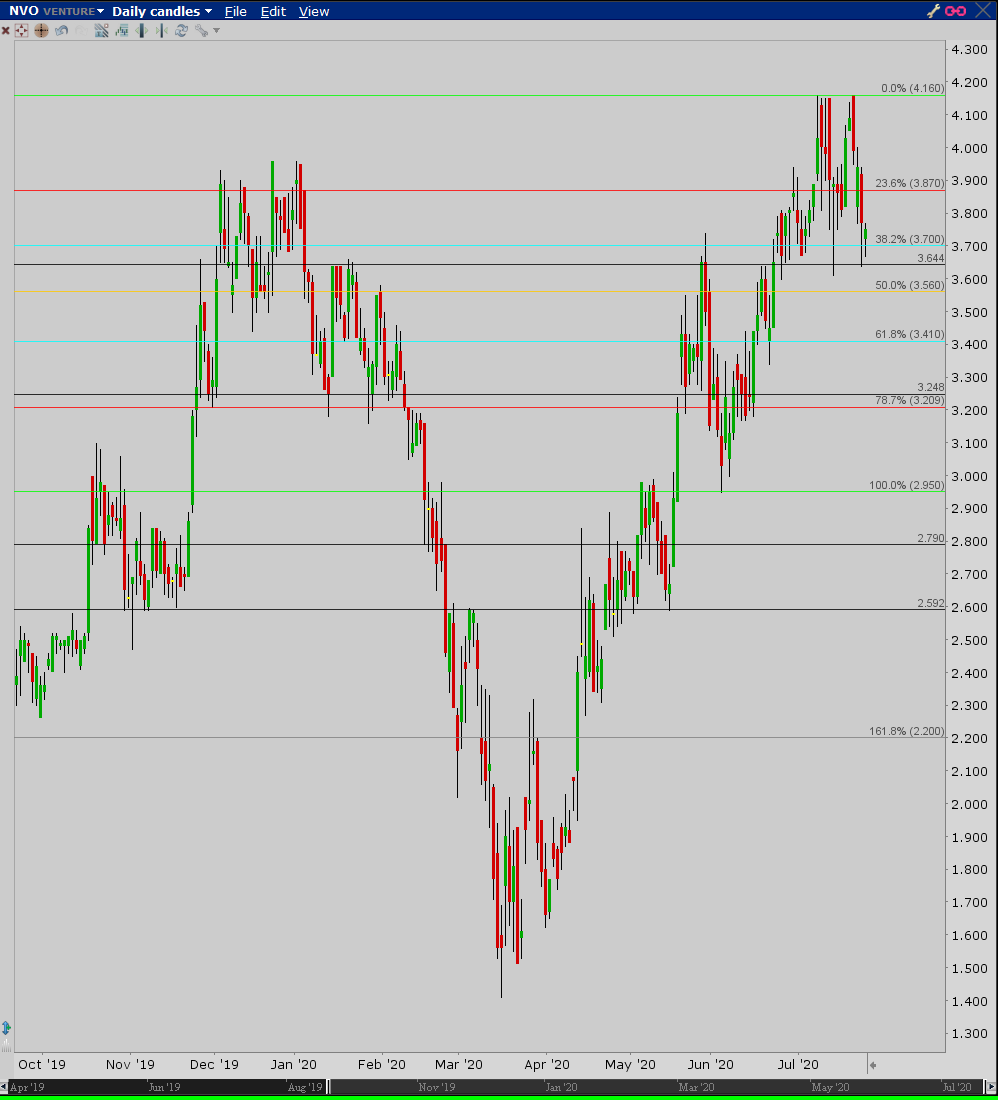
The last chart is a daily interval with some horizontal support lines drawn, as well as a Fibonacci retracement grid covering the range from the low of the last pullback to the previous high. Watch the 50 and 62% retracement areas at 3.56 and 3.41 for potential bottoms on this current pullback.
For those of you watching to buy the NVO dips, which includes myself, watch especially those two Fib retracement levels at 3.56 and 3.41, especially since the 50MA lines up with the 50% retracement level.
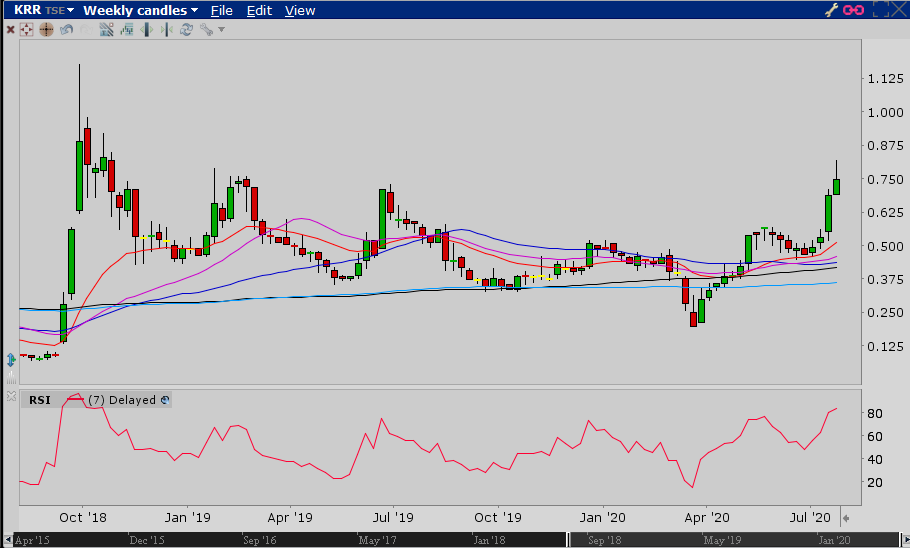
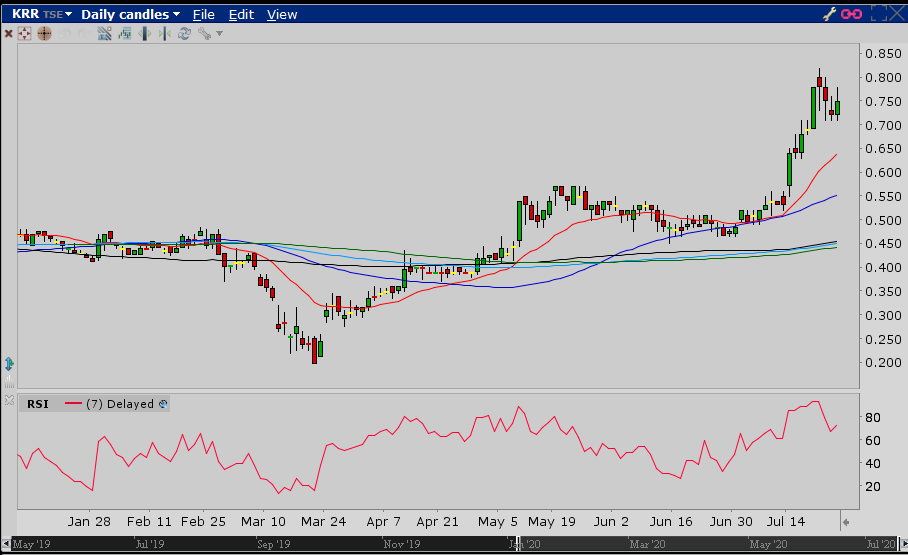
On the weekly interval here you can see KRR has surpassed its prior three major highs on this run from .20 to .82. Very much like NVO, the 20 EMA has held support like a champ on the pullback from mid .50’s before the run to .82. Last week’s candle shows some selling into the end of the week and the RSI is over 80, so it would not be much of a surprise to get more of a pullback or at least a consolidation next week.
The second daily interval chart more clearly shows the selling last week with a bit of buying on Friday. RSI is still in the high 70’s, so watch the 20 EMA around .65 next week. It is possible that last week’s candles formed a bull flag with bulls stepping up into Friday. We won’t know until next week whether this was the case or not.
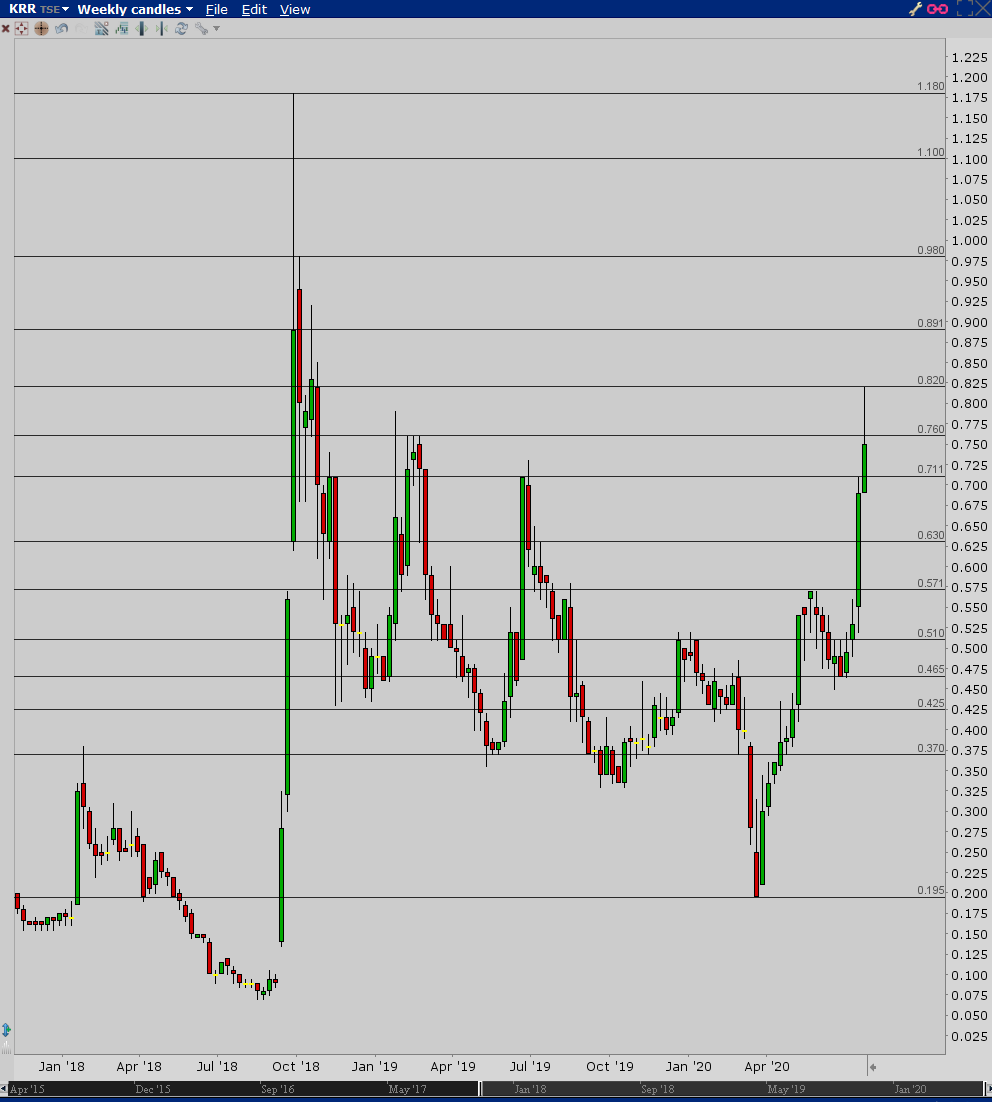
The next chart shows, in my opinion, the major horizontal support and resistance areas for this stock. Although it is a weekly interval chart, I used the daily interval to determine the levels and posted it as a weekly for easier viewing.
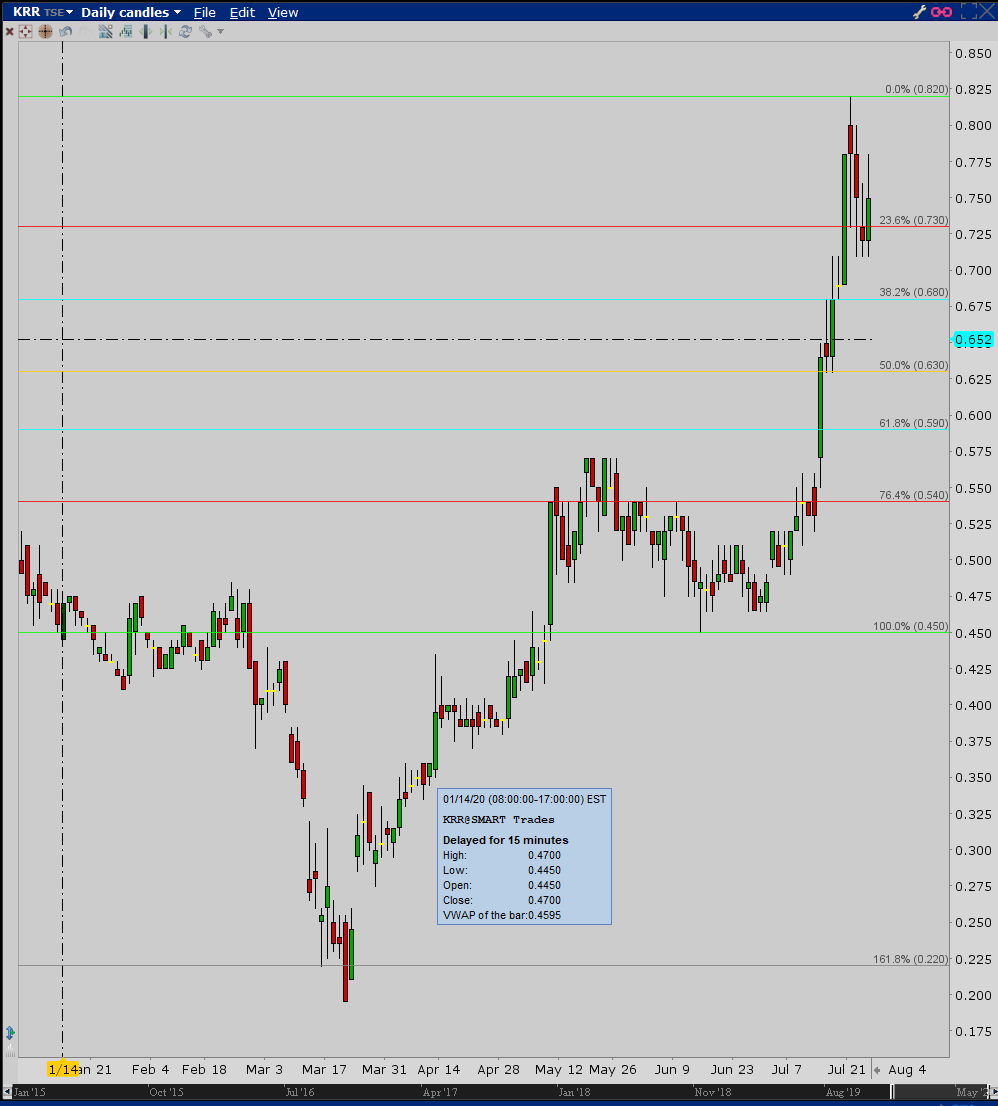
The last chart is a daily interval with a Fibonacci retracement grid covering the last .45 low up to the recent .82 high. If last week’s activity does not end up being a bull flag, watch, as always, the 50 and 62% levels to form a base for the next move higher, especially if they line up with any of the MA’s and horizontal support levels on the other charts.
In summary, for those looking to buy the dip here, my thinking is that you watch .70 closely. If that loses support then you’ve got a shot at .65. If it loses .65 support then you’ll see the 50% level hit at .63 as well as the 62% retracement at .59, but I believe you’ll need to be ready to move if it gets that low because I think shares will be hard to get and that price level won’t last very long. Just my opinion based upon when I bought some RNKLF shares. The Canadian symbol has a lot more volume so it’s not quite as slippery to grab shares.
 Fyi…I think Aretemis is responsible for the recent minor downturn. Their Novo shares just recently became tradable I think.