Charts for Metals and Stocks 2022

Here’s an informative 10 minute update on Gold/Silver/Dollar by Andy of Finding Value who I find to be very good…keeps it simple. He goes through a bunch of precious medals charts (including KRR). Lots of good ideas here and clearly a bull on precious metals.

Gold and Silver: Technical Analysis: LAUNCH COMING - YouTube

What’s your take on Novo after the update yesterday Rick?

Well, I was expecting the annual report to be underwhelming given the issues that were known in Q4. So in that regard it met my expectations I guess. The market has been punishing NVO for its low grade and other issues at Beaton’s Creek while ignoring everything else going on with the company and their assets such as NFG shareholdings, the mill at Nullagine and their vast property holdings. This has created a tremendous value at current levels (though I thought sub-$1.00 NSRPF was tremendous value). I am tempted to average down more here, though with the understanding that it might be dead money for a quarter or two.

However, there are also some catalysts to bump the price back up in the meantime. If the much anticipated (and overdue) bulk sampling ore sorting results come back with comparable (very positive) results as their Phase I, then that should mark the end of new lows and points to a very bright future going forward that erases any issues with low grade ore at Beatons Creek. There is also a ton of exploration news anticipated this quarter…too much for me to recount without going back to their news releases and videos. And of course, the price of gold will certainly help as well.

I’ll probably buy a little more next week at these levels (I have plenty). And then wait until after ore sorting results to determine my next moves with this one.

2 Likes

As far as the chart is concerned the news didn’t seem like that big a deal. Looks like a capitulation move so far. Breached the oldest/lowest trend line but got the close above with a nice candle on decent volume. Gap resistance now at 1.05 and then the usual MA’s above and 1.22 last swing high to eventually overcome.

If this 5 min chart is accurate all of Friday’s trading made an Adam & Eve bottom and we could get a gap fill Monday. Perhaps that news was the exclamation point on the stock decline. Friday’s candle could be representative of one.

2 Likes

A little off topic again, but the dollars decline is unfortunately imminent. Considering the delayed IMF re-balance now scheduled to take effect July 31, and the BCBC delay of the revised Bisel III effective January 1 next year, the dollar is expected to weaken. Inflation will not resolve to desired levels for quite some time.
It is clear what this means for the Price of Gold!

“A Paradigm Shift Western Media Hasn’t Grasped Yet” - Russian Ruble Relaunched, Linked To Gold & Commodities

by Tyler Durden and Ronan Manly

By playing both sides of the equation, i.e. linking the ruble to gold and then linking energy payments to the ruble, the Bank of Russia and the Kremlin are fundamentally altering the entire working assumptions of the global trade system while accelerating change in the global monetary system. This wall of buyers in search of physical gold to pay for real commodities could certainly torpedo and blow up the paper gold markets of the LBMA and COMEX.

The fixed peg between the ruble and gold puts a floor on the RUB / USD rate but also a quasi-floor on the US dollar gold price. But beyond this, the linking of gold to energy payments is the main event. While increased demand for rubles should continue to strengthen the RUB / USD rate and show up as a higher gold price, due to the fixed ruble – gold linkage, if Russia begins to accept gold directly as a payment for oil, then this would be a new paradigm shift for the gold price as it would link the oil price directly to the gold price.

What does this mean for the US Dollar?

Since 1971, the global reserve status of the US dollar has been underpinned by oil, and the petrodollar era has only been possible due to both the world’s continued use of US dollars to trade oil and the USA’s ability to prevent any competitor to the US dollar.

But what we are seeing right now looks like the beginning of the end of that 50-year system and the birth of a new gold and commodity backed multi-lateral monetary system. The freezing of Russia’s foreign exchange reserves has been the trigger. The giant commodity strong countries of the world such as China and the oil exporting nations may now feel that now is the time to move to a new more equitable monetary system. It’s not a surprise, they have been discussing it for years.

While it’s still too early to say how the US dollar will be affected, it will come out of this period weaker and less influential than before.

What are the Consequences of these Developments?

The Bank of Russia’s move to link the ruble to gold and link commodity payments to the ruble is a paradigm shift that the western media has not really yet been grasped. As the dominos fall, these events could reverberate in different ways. Increased demand for physical gold. Blowups in the paper gold markets. A revalued gold price. A shift away from the US dollar. Increased bilateral trade in commodities among non-Western counties in currencies other than the US dollar.

Zerohedge

The above is an excerpt from a longer article (see link to full article)…

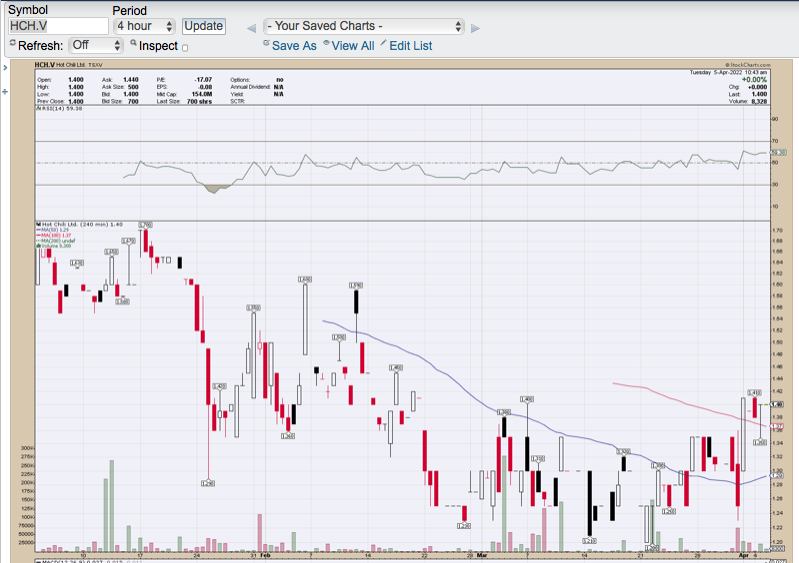
CHG has just mentioned Hot Chile on the Other Mining Stocks 2022 thread again after it reorganized it’s share structure. It has only been trading a couple of months, so here is what the 4Hr interval is looking like for those who may be interested:

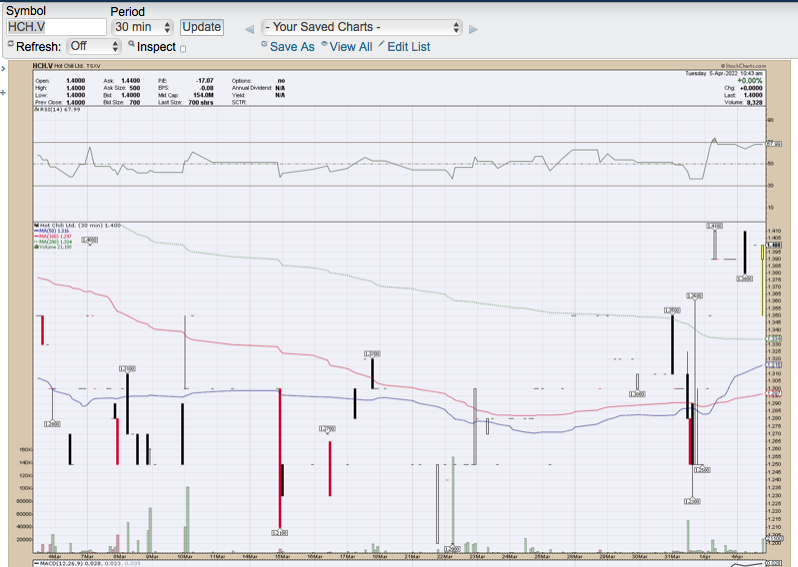
It appears to have some traction gathering this morning, so here is a 30 minute candlestick chart:

2 Likes

KRR Daily charts…

If you’re wondering why I didn’t draw the channel off the top candle from Aug '20 it’s because, in regards to OTC/TSX mining stocks in particular, candles that look just like that one tend to be paint jobs which often signal the end of the uptrend, like the one in question did. So I picked the high of the candle that preceded the paint job candle. Secondly, if you’re wondering why there are candles left out of the bottom of the channel during Oct/Sept of '21, it’s because that channel trend line held on three consecutive dips during that consolidation. I suspect that acted as a nice opportunity to shake some longs out before the run up above $5. If you study the way the candles react to each of the three channel lines you can see they prove to be quite useful a number of times over the years, I believe including the current high prices that are being hit. There is RSI divergence going on here now which may be telling us we’re seeing a double top and not a ascending triangle. I could be wrong but I’m thinking we could see a visit to the center channel line over the next couple months.

The violet and red MA’s when held as support/resistance indicate a strong trend. The navy blue and black MA’s are hit when a deeper retracement occurs but are still supportive of the overall trend. The green and yellow MA’s are the last line of defense before an ultimate confirmation of a trend reversal. I suspect that KRR is due for a test of the blue or black MA’s which will obviously be higher when they are finally tested unless the stock should take an immediate and violent dive tomorrow or Monday. :slight_smile:

1 Like

Moment of truth here for my KRR charts…

1 Like

Here’s an update to KRR

The upper channel trend line is still holding as resistance. It obviously can break up out of this and keep going, but it could just as easily drop and head for the gap fill at 5.63 which is nearing the center channel line.

If it does break up out of the channel, keep your eye on the development of a rising wedge, which is a top formation and obviously bearish.

The RSI’s of the weekly & monthly intervals are very overbought, although strong stocks can stay “overbought” for a long time before pulling back.

1 Like

ELO weekly… The black triangle is a bullish falling wedge which ELO broke out of. The red line at 6.39 is the ultimate target price of this breakout. ELO ran to a major resistance area of 5.40 (#1 on the chart) while hitting an overbought condition on the RSI study at the bottom of the chart, and now we are in the midst of a retracement. $4.50 is the .618% retracement of the move and we came within .04 of hitting that yesterday so I didn’t leave it on the chart. #2 on the chart is the shortest MA I use, currently at 4.39 and there is also some horizontal support there. Considering how ELO traded yesterday I fully anticipate visiting that level early next week. If our uptrend is VERY strong then I would expect that support level to hold and we perhaps consolidate for a bit before heading up again. If it doesn’t hold, although I’m sure many longs would find it frustrating, it does not indicate anything bearish for the stock. There is a stronger horizontal support level around 4.09 and two MA’s right there (#3) at 4.11 and 4.08. If that price level is visited I expect the RSI will hit trend line support as well (#4).

1 Like

In the event that the stock gets a bounce and/or gaps up at the open on Monday, which is very possible since the RSI on the daily chart is extremely oversold, ELO will likely test the underside of the two MA’s above it currently at 4.82 & 4.96. (I also highlighted the next level of support at the blue MA along with a trend line).

If ELO manages to push through those two MA’s it then needs to get through the 50 & 61.8% retracement levels on the final chart. So next week if the stock doesn’t move any lower than our 4.54 - 4.50 low from last week and we get a close above $5.10 then there’s a good chance this retracement is over and we can start looking towards revisiting and potentially moving up through that $5.40 level.

I currently don’t expect this to be the case, but that doesn’t mean it won’t happen.

AMRK

This one is pretty thinly traded and has a ridiculous spread. I don’t usually trade these kind of stocks but the company is a leading bullion dealer and a person I have come to recognize as being worth paying attention to is of the opinion that the company is likely to announce a special dividend and forward stock split in the near future, perhaps around its next earnings report on May 10. This is speculation at this time and not fact. Regardless of this, I have been accumulating the past few days because the stock is making a bullish pennant formation upon hitting new a all-time high.

The most recent two pullbacks prior to the current have gone to and a bit below the .618 retracement level and the red MA on the chart. So far it has not retraced as far but had a nice bounce in late trading Friday with a false breakout of the pennant before pulling back inside. Monday will either get the stock closer to the typical Fib retracement or get us a break out and potential new highs by the end of the week providing the pennant plays out in full during the week.

Here’s an update to the ELO chart which I posted on another forum first so ignore what doesn’t make sense. I’m too lazy tonight to edit it out! :slight_smile:

Ok gents, here’s the ELO chart as I see it. It’s pretty much the same as the last time I posted. We came down below my fastest moving average and closed a tad below it, but we went right to the 50% retracement level of the range of our last swing low-swing high. Now the question is do we bounce from here or do we have lower to go? Based on how ELO closed last week and also how the gold and silver futures have been trading I expect we’ll at least trade down to the next lower zone of support between 4.17-$4.08. When the market closes next Friday we’ll have a much better idea of things. If ELO ends up closing above 4.43 for the week then we’ll know the uptrend is still very strong. Same even if the weekly candle closes above 4.17-4.08. If those levels don’t hold and we lose $4 then there’s a good chance we see mid-3.80’s all the way to the low 3.50’s. So imo next week is a significant one not just for ELO but the miners and gold/silver in general. To keep it uber-simple for my friend Dreadnought, for ELO to close at or above 4.08 is a good sign for the strength of the trend and the higher the better. Below 4.08, not as good unless you want to buy bargain shares, which I’m happy to do. The first chart I’m posting is the weekly interval and the second chart is the daily. The 4.17 - 4.08 price level is significant on both charts, imo.

The last time I posted the daily chart I mentioned for the uptrend to resume ELO needed to get back above the purple and red MA’s. We tried but in the end failed, making a bear flag which we dropped from later in the week. One potentially good sign on this chart is the RSI is oversold and we have bullish divergence, meaning price hit a lower low but RSI did not, so perhaps we’re ready for a bounce next week at some point.

1 Like

ESK

Friday ESK again touched strong trend line support.

What is (usually) promising is this formation which is not a bear flag due to the downward slope of the “flag”. Often when I see this “hockey stick” formation it is a bullish sign that the stock inevitably launches up out of. It’s not 100%, but in my experience better than 80%. Also there is bullish divergence on the RSI, as price has hit 3 new lows during the formation of the hockey stick, RSI has hit higher lows, typically an early signal for a move higher, imo.

KRR Update

The weekly chart shows KRR has retraced a bit over 61.8% of it’s previous range and got a little bounce from the lows. There’s an uptrend line just below along with first MA support that will be higher than 5.84 if/when it gets there.

The daily chart shows price moved into a support area last week and buyers did step in late in the day Friday. They didn’t get a close above the red MA and if gold and silver trade lower at the open like they are now then KRR is likely to go lower before hitting solid support. The trend line just below is untested so it is likely to be breached, but the close is what will be most important in regards to the trend line. Right now I’m pretty convinced we’re going to test the blue MA here, which is right around the same level as the first MA on the weekly chart. There is a small gap to fill at 5.63 as well. I wouldn’t be in too much of a hurry to be buying miners right now as it looks like the sector will be trading at least a little lower before we bounce.

1 Like

ELO Daily/Weekly

So far, so good!

1 Like

ESK Daily

We got a gap fill that I wouldn’t have noticed had I not seen another post about it elsewhere. We also popped back up and closed above trend line and MA support. Nice volume as well!

1 Like

SVSVW Daily

The upper channel line may be uptrend line support here. If it falls further I’ll look to add at the center line/blue MA.

KRR Daily/Weekly

The stock came .11 from hitting the weekly violet MA. If that’s as much of a dip as we get then the trend is still very strong. It feel below horizontal support at 6.16 but had a strong second half recovery. The close right on the trend line has me wondering if it may dip down and tag the blue MA and maybe fill the gap at 5.63 before this is over.

1 Like

NFG had a nice recovery today as well.