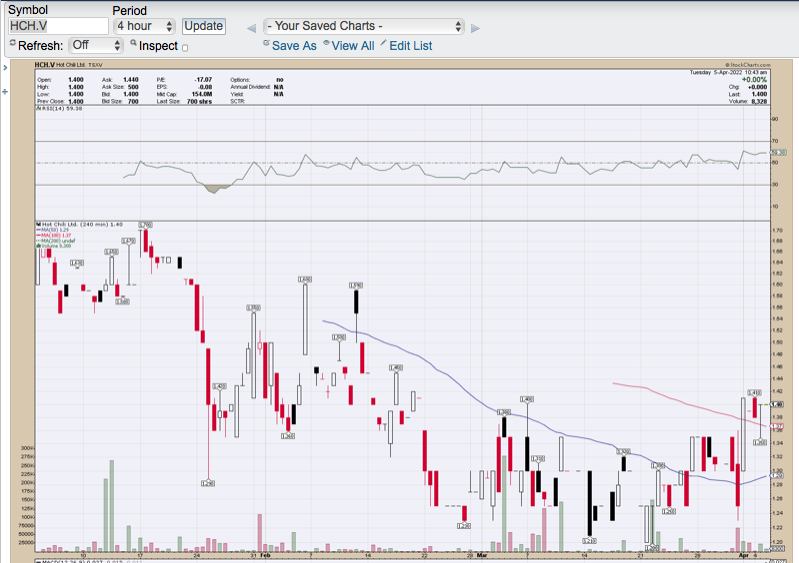
CHG has just mentioned Hot Chile on the Other Mining Stocks 2022 thread again after it reorganized it’s share structure. It has only been trading a couple of months, so here is what the 4Hr interval is looking like for those who may be interested:
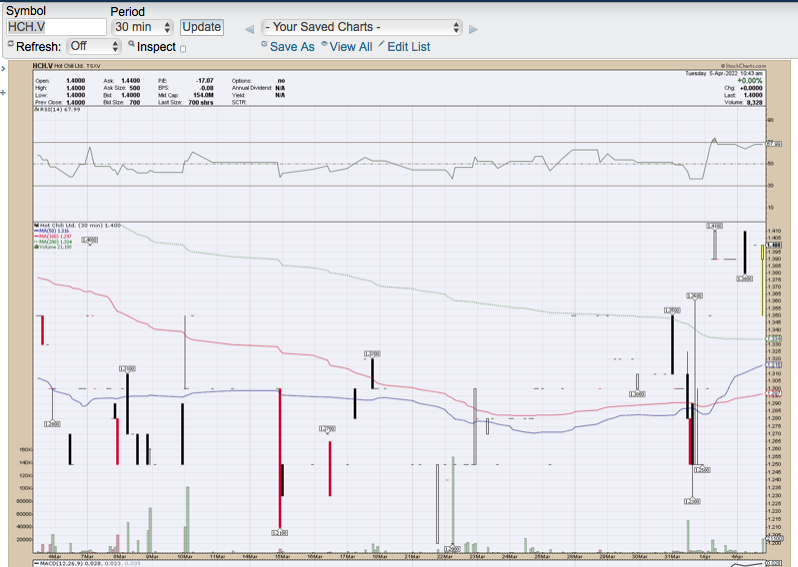
It appears to have some traction gathering this morning, so here is a 30 minute candlestick chart:
2 Likes
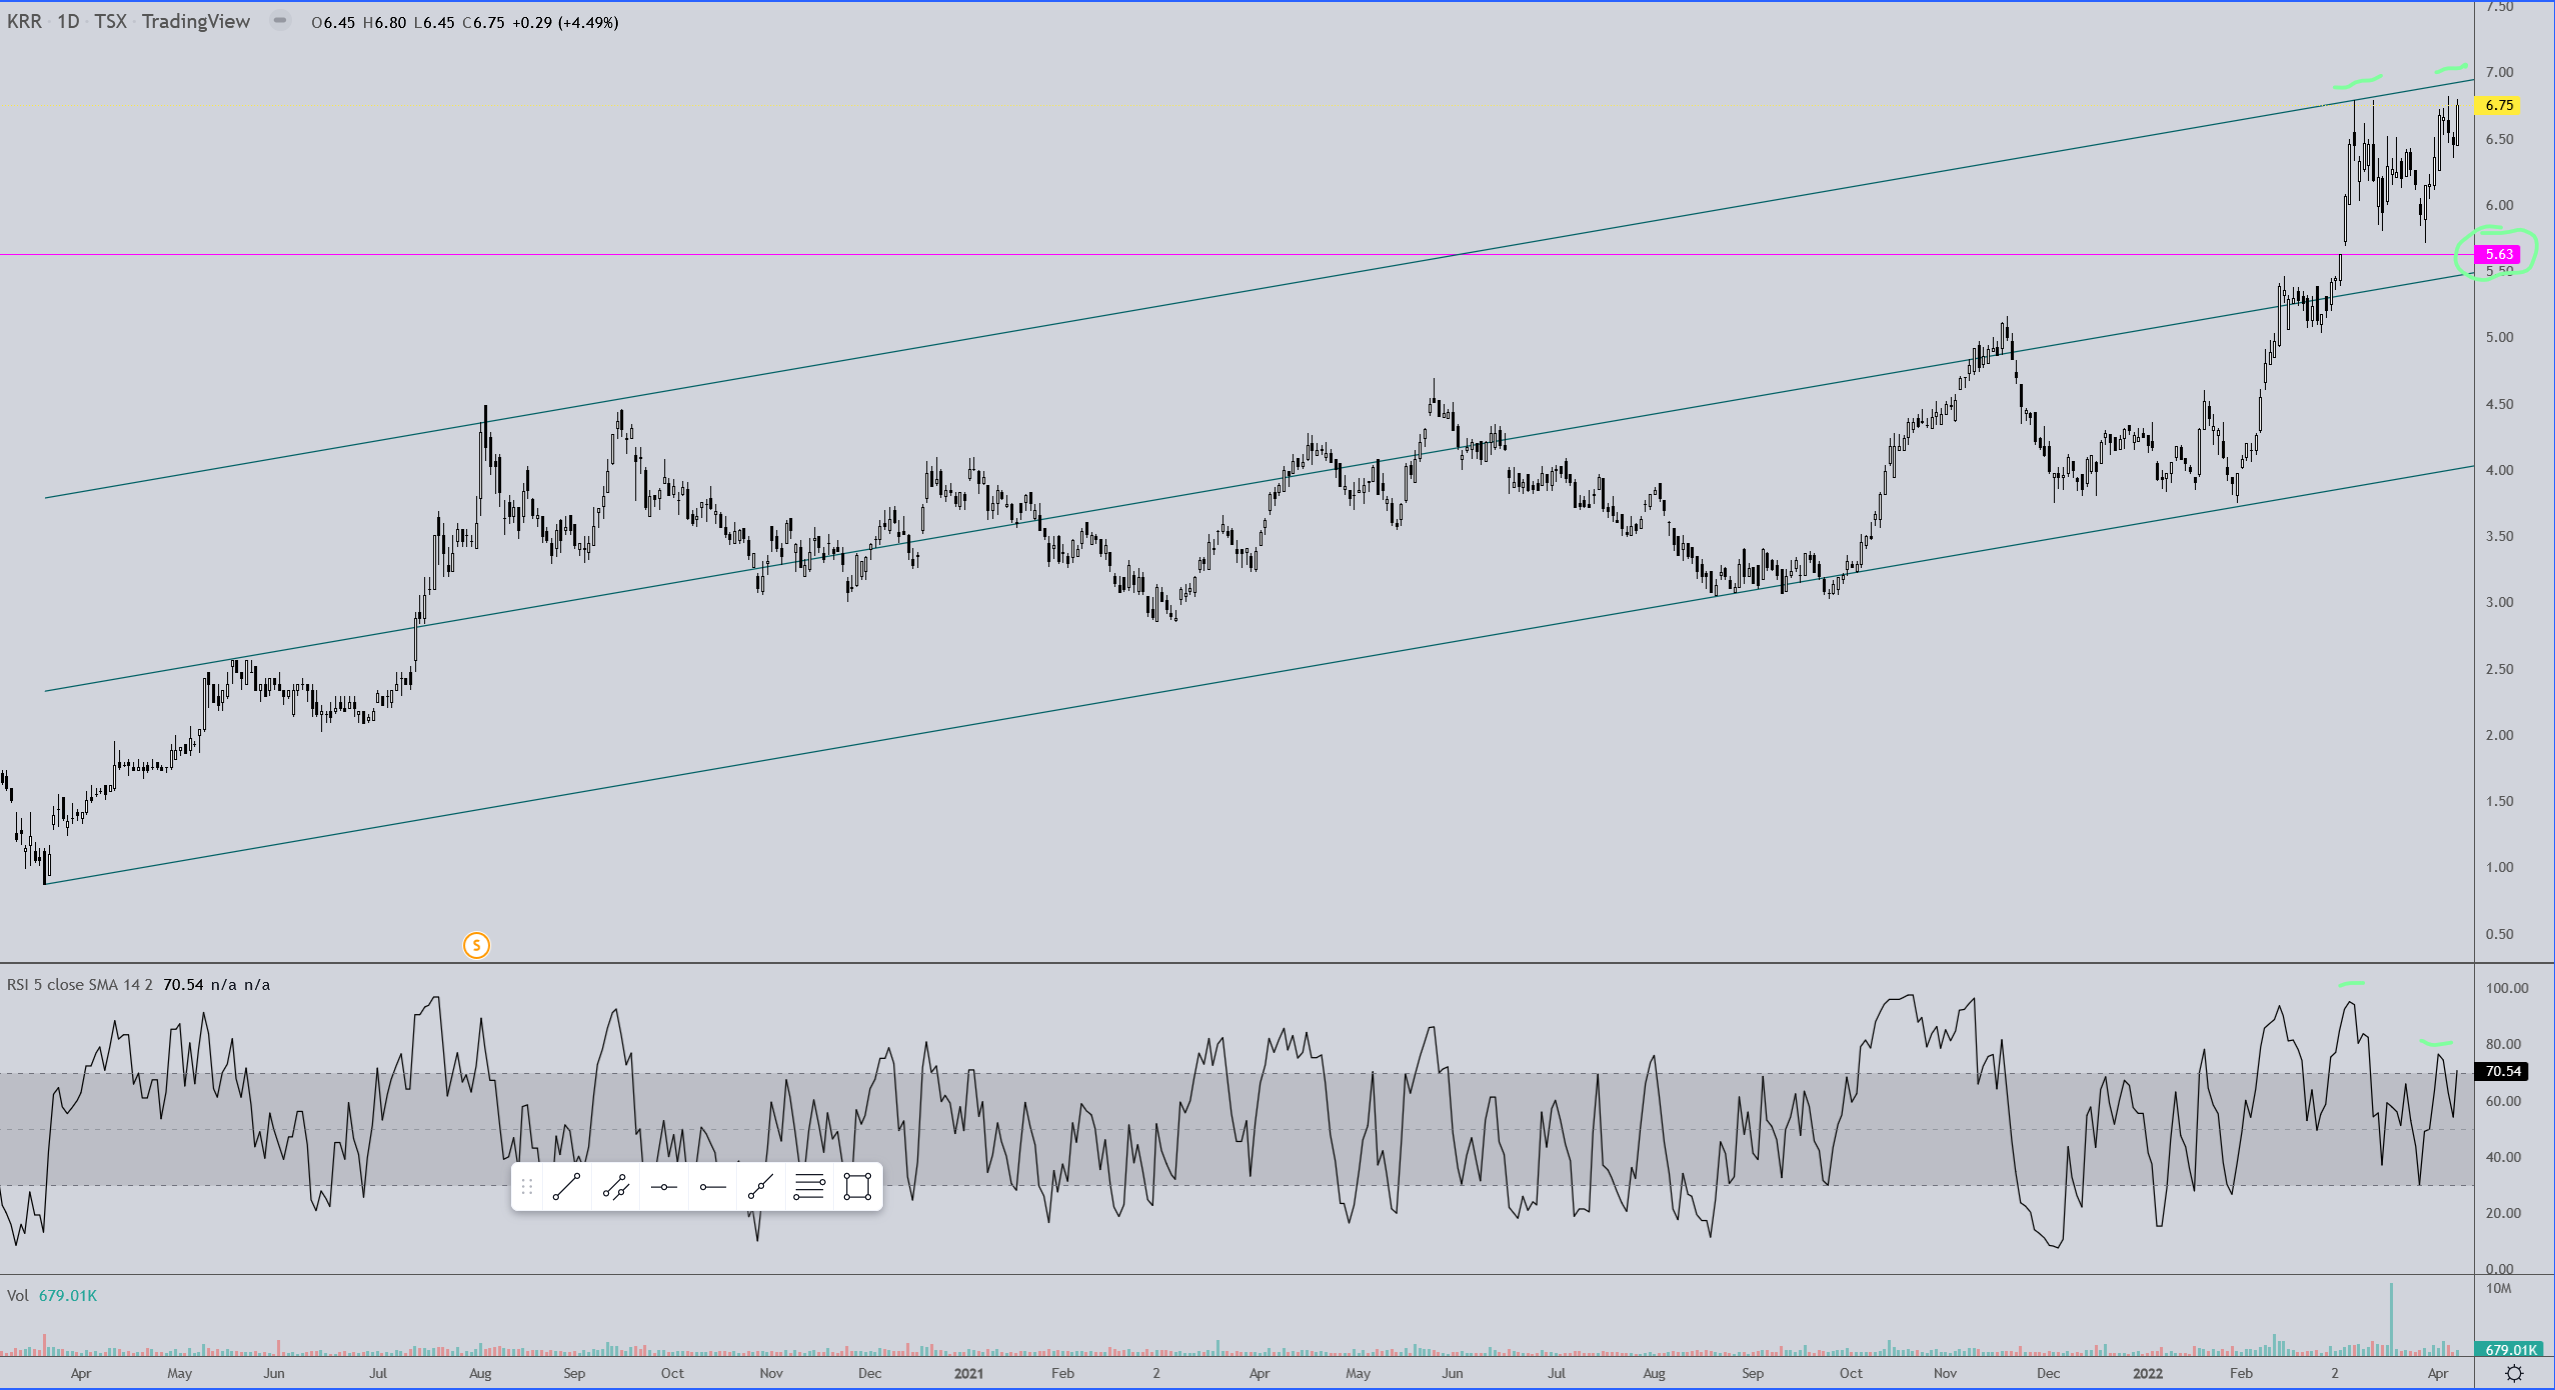
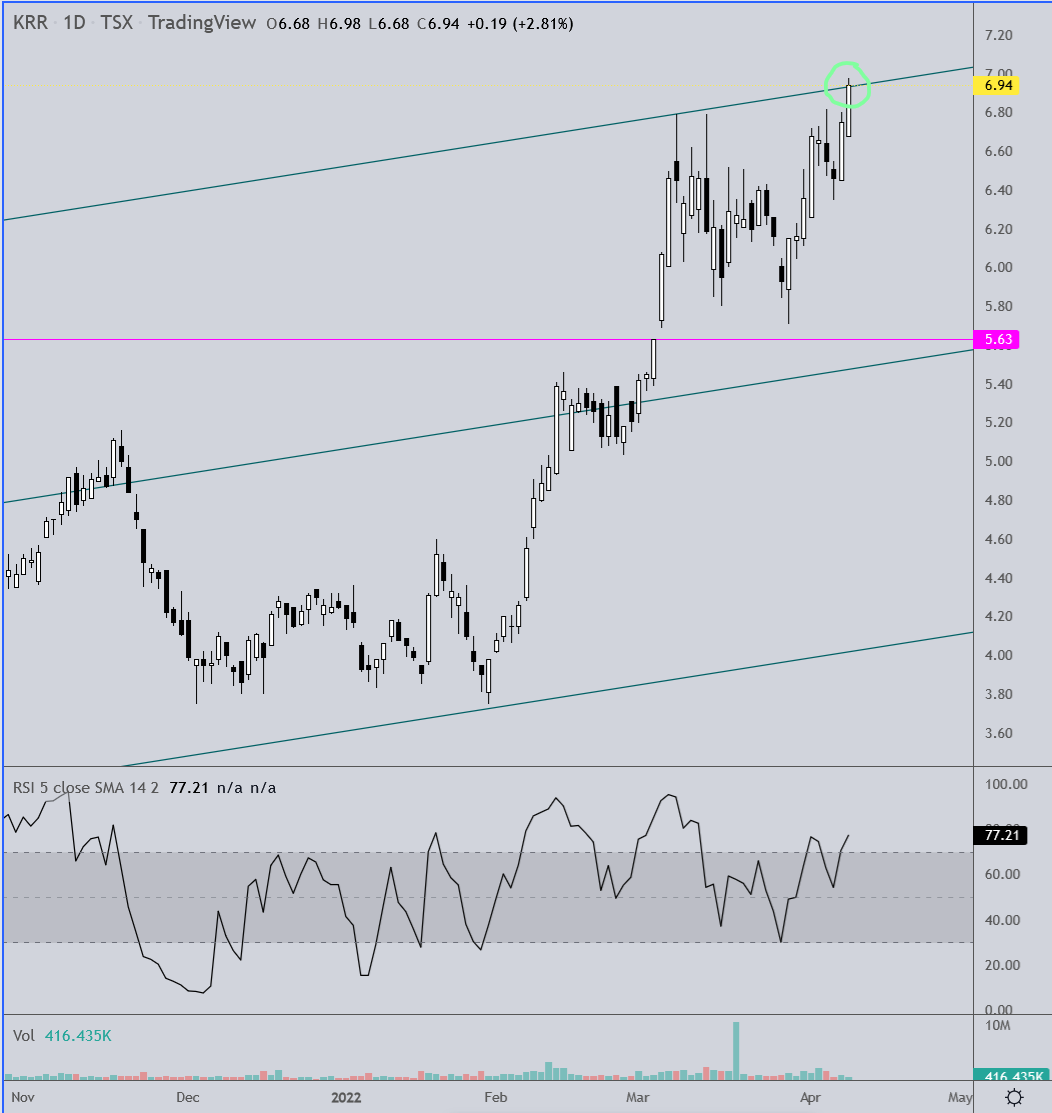
KRR Daily charts…
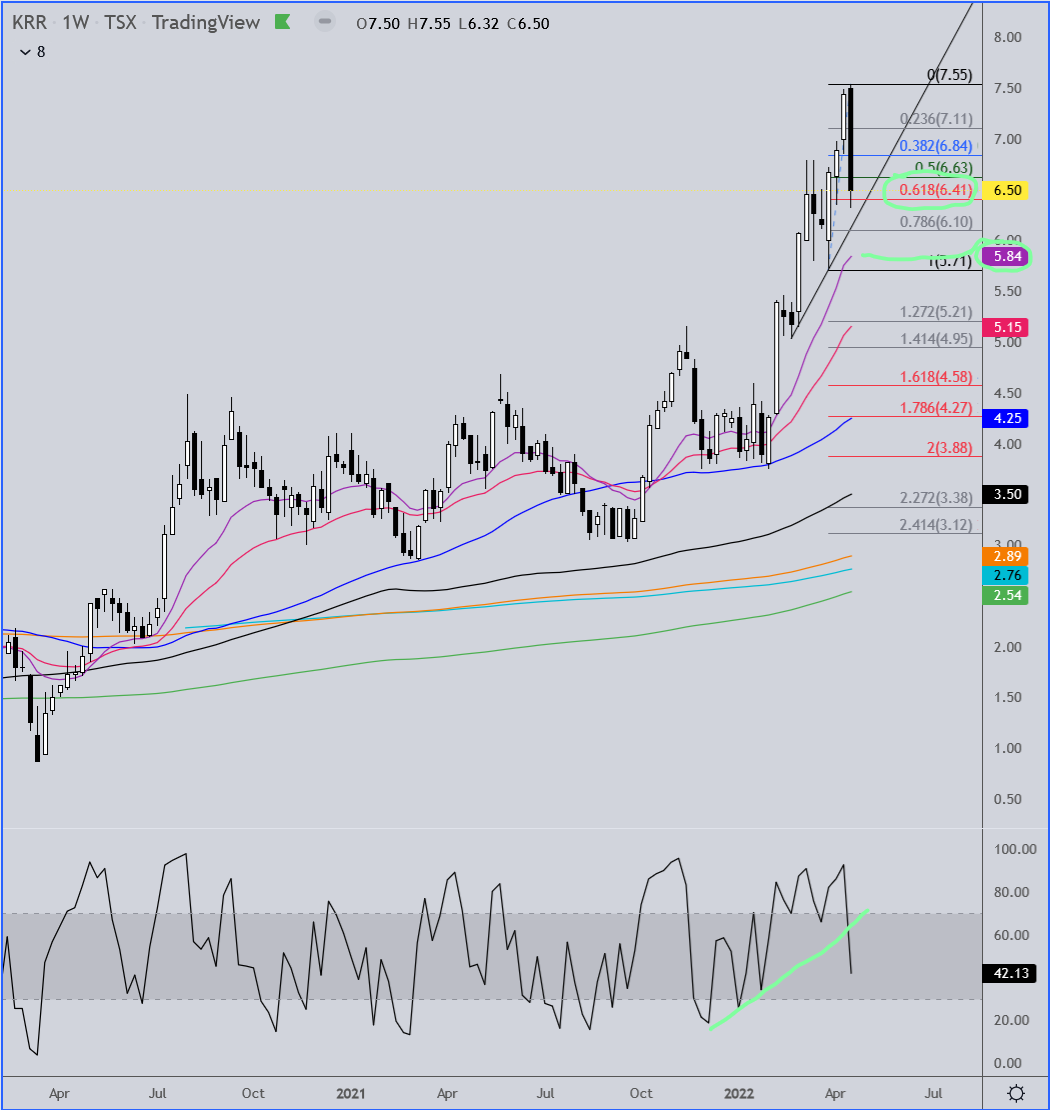
If you’re wondering why I didn’t draw the channel off the top candle from Aug '20 it’s because, in regards to OTC/TSX mining stocks in particular, candles that look just like that one tend to be paint jobs which often signal the end of the uptrend, like the one in question did. So I picked the high of the candle that preceded the paint job candle. Secondly, if you’re wondering why there are candles left out of the bottom of the channel during Oct/Sept of '21, it’s because that channel trend line held on three consecutive dips during that consolidation. I suspect that acted as a nice opportunity to shake some longs out before the run up above $5. If you study the way the candles react to each of the three channel lines you can see they prove to be quite useful a number of times over the years, I believe including the current high prices that are being hit. There is RSI divergence going on here now which may be telling us we’re seeing a double top and not a ascending triangle. I could be wrong but I’m thinking we could see a visit to the center channel line over the next couple months.
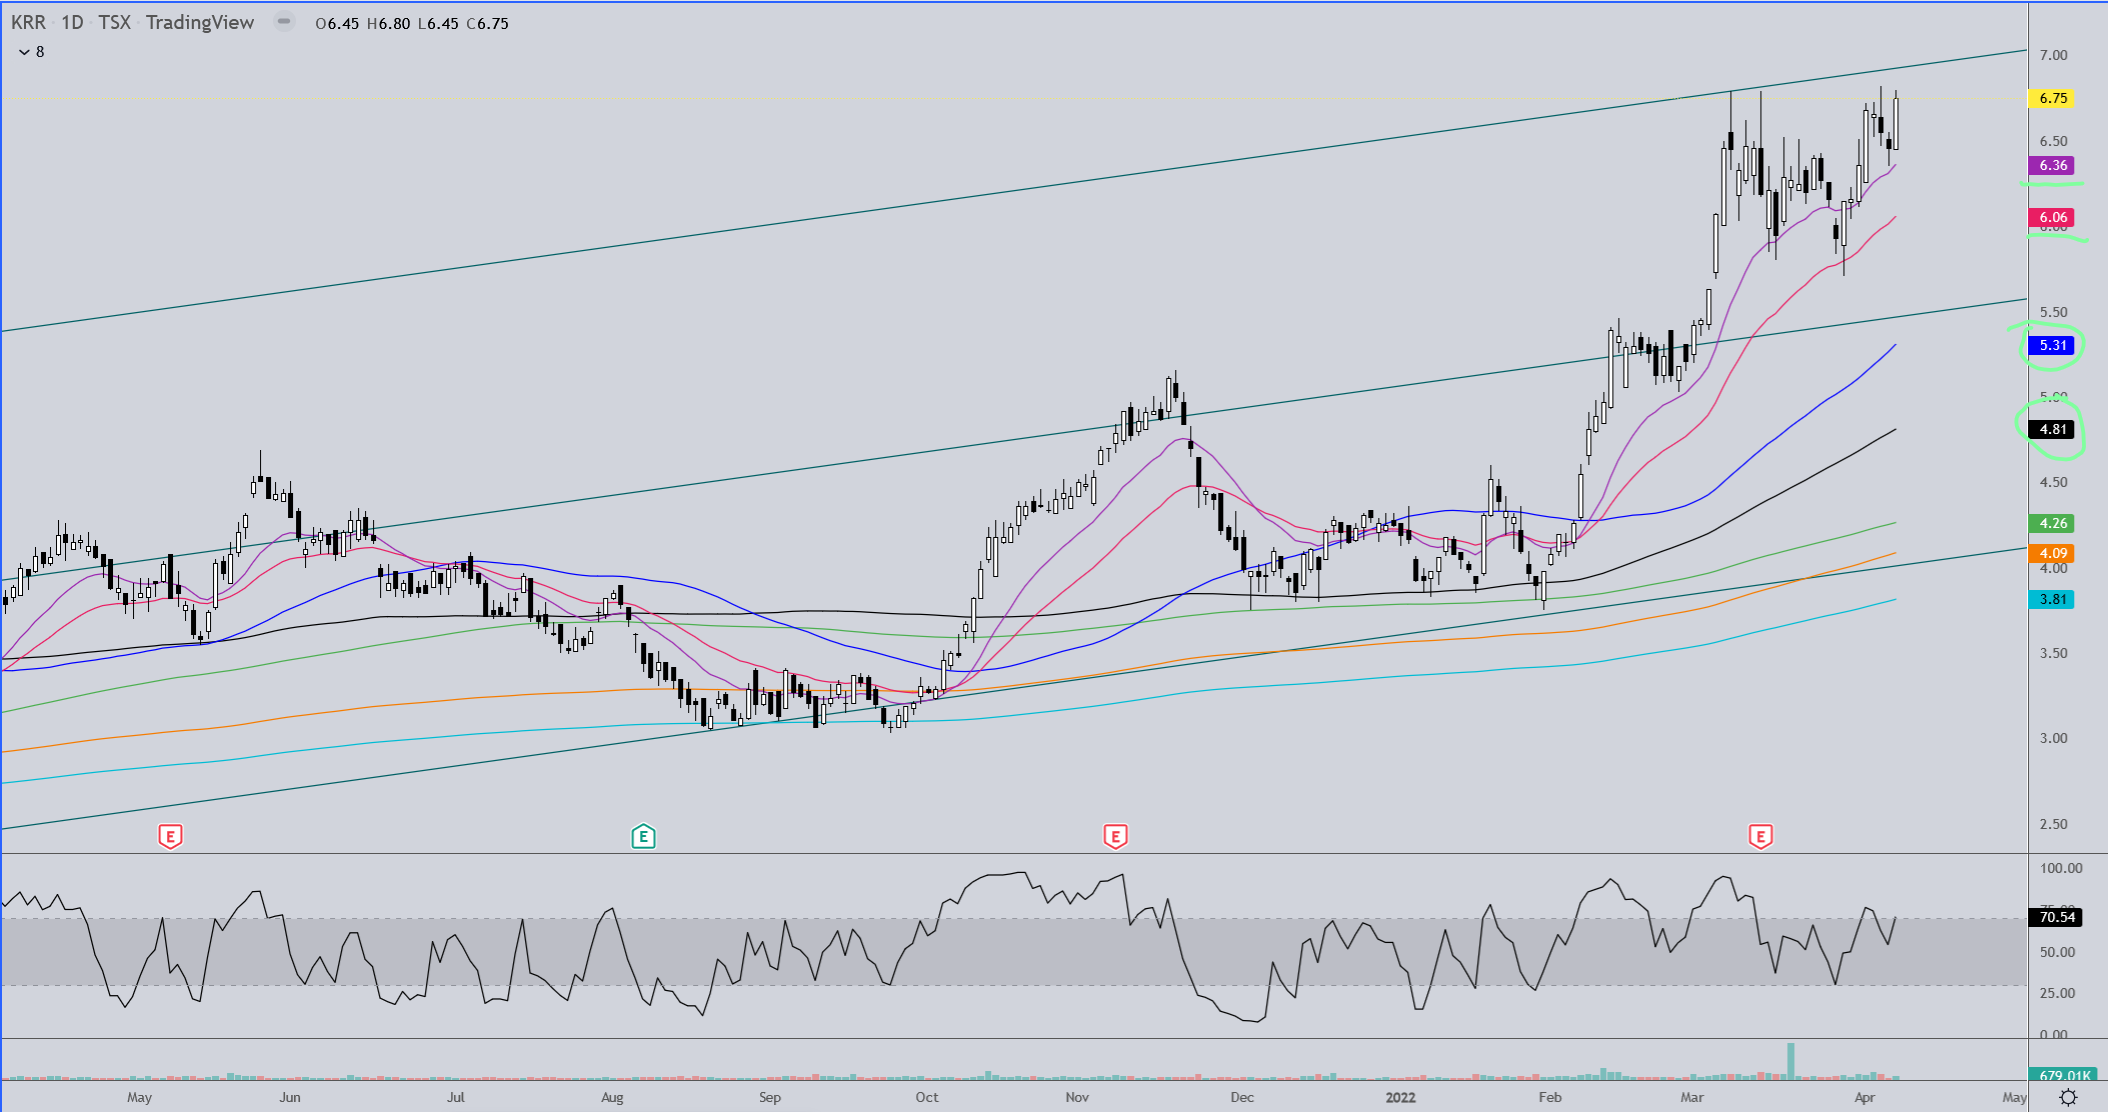
The violet and red MA’s when held as support/resistance indicate a strong trend. The navy blue and black MA’s are hit when a deeper retracement occurs but are still supportive of the overall trend. The green and yellow MA’s are the last line of defense before an ultimate confirmation of a trend reversal. I suspect that KRR is due for a test of the blue or black MA’s which will obviously be higher when they are finally tested unless the stock should take an immediate and violent dive tomorrow or Monday. 
1 Like
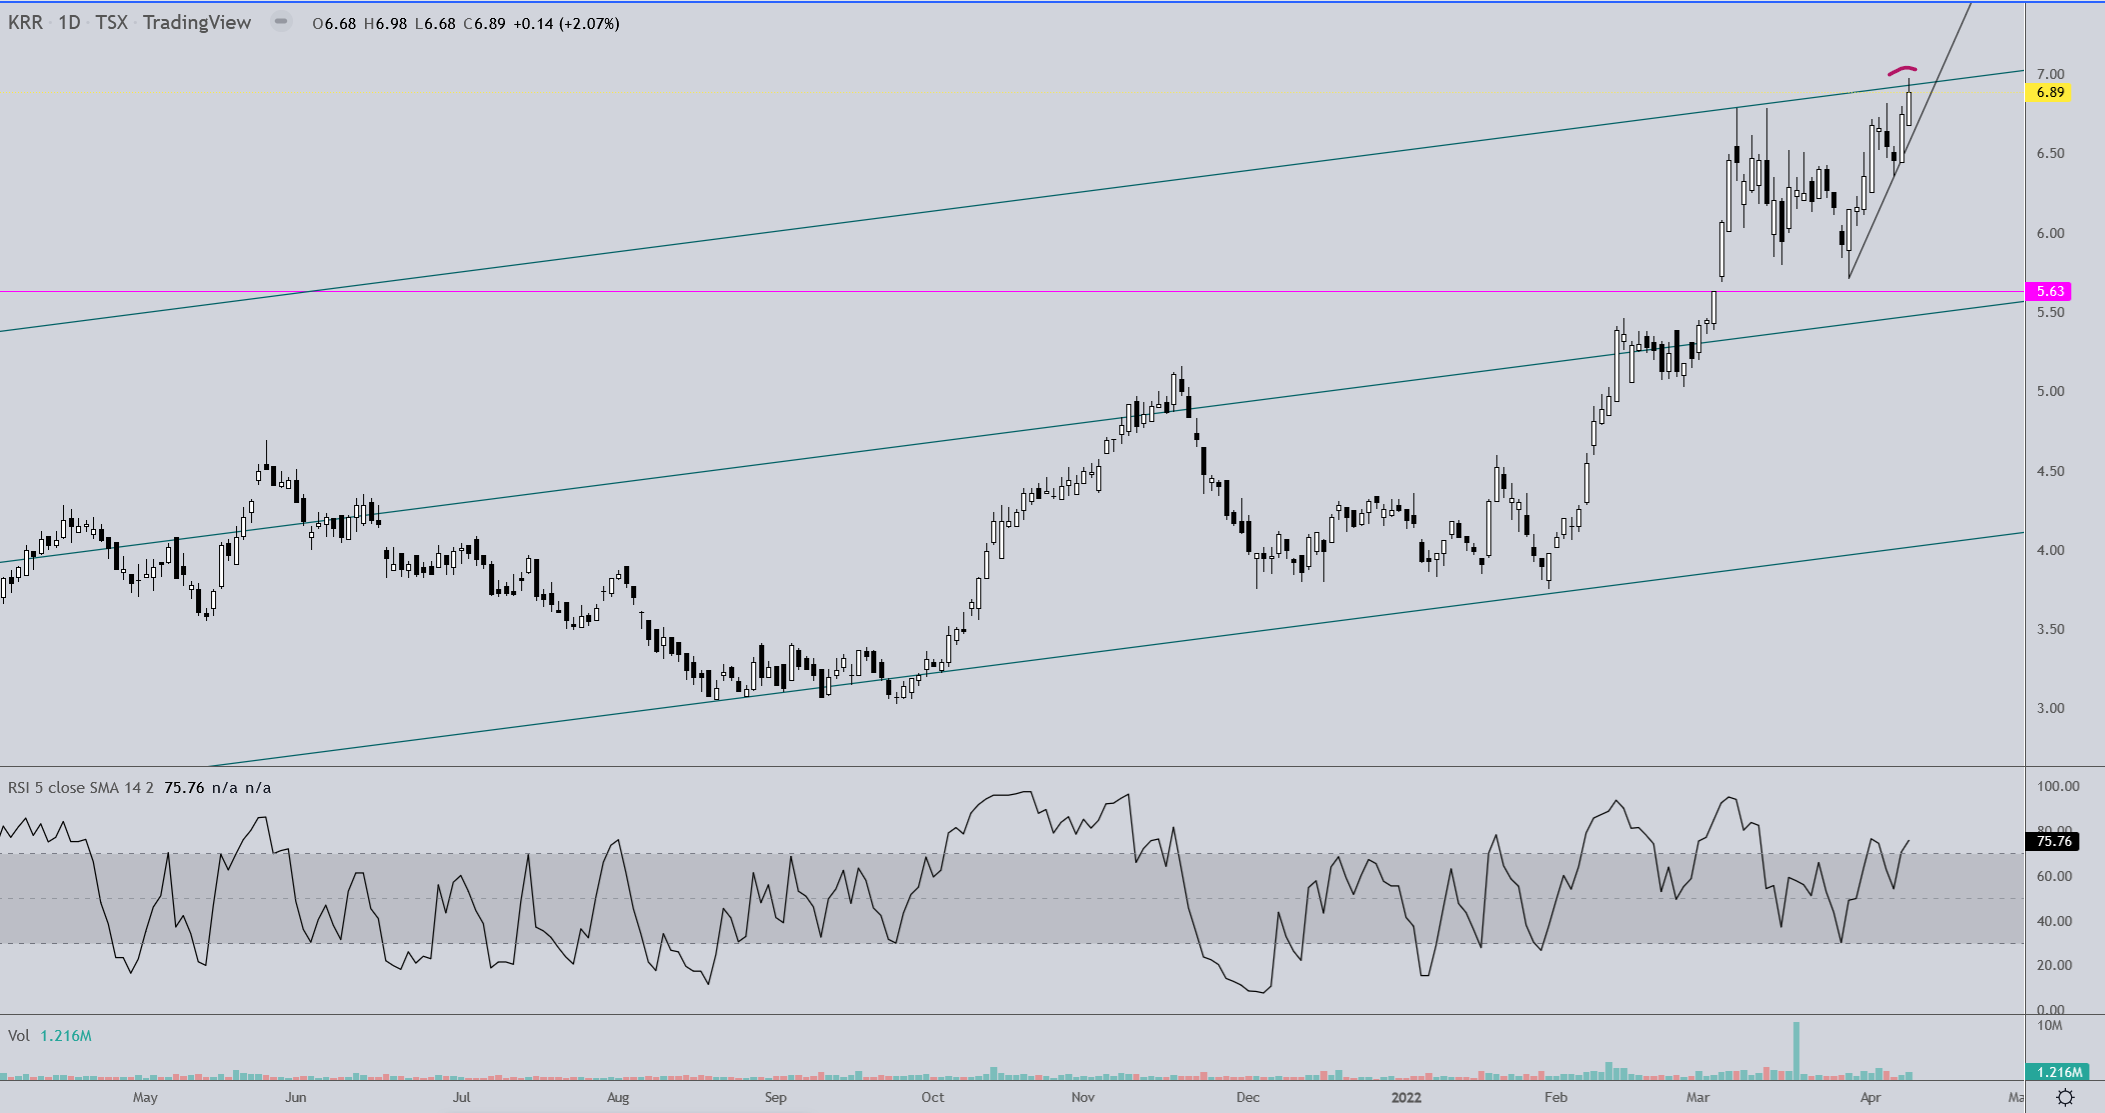
Moment of truth here for my KRR charts…
1 Like
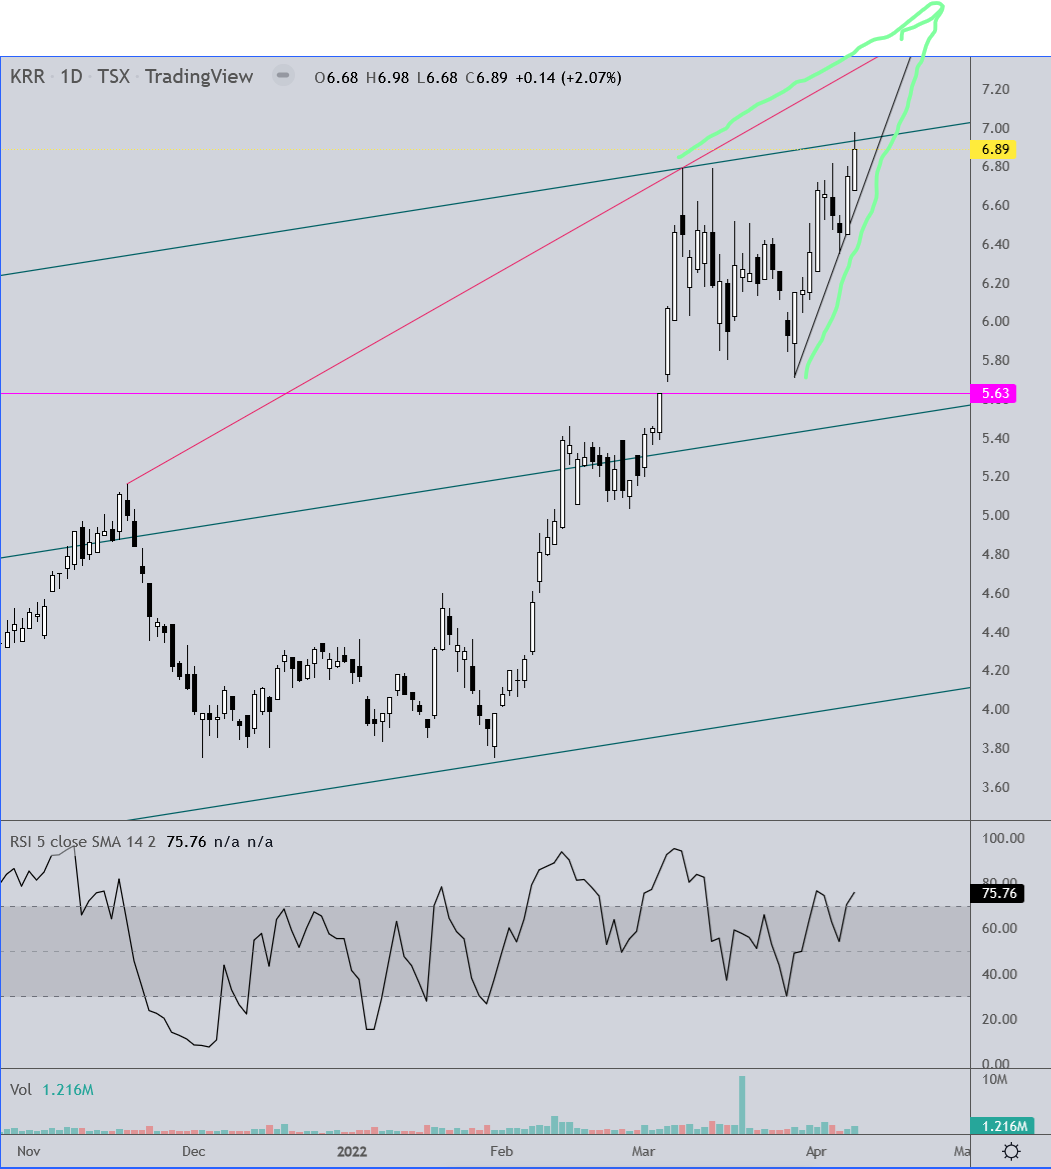
Here’s an update to KRR
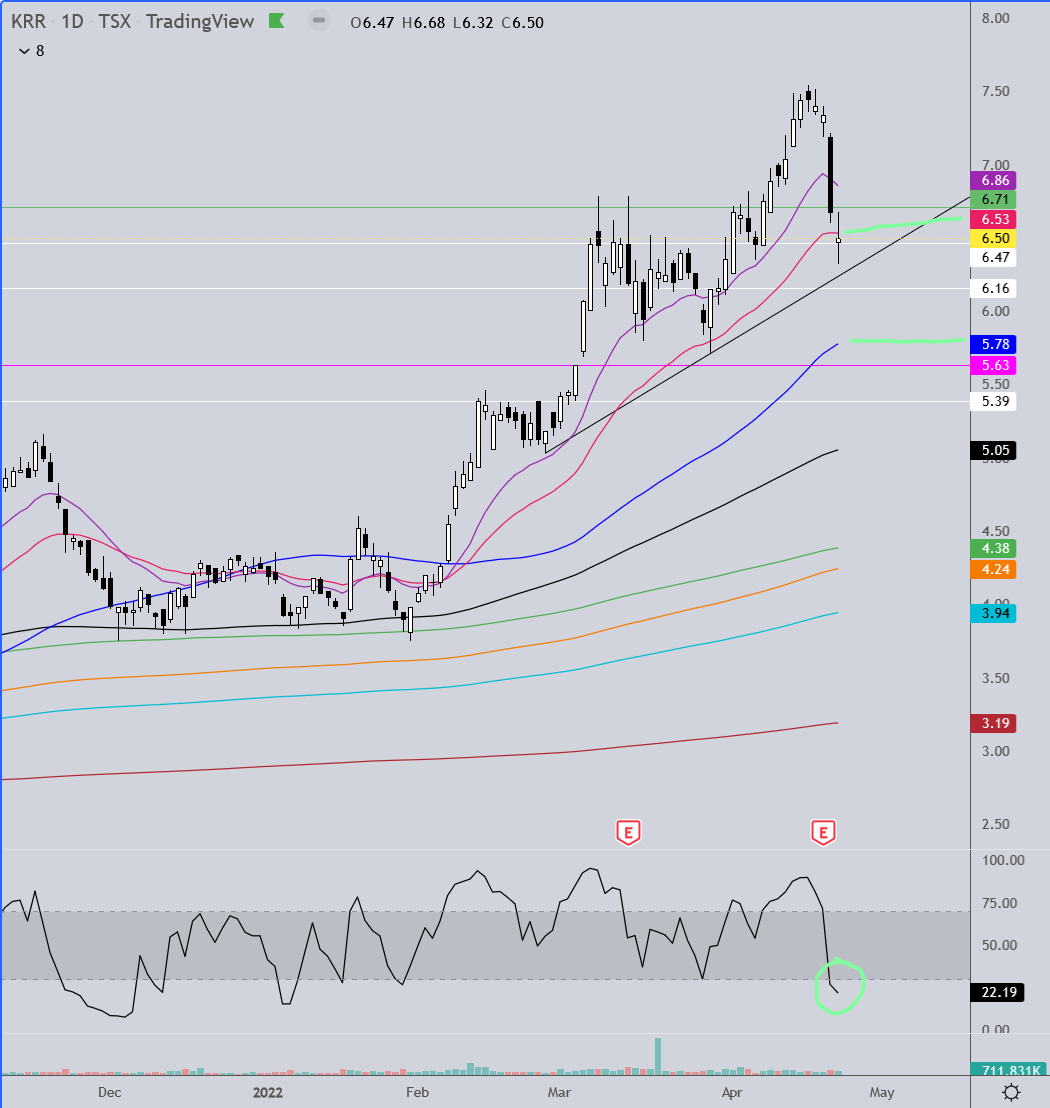
The upper channel trend line is still holding as resistance. It obviously can break up out of this and keep going, but it could just as easily drop and head for the gap fill at 5.63 which is nearing the center channel line.
If it does break up out of the channel, keep your eye on the development of a rising wedge, which is a top formation and obviously bearish.
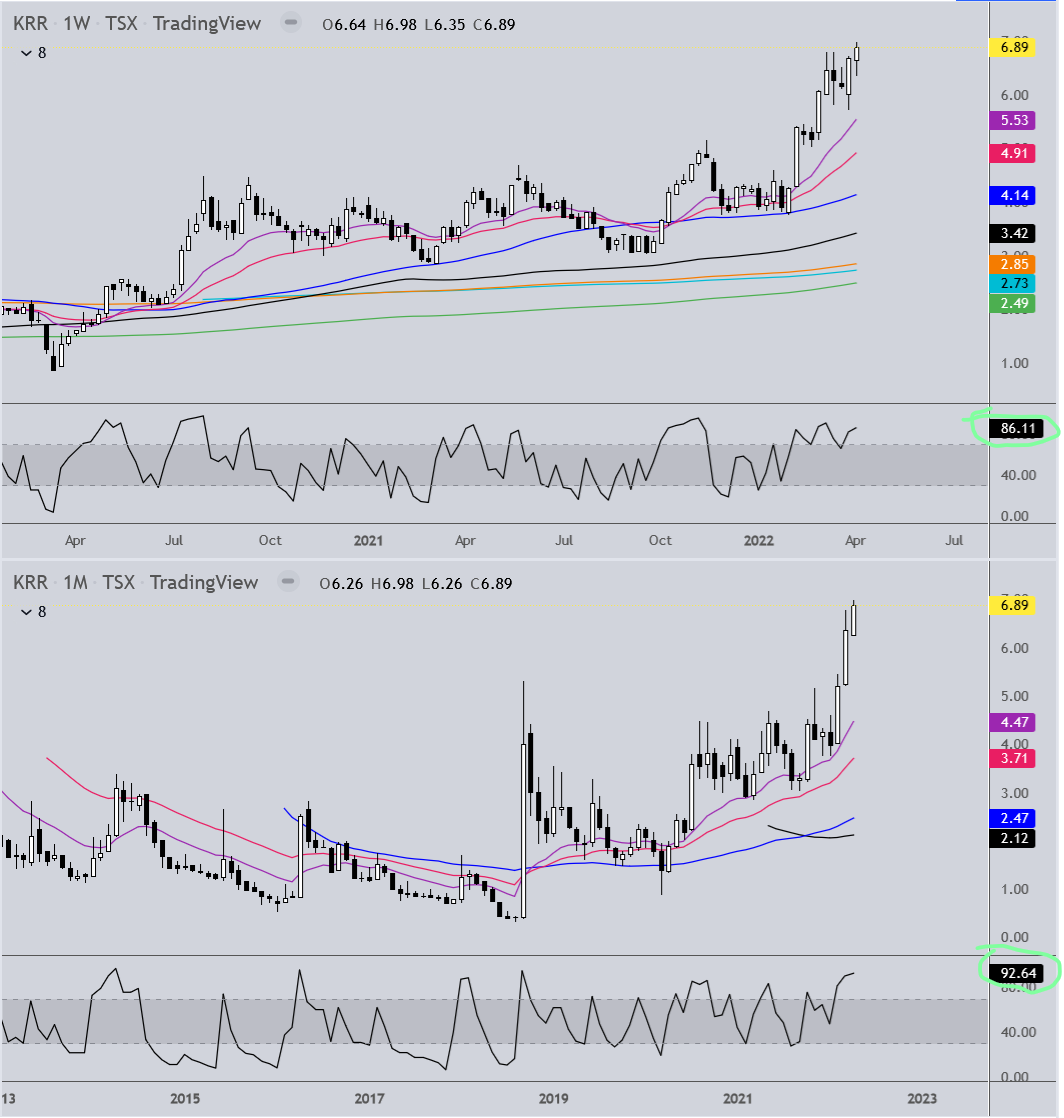
The RSI’s of the weekly & monthly intervals are very overbought, although strong stocks can stay “overbought” for a long time before pulling back.
1 Like
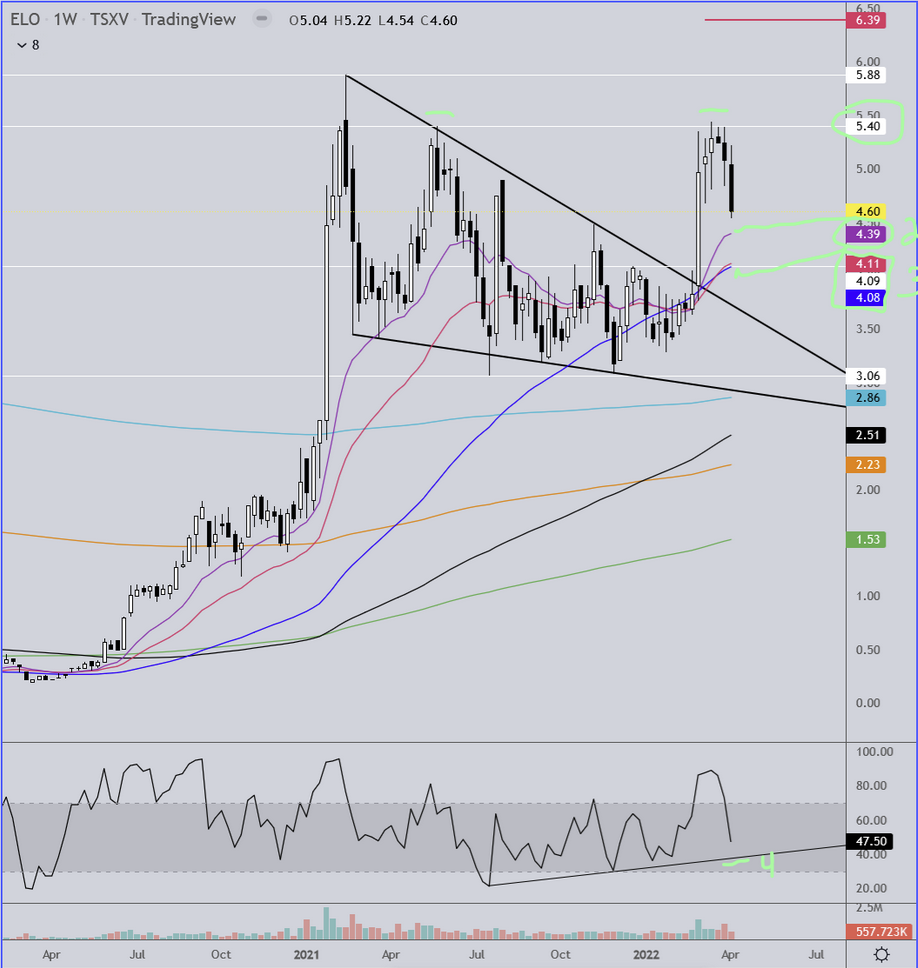
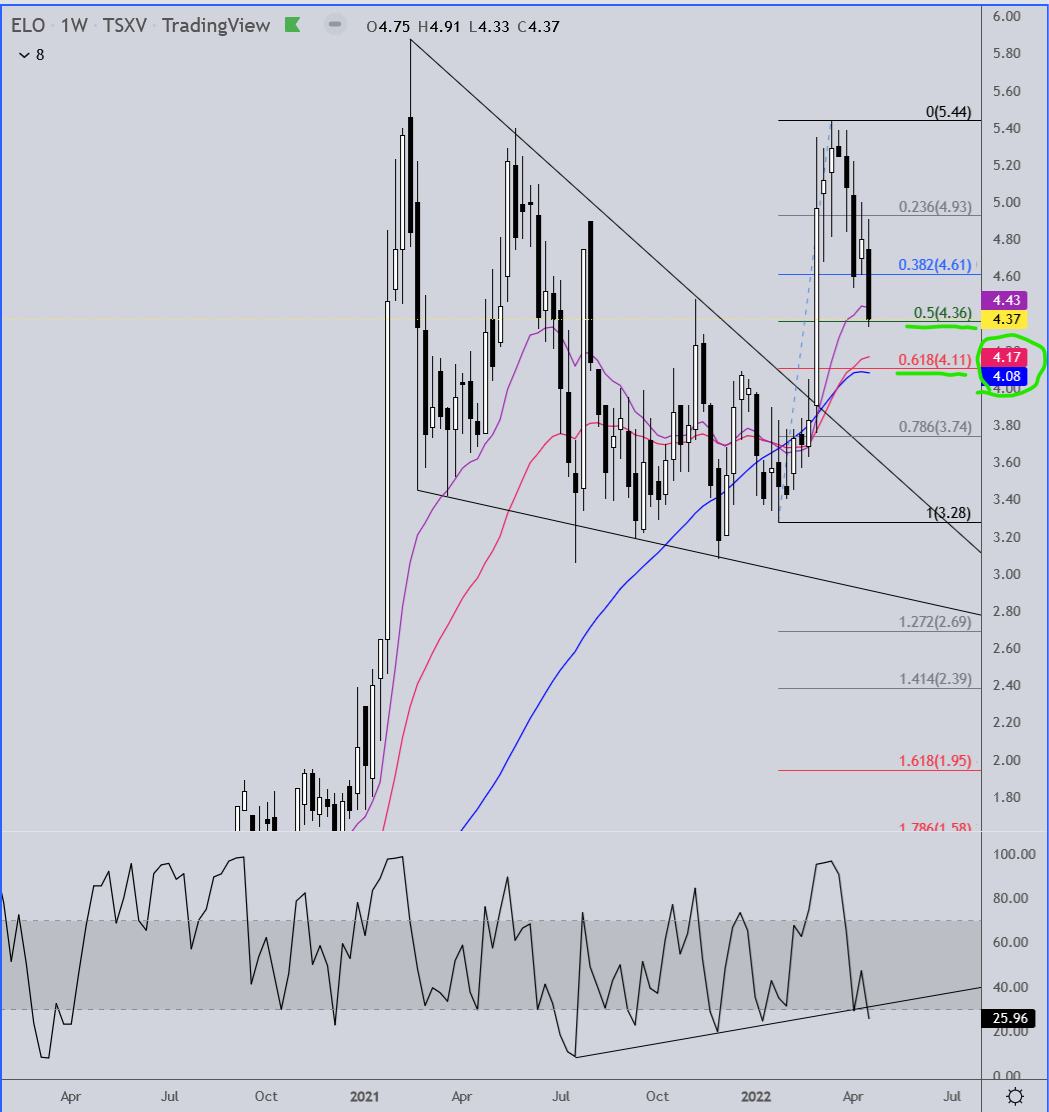
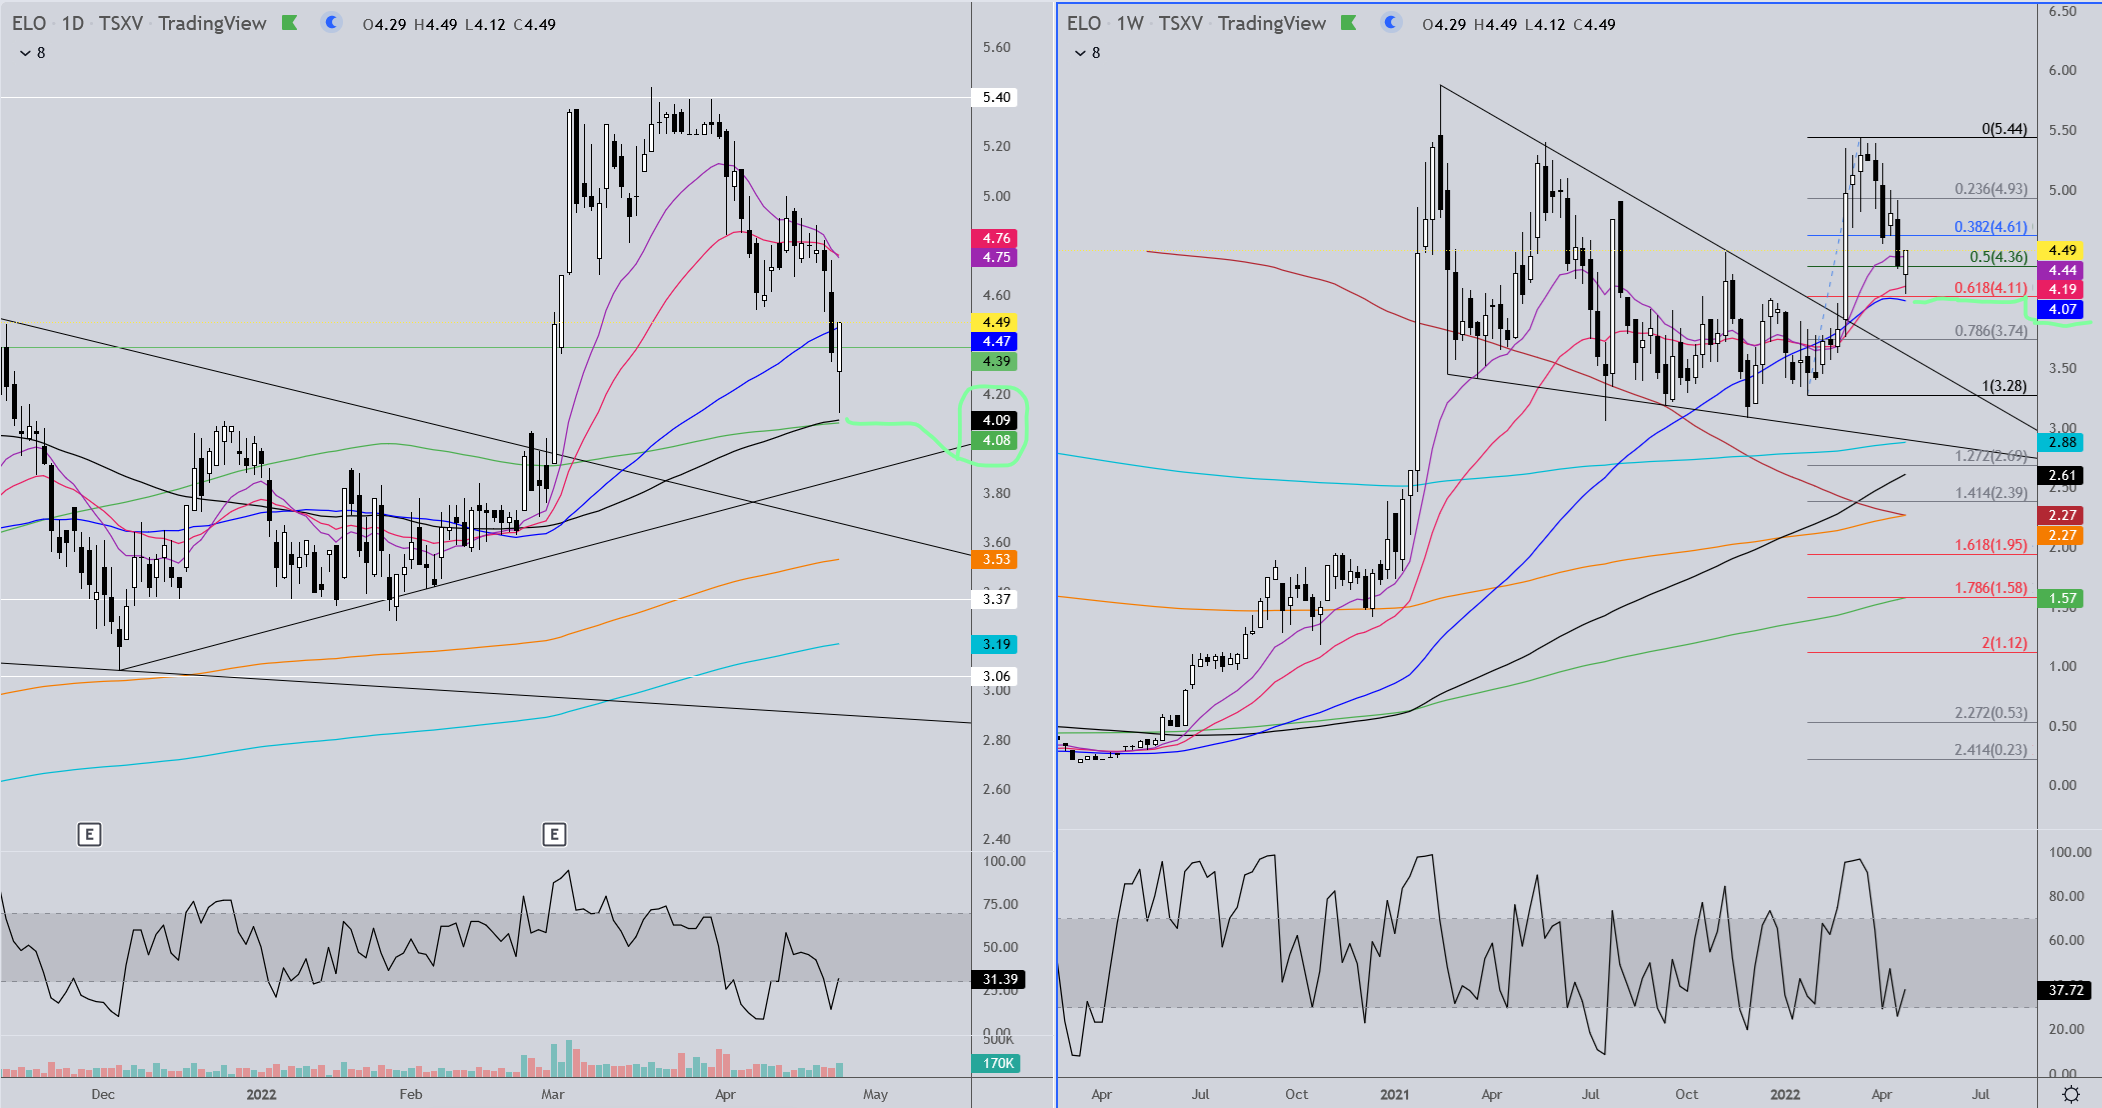
ELO weekly… The black triangle is a bullish falling wedge which ELO broke out of. The red line at 6.39 is the ultimate target price of this breakout. ELO ran to a major resistance area of 5.40 (#1 on the chart) while hitting an overbought condition on the RSI study at the bottom of the chart, and now we are in the midst of a retracement. $4.50 is the .618% retracement of the move and we came within .04 of hitting that yesterday so I didn’t leave it on the chart. #2 on the chart is the shortest MA I use, currently at 4.39 and there is also some horizontal support there. Considering how ELO traded yesterday I fully anticipate visiting that level early next week. If our uptrend is VERY strong then I would expect that support level to hold and we perhaps consolidate for a bit before heading up again. If it doesn’t hold, although I’m sure many longs would find it frustrating, it does not indicate anything bearish for the stock. There is a stronger horizontal support level around 4.09 and two MA’s right there (#3) at 4.11 and 4.08. If that price level is visited I expect the RSI will hit trend line support as well (#4).
1 Like
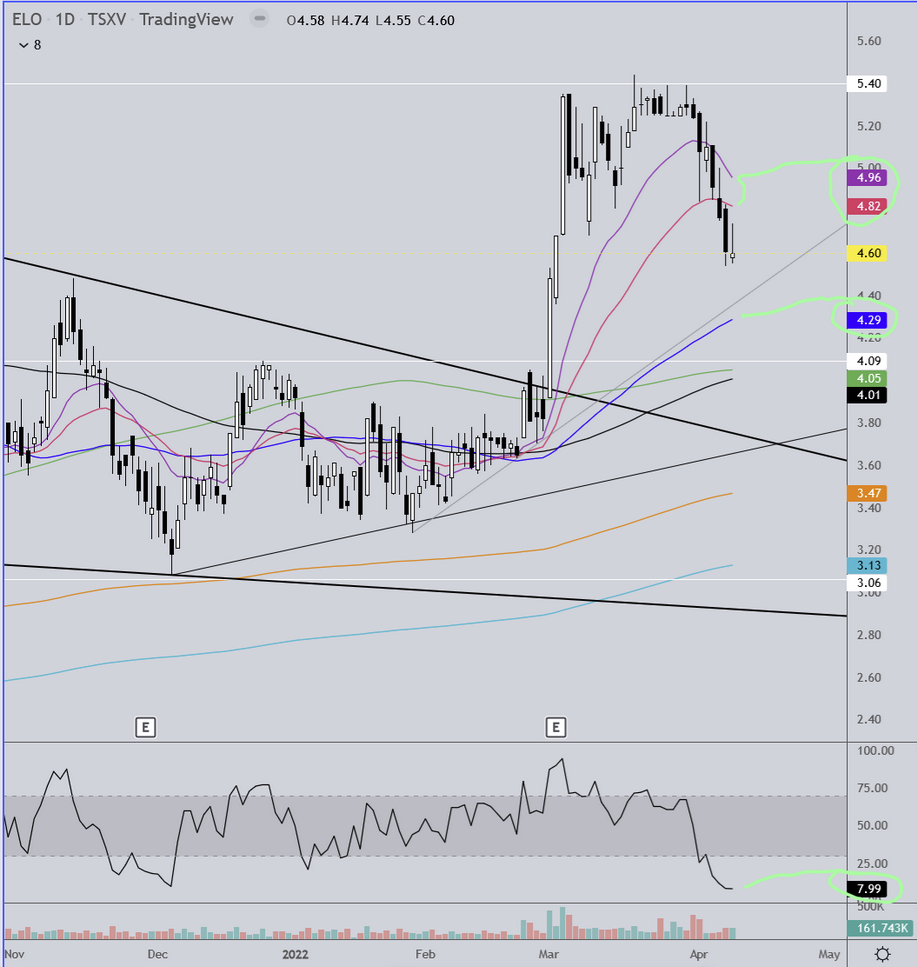
In the event that the stock gets a bounce and/or gaps up at the open on Monday, which is very possible since the RSI on the daily chart is extremely oversold, ELO will likely test the underside of the two MA’s above it currently at 4.82 & 4.96. (I also highlighted the next level of support at the blue MA along with a trend line).
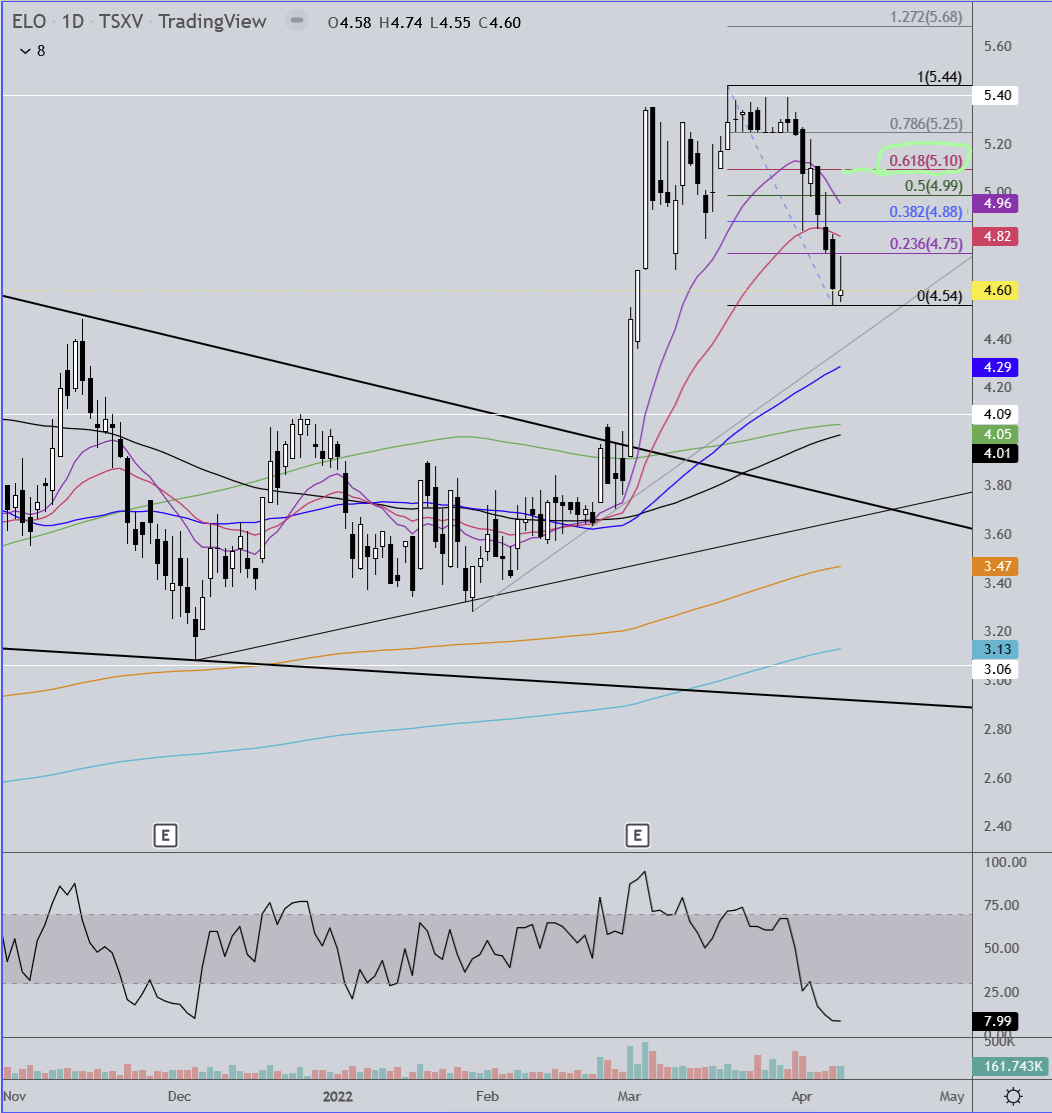
If ELO manages to push through those two MA’s it then needs to get through the 50 & 61.8% retracement levels on the final chart. So next week if the stock doesn’t move any lower than our 4.54 - 4.50 low from last week and we get a close above $5.10 then there’s a good chance this retracement is over and we can start looking towards revisiting and potentially moving up through that $5.40 level.
I currently don’t expect this to be the case, but that doesn’t mean it won’t happen.
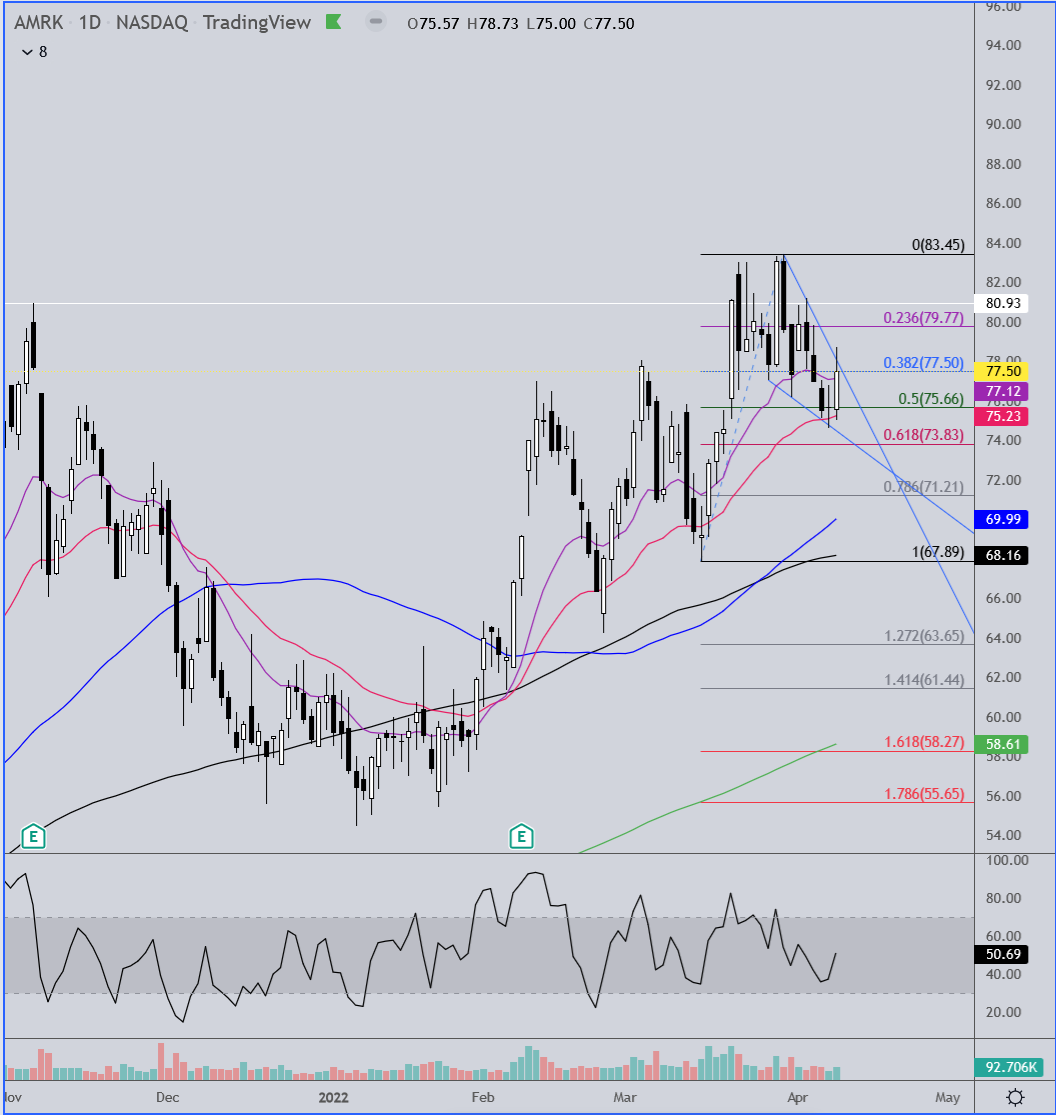
AMRK
This one is pretty thinly traded and has a ridiculous spread. I don’t usually trade these kind of stocks but the company is a leading bullion dealer and a person I have come to recognize as being worth paying attention to is of the opinion that the company is likely to announce a special dividend and forward stock split in the near future, perhaps around its next earnings report on May 10. This is speculation at this time and not fact. Regardless of this, I have been accumulating the past few days because the stock is making a bullish pennant formation upon hitting new a all-time high.
The most recent two pullbacks prior to the current have gone to and a bit below the .618 retracement level and the red MA on the chart. So far it has not retraced as far but had a nice bounce in late trading Friday with a false breakout of the pennant before pulling back inside. Monday will either get the stock closer to the typical Fib retracement or get us a break out and potential new highs by the end of the week providing the pennant plays out in full during the week.
Here’s an update to the ELO chart which I posted on another forum first so ignore what doesn’t make sense. I’m too lazy tonight to edit it out!
Ok gents, here’s the ELO chart as I see it. It’s pretty much the same as the last time I posted. We came down below my fastest moving average and closed a tad below it, but we went right to the 50% retracement level of the range of our last swing low-swing high. Now the question is do we bounce from here or do we have lower to go? Based on how ELO closed last week and also how the gold and silver futures have been trading I expect we’ll at least trade down to the next lower zone of support between 4.17-$4.08. When the market closes next Friday we’ll have a much better idea of things. If ELO ends up closing above 4.43 for the week then we’ll know the uptrend is still very strong. Same even if the weekly candle closes above 4.17-4.08. If those levels don’t hold and we lose $4 then there’s a good chance we see mid-3.80’s all the way to the low 3.50’s. So imo next week is a significant one not just for ELO but the miners and gold/silver in general. To keep it uber-simple for my friend Dreadnought, for ELO to close at or above 4.08 is a good sign for the strength of the trend and the higher the better. Below 4.08, not as good unless you want to buy bargain shares, which I’m happy to do. The first chart I’m posting is the weekly interval and the second chart is the daily. The 4.17 - 4.08 price level is significant on both charts, imo.
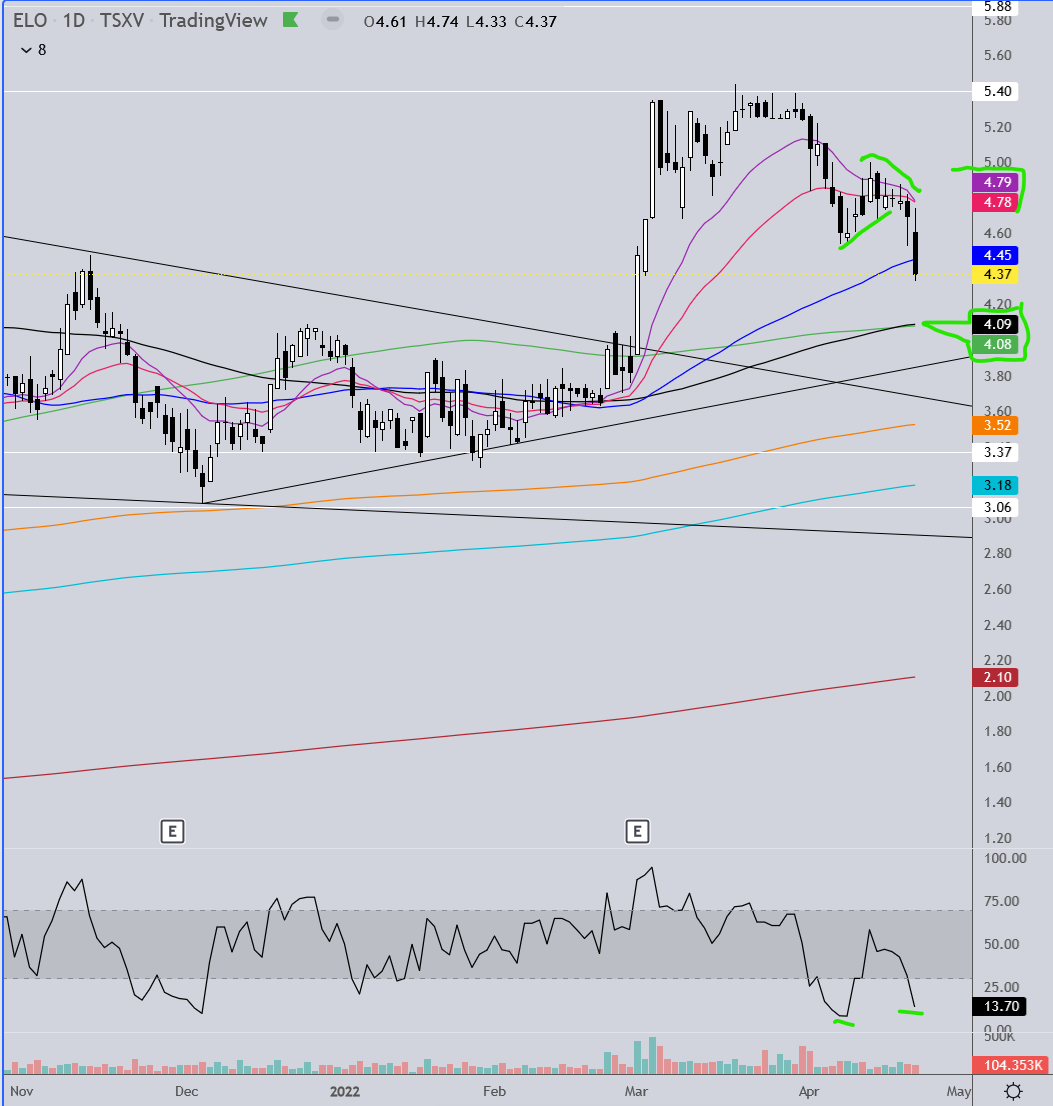
The last time I posted the daily chart I mentioned for the uptrend to resume ELO needed to get back above the purple and red MA’s. We tried but in the end failed, making a bear flag which we dropped from later in the week. One potentially good sign on this chart is the RSI is oversold and we have bullish divergence, meaning price hit a lower low but RSI did not, so perhaps we’re ready for a bounce next week at some point.
1 Like
ESK
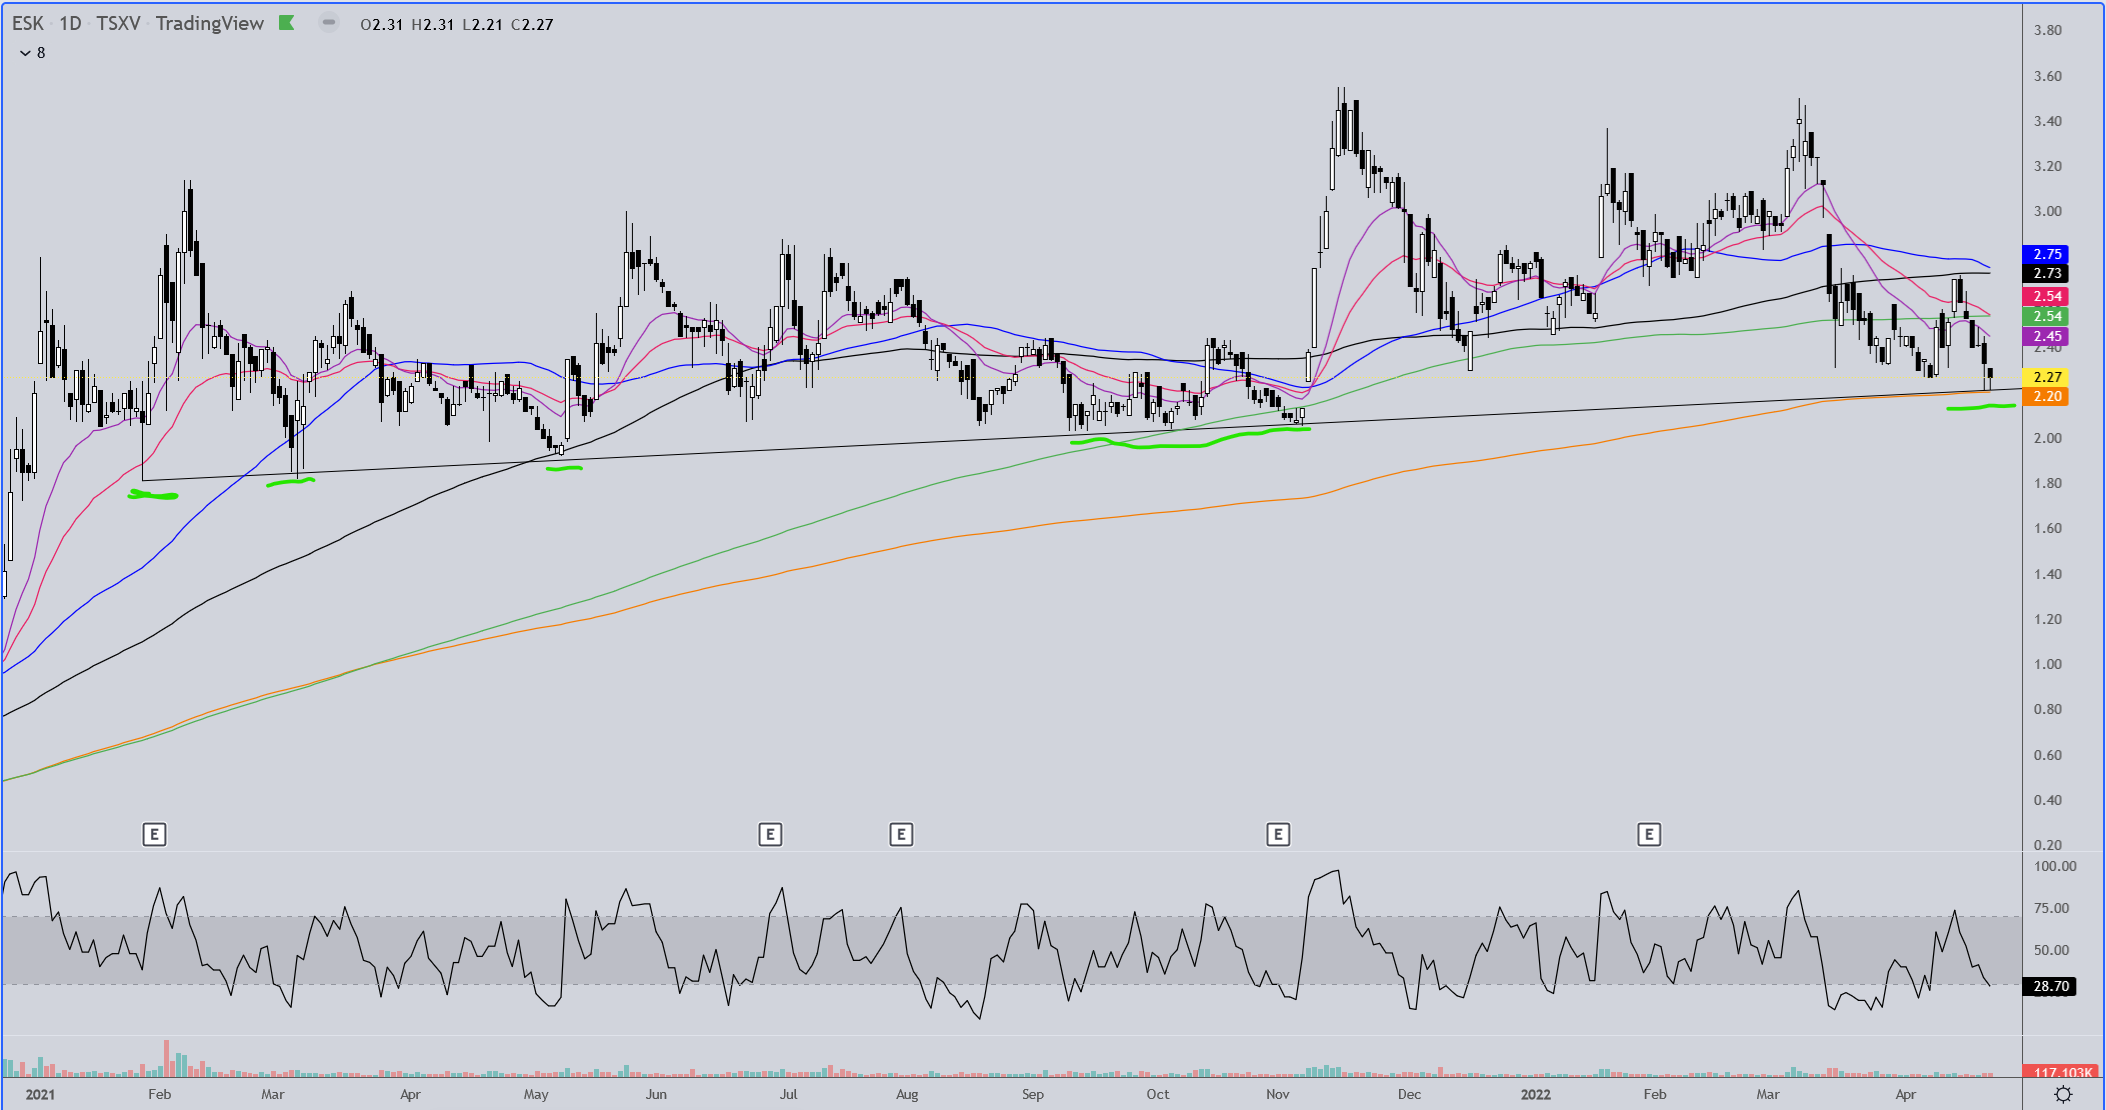
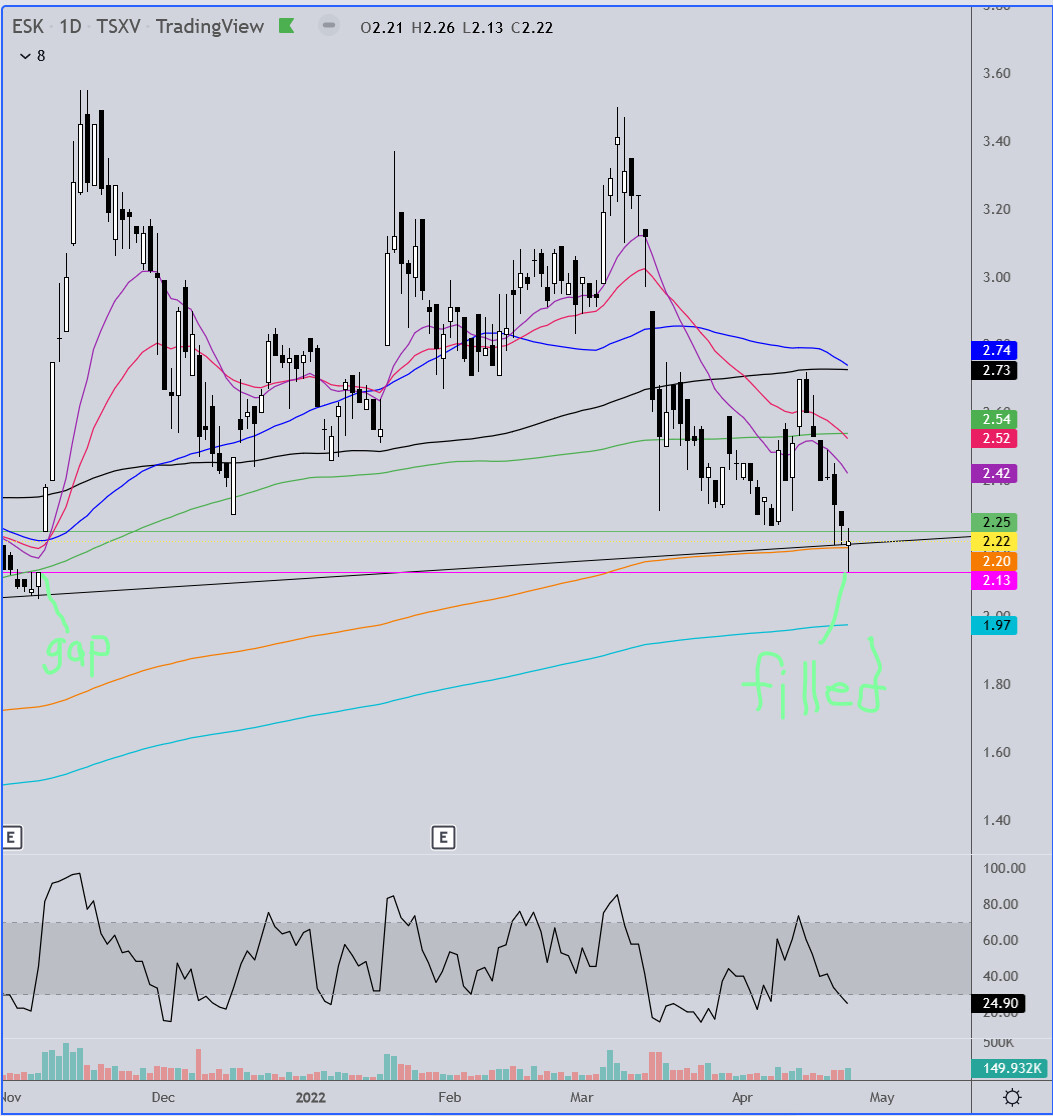
Friday ESK again touched strong trend line support.
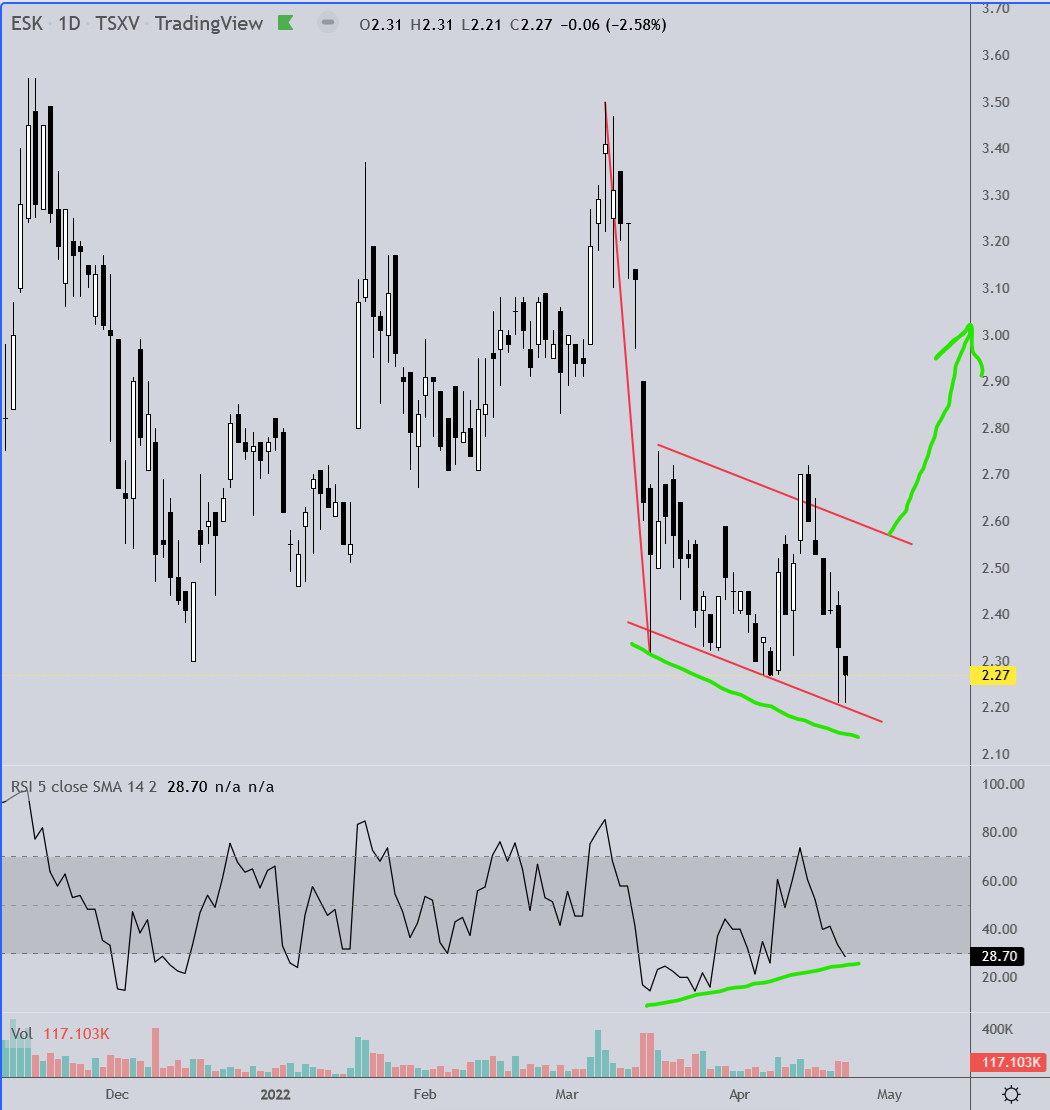
What is (usually) promising is this formation which is not a bear flag due to the downward slope of the “flag”. Often when I see this “hockey stick” formation it is a bullish sign that the stock inevitably launches up out of. It’s not 100%, but in my experience better than 80%. Also there is bullish divergence on the RSI, as price has hit 3 new lows during the formation of the hockey stick, RSI has hit higher lows, typically an early signal for a move higher, imo.
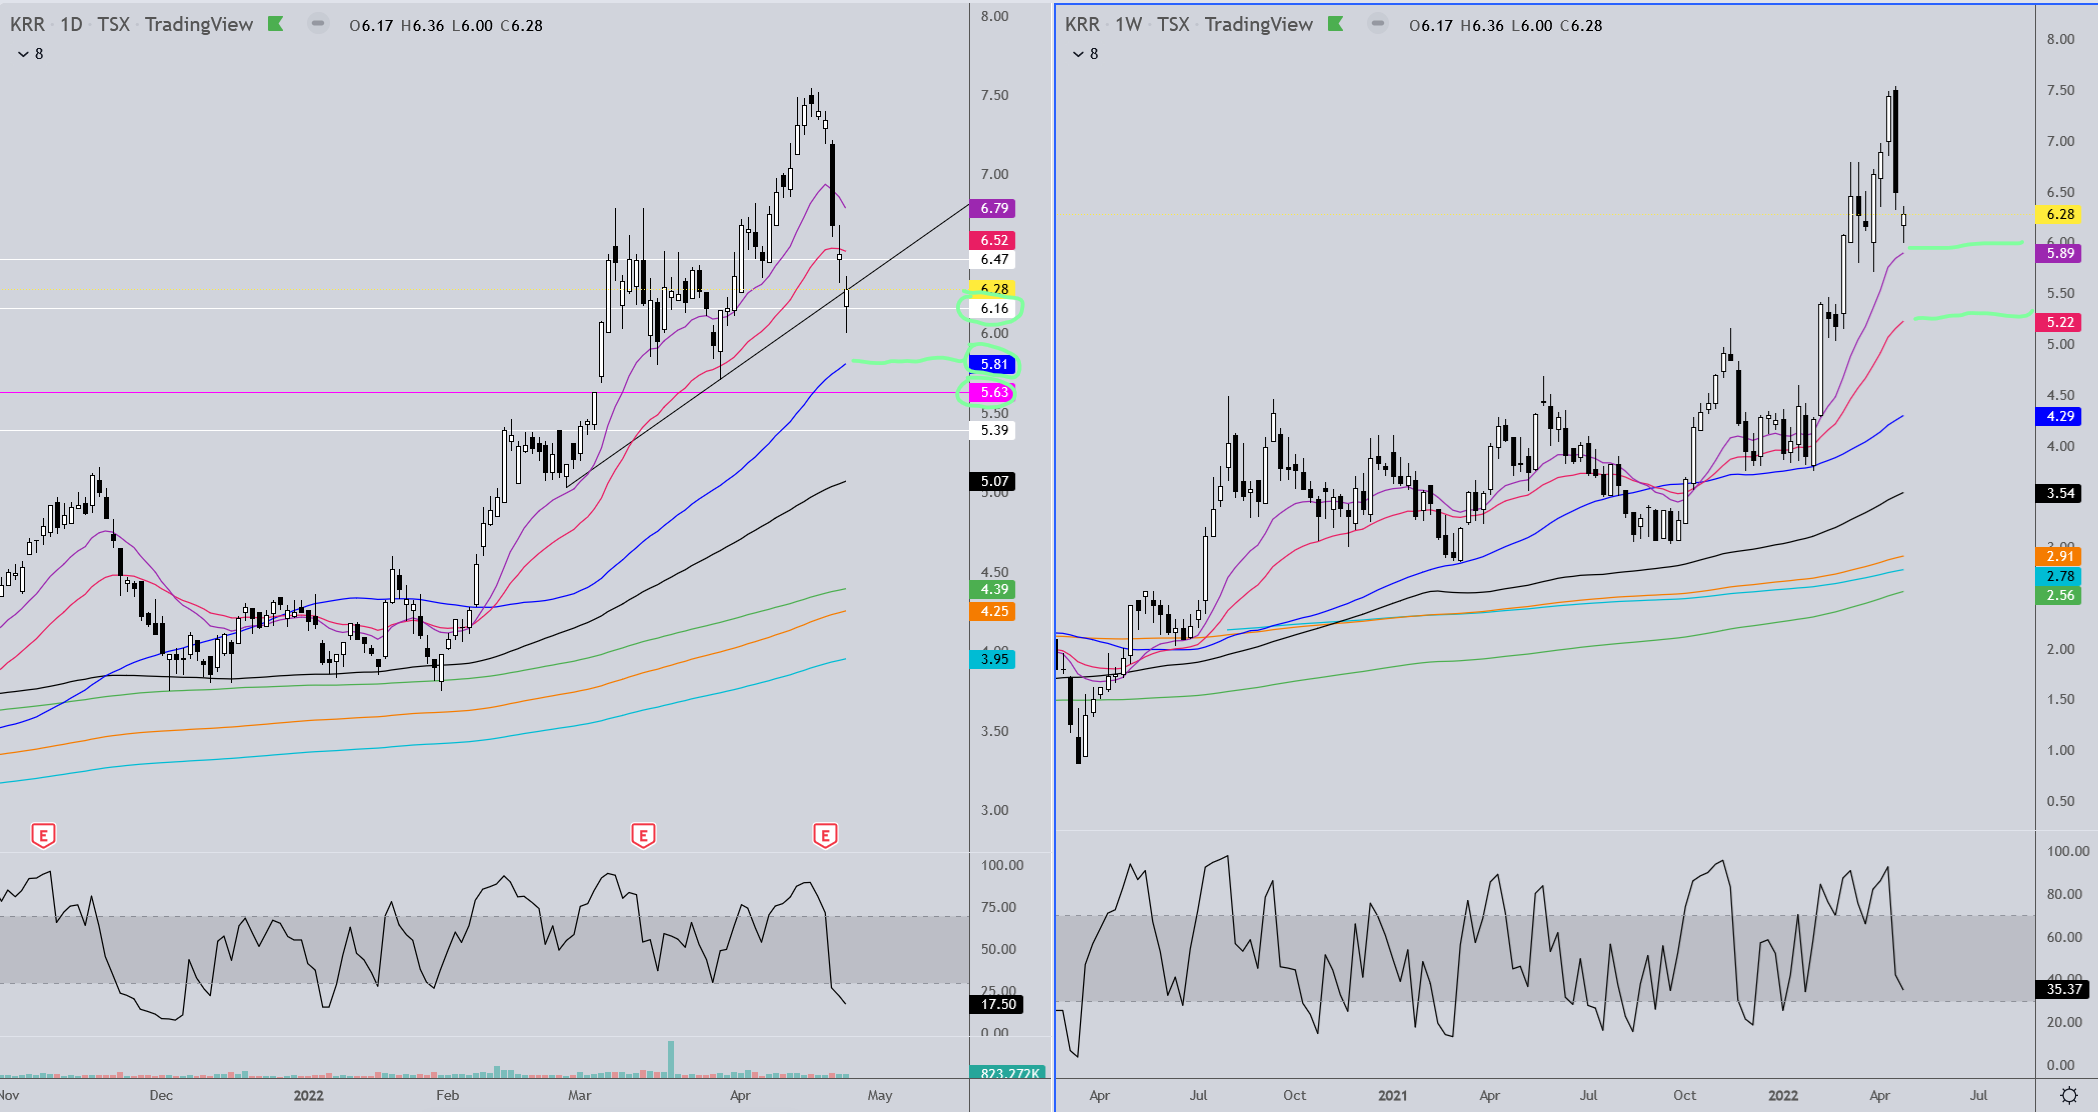
KRR Update
The weekly chart shows KRR has retraced a bit over 61.8% of it’s previous range and got a little bounce from the lows. There’s an uptrend line just below along with first MA support that will be higher than 5.84 if/when it gets there.
The daily chart shows price moved into a support area last week and buyers did step in late in the day Friday. They didn’t get a close above the red MA and if gold and silver trade lower at the open like they are now then KRR is likely to go lower before hitting solid support. The trend line just below is untested so it is likely to be breached, but the close is what will be most important in regards to the trend line. Right now I’m pretty convinced we’re going to test the blue MA here, which is right around the same level as the first MA on the weekly chart. There is a small gap to fill at 5.63 as well. I wouldn’t be in too much of a hurry to be buying miners right now as it looks like the sector will be trading at least a little lower before we bounce.
1 Like
ESK Daily
We got a gap fill that I wouldn’t have noticed had I not seen another post about it elsewhere. We also popped back up and closed above trend line and MA support. Nice volume as well!
1 Like
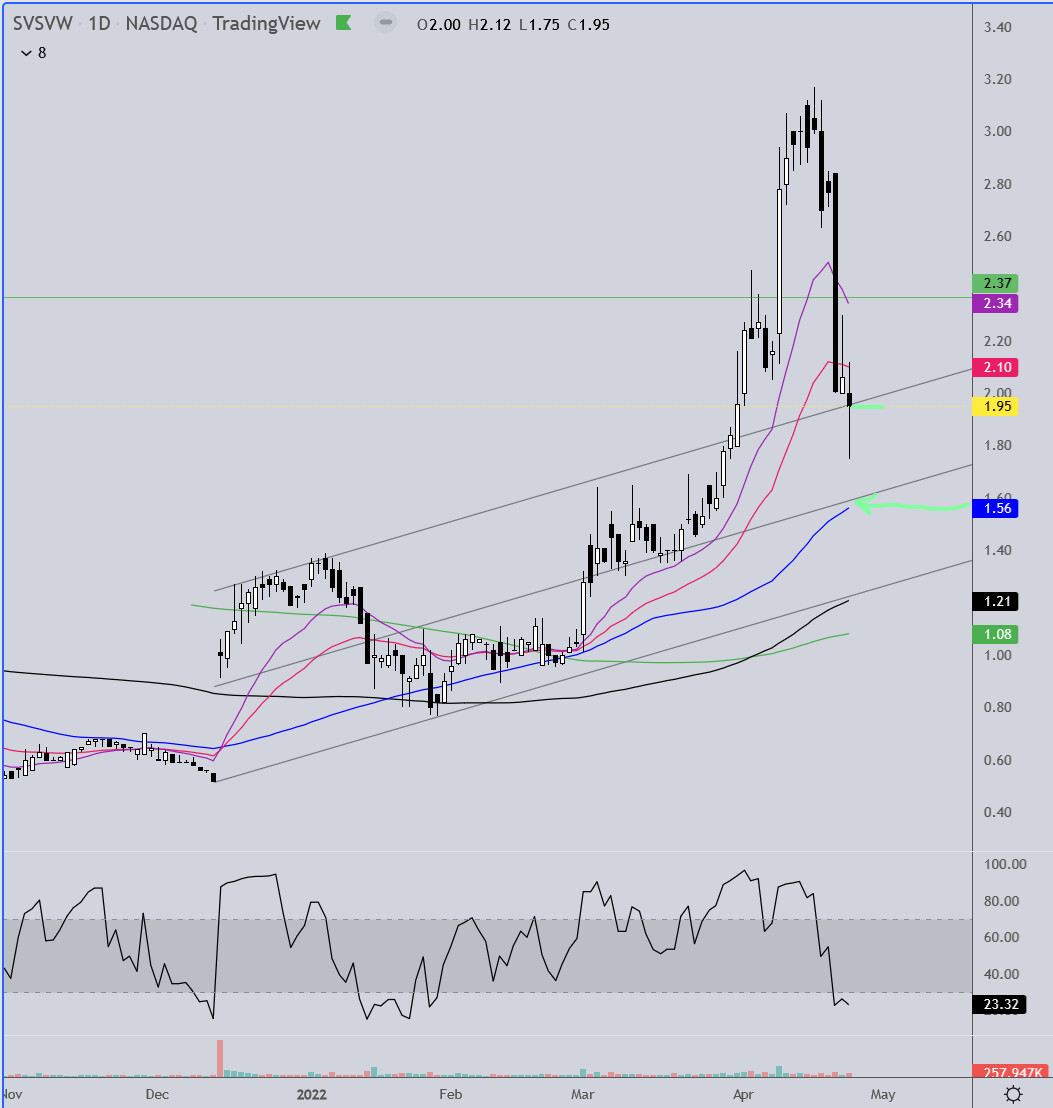
SVSVW Daily
The upper channel line may be uptrend line support here. If it falls further I’ll look to add at the center line/blue MA.
KRR Daily/Weekly
The stock came .11 from hitting the weekly violet MA. If that’s as much of a dip as we get then the trend is still very strong. It feel below horizontal support at 6.16 but had a strong second half recovery. The close right on the trend line has me wondering if it may dip down and tag the blue MA and maybe fill the gap at 5.63 before this is over.
1 Like
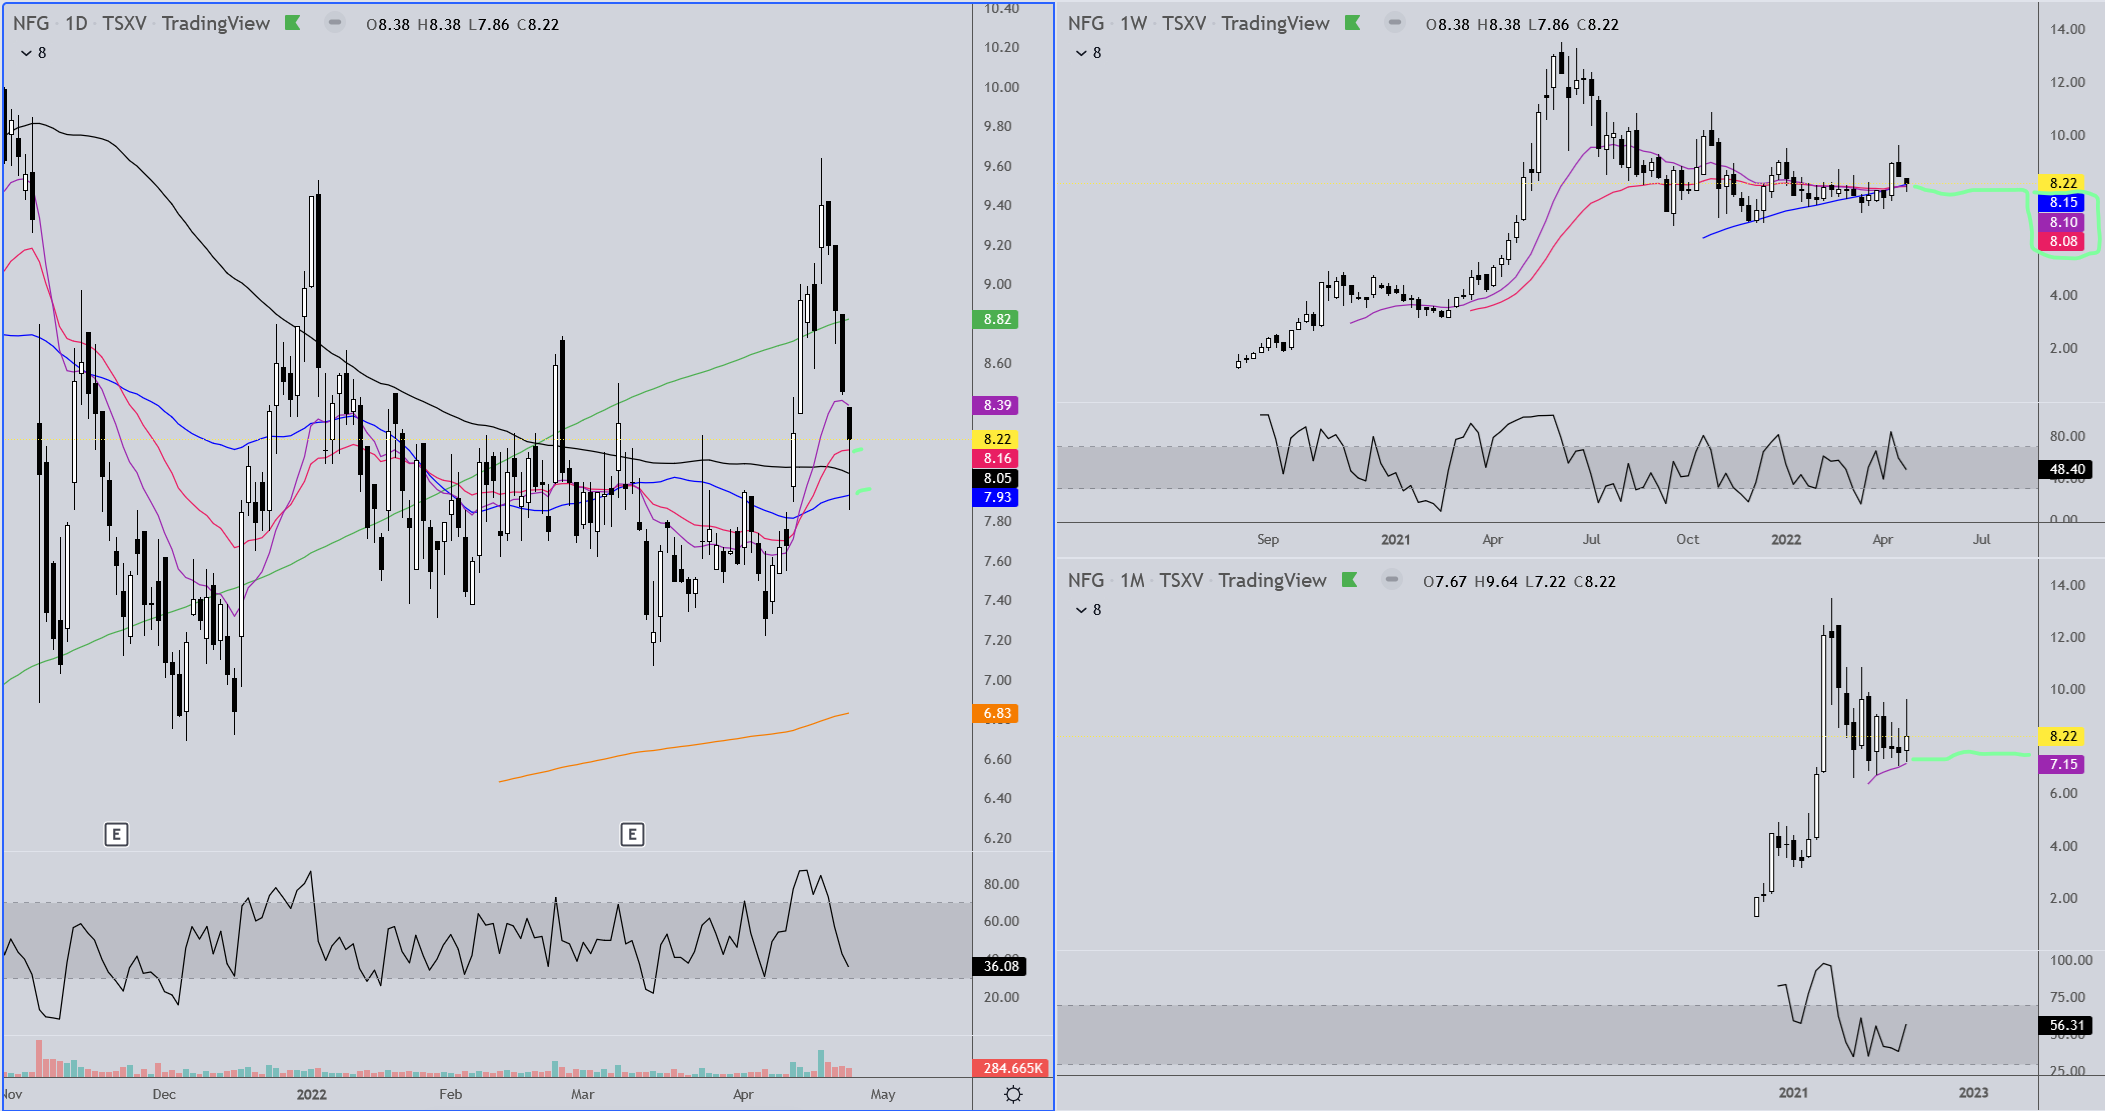
NFG had a nice recovery today as well.
A reminder to people who peruse this thread… if you have a stock you want me to do a chart on, post it here and I’m happy to get to it when I can. You can ask me to do charts on all 47 of your stocks (Easy! lol) but I can’t promise I’ll get to all of them.
Can you do a chart on SAND and AG for me?
1 Like
Thanks TR!
OK, not all 47 this time. Rest assured, that list will be considerably smaller by the the end of the year! But one I had at the bottom of that wildcard list is an Australian stock, Neometals Ltd., just had some news out. I’ve held it since 2018, but the ticker RRSSF has relatively low volume.
Neometals JV Gets Permit for Lithium-Ion Battery Recycling Facility in Germany
Published: April 22, 2022 at 2:21 a.m. ET
By Kyle Morris
Neometals Ltd. said Friday that its joint venture, owned 50-50 with SMS group GmbH, has received an operating permit for its commercial lithium-ion battery recycling facility in Hilchenbach, Germany.
The mineral project developer said commercial operations at the Primobius GmbH joint venture’s facility are expected to start in mid-May.
The chart on Neometals (RRSSF, ASX:NMT) is starting to look quite interesting. SAND is another one I’d also be interested in seeing your chart analysis one. I’ve held a position and accumulated since 2016. It’s also on my wildcard list. One other in the Lithium space that has an interesting chart is OROCF, not on my list and not sure when I first picked it up as Fidelity is missing my acquire date. It changed it’s name in a merger from Orocobre Ltd. with Allkem LTd. The OTC stayed as OROCF, but the Australian sticker is ASX:AKE.
“The stock market is a device for transferring money from the impatient to the patient” - Wilbur Ross
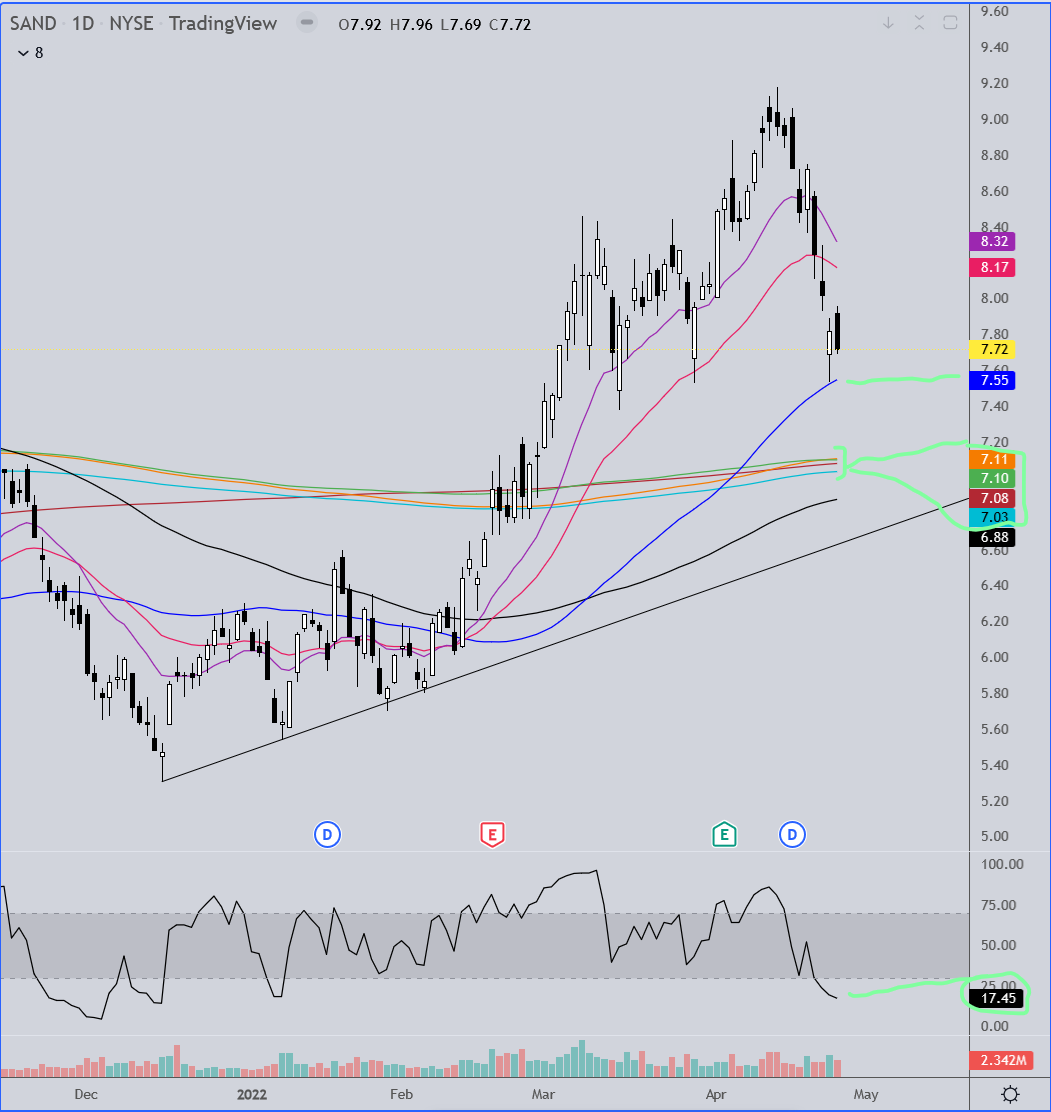
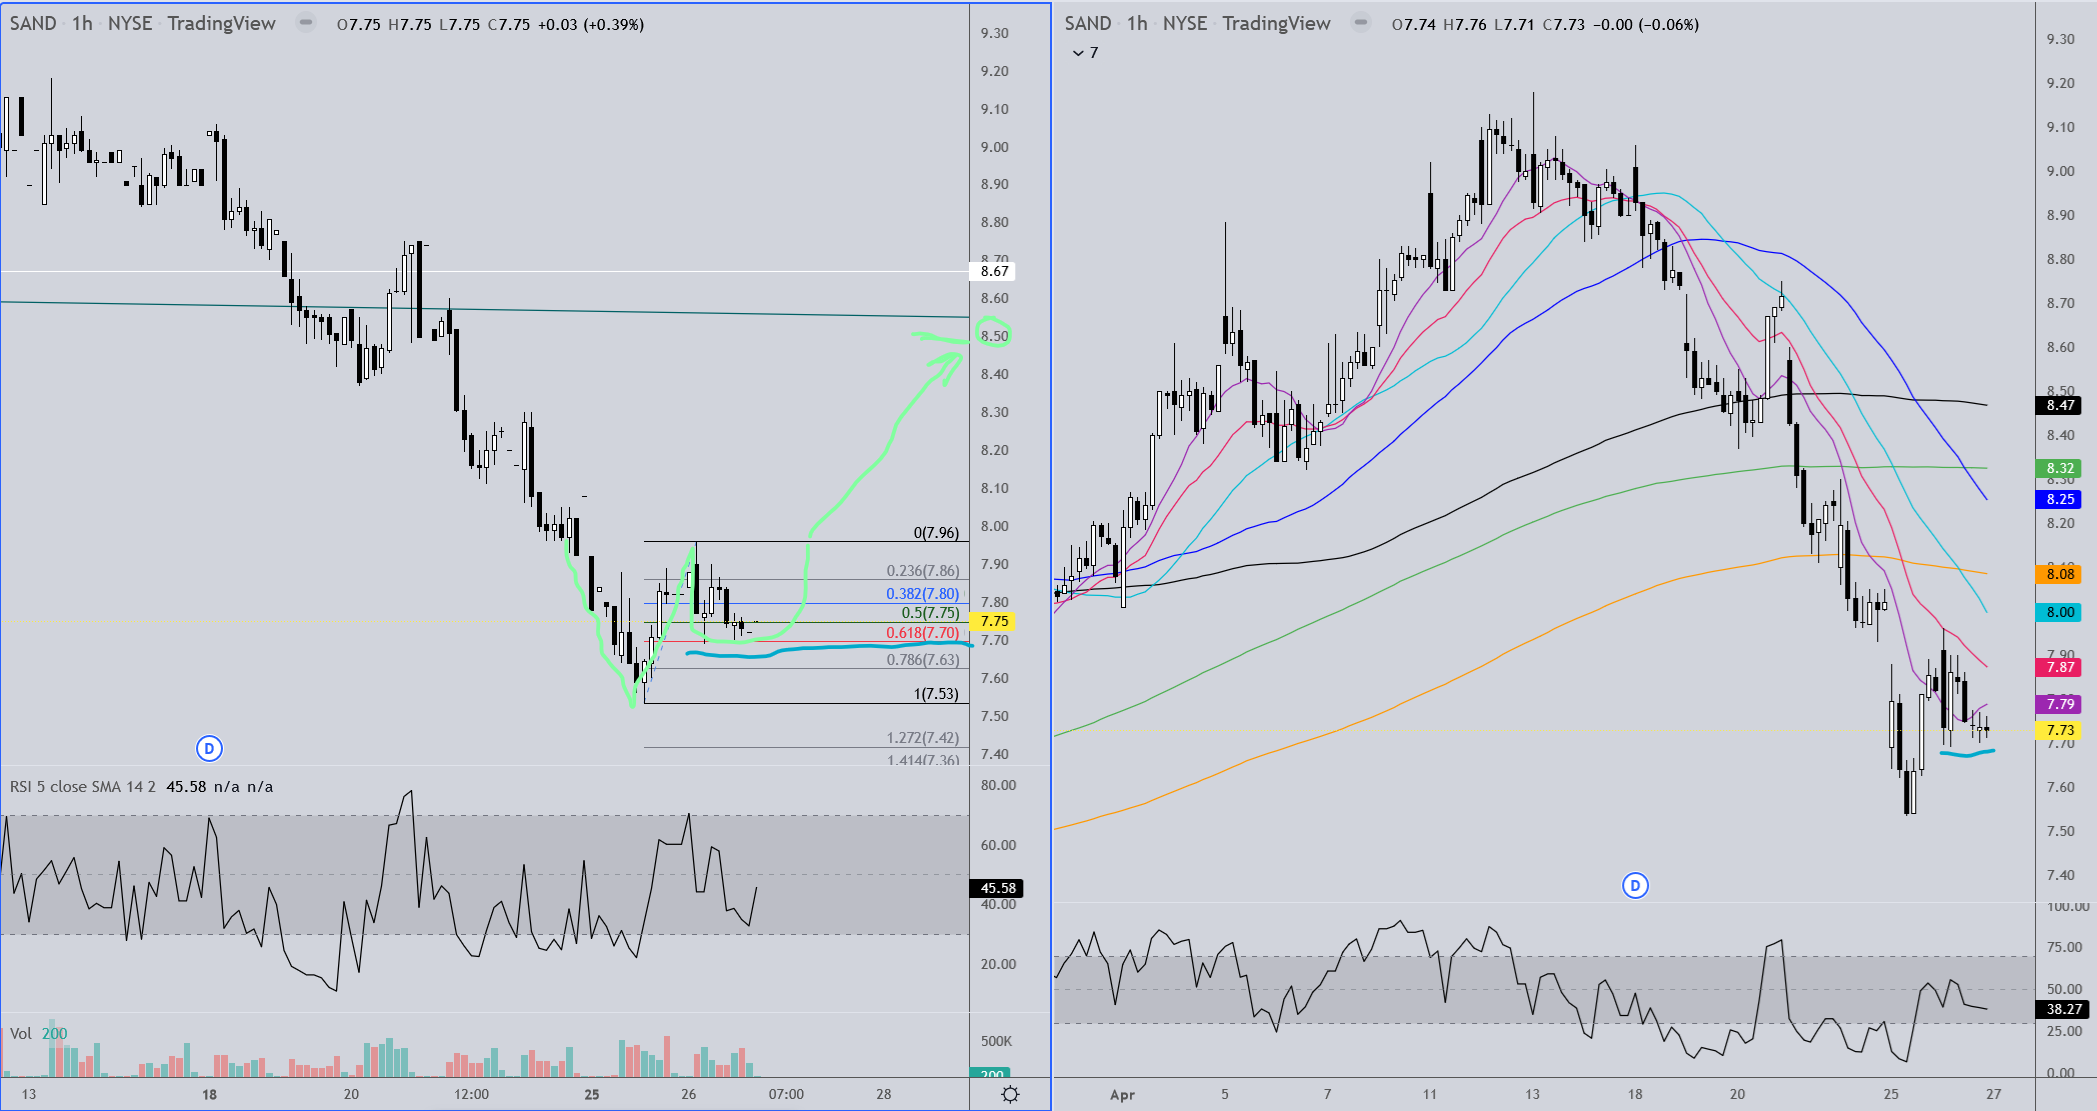
SAND Daily Interval
The stock pulled back to the blue MA yesterday and had a fairly strong close. Today it appears to have filled a gap first thing in the morning and then spent the day retracing a portion of Monday’s late day gains. It did not dip below the opening price of yesterday’s candle which looked interesting to me so I checked out an intraday chart which is next. Sticking with this chart for now though, you have support at around 7.55 if there is a further pullback tomorrow. If that MA support is lost there is a nice group of MA’s between 7.11 - 7.03. If it ends up going lower you’ve got the black MA which will be around 6.88 when/if price gets there and then you’ ve got the lower trend line support currently at 6.65.
If the stock bounces from here it’ll have to move through the red and violet MA’s which will both be a little lower tomorrow, and then a zone of resistance between around 8.30 - 8.46. If it gets through that area you should be heading back to previous highs.
On the hourly interval there appears to be an Adam & eve bottom forming. The 7.70 Fibonacci retracement level doesn’t have to hold, but it would be nice if it did and the stock moved back to 7.96 after completing the “eve” portion of the formation. From there a breakout would take you back to 8.50.