Charts for Metals and Stocks

Too late!

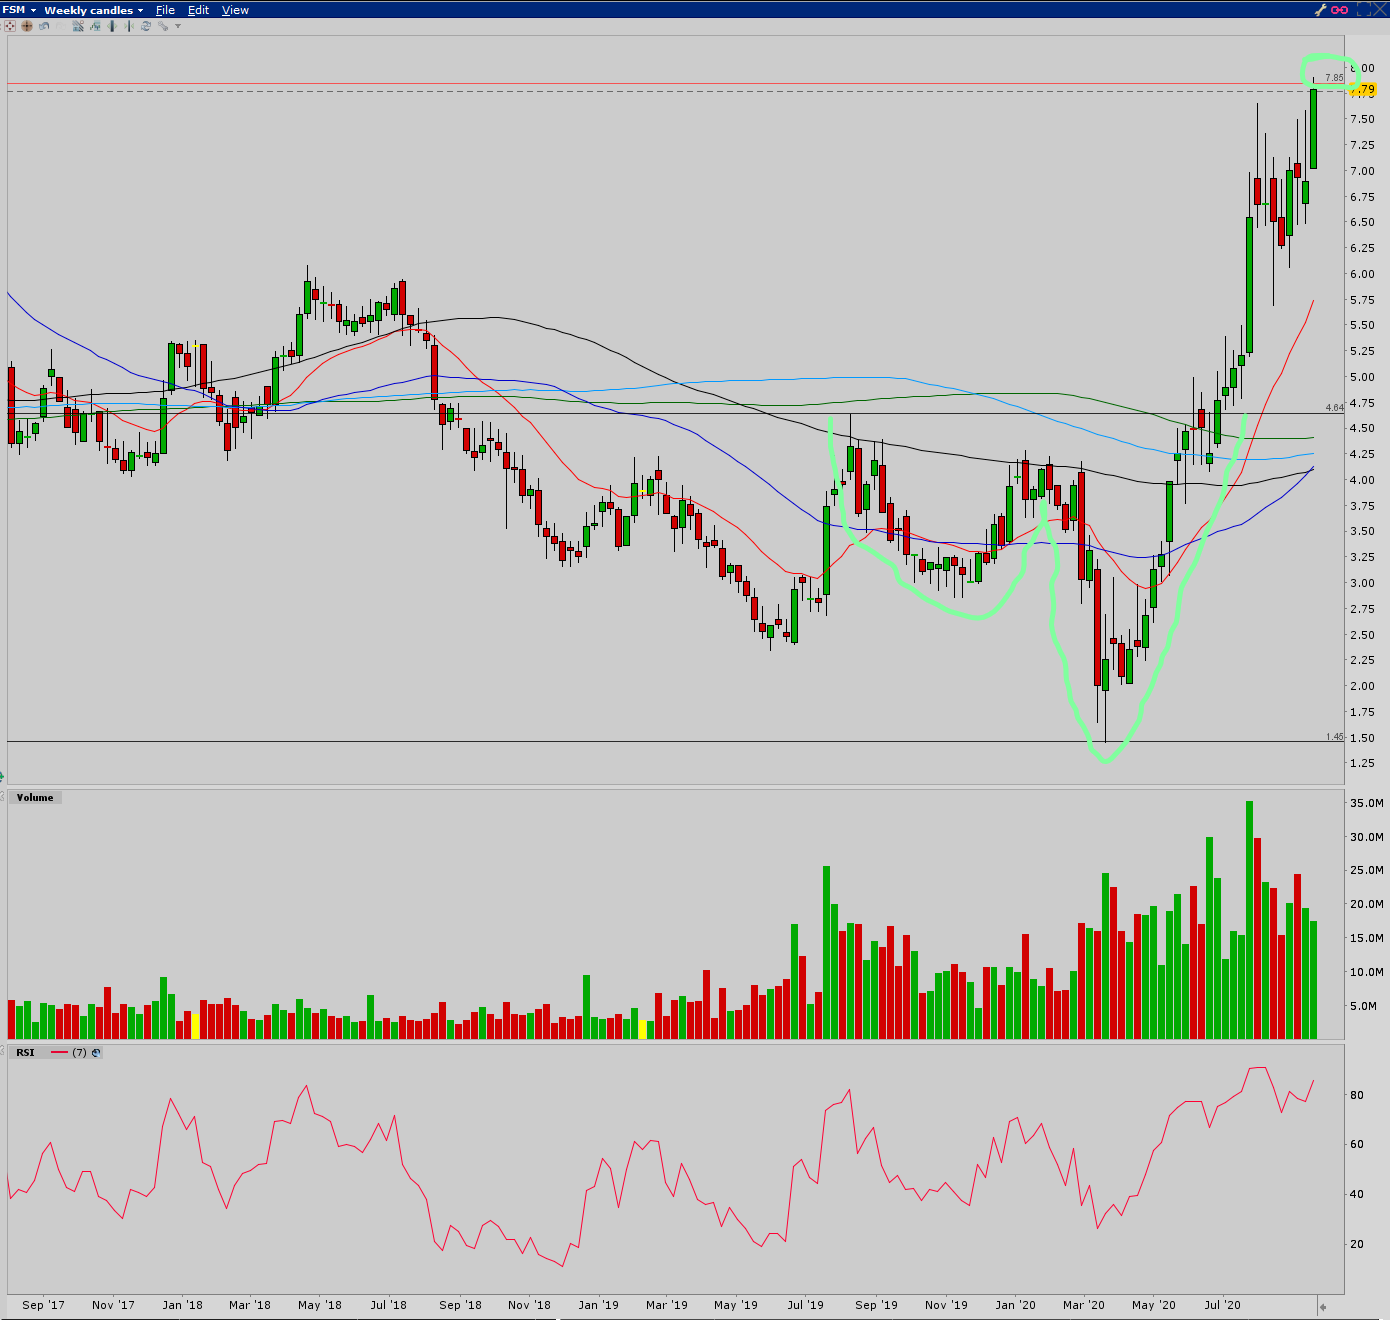
FSM This chart was fun! Weekly interval shows an EVE & ADAM, so Fortuna is apparently a chivalrous silver company. Funny thing is, as of yesterday the target was hit. The chart is nice to show you this, but it doesn’t help much as far as what to do next…

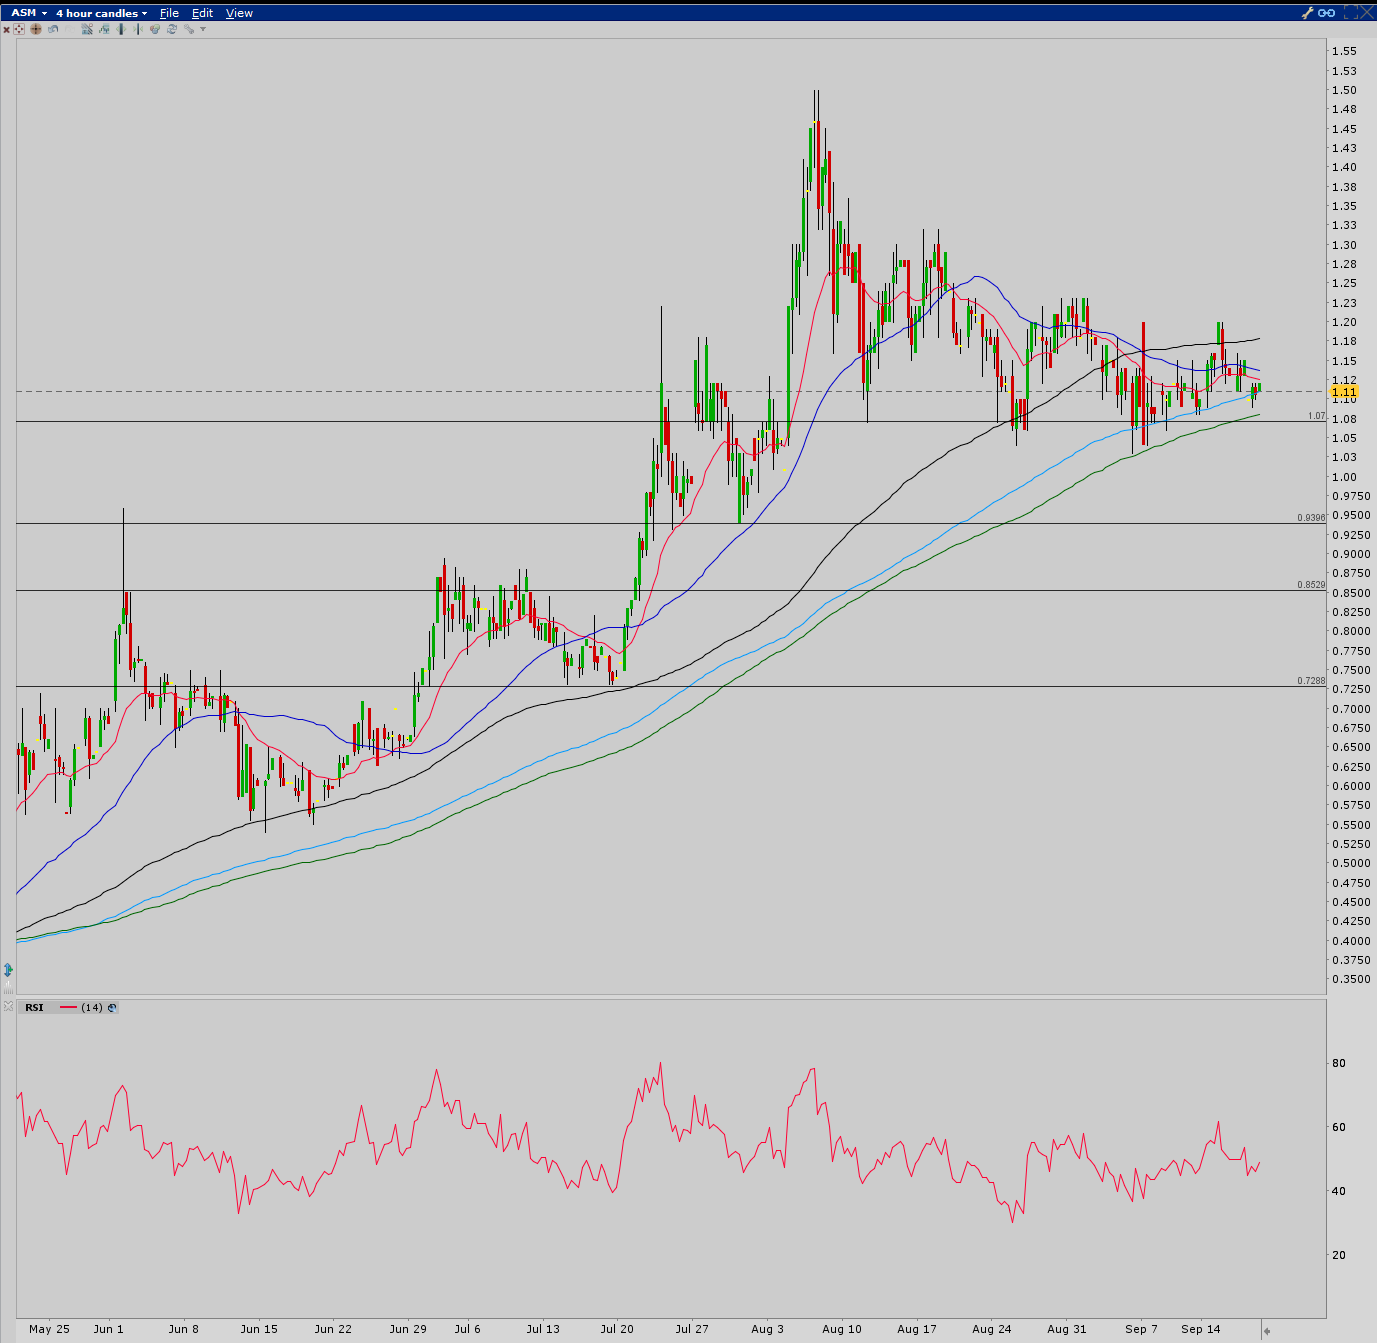
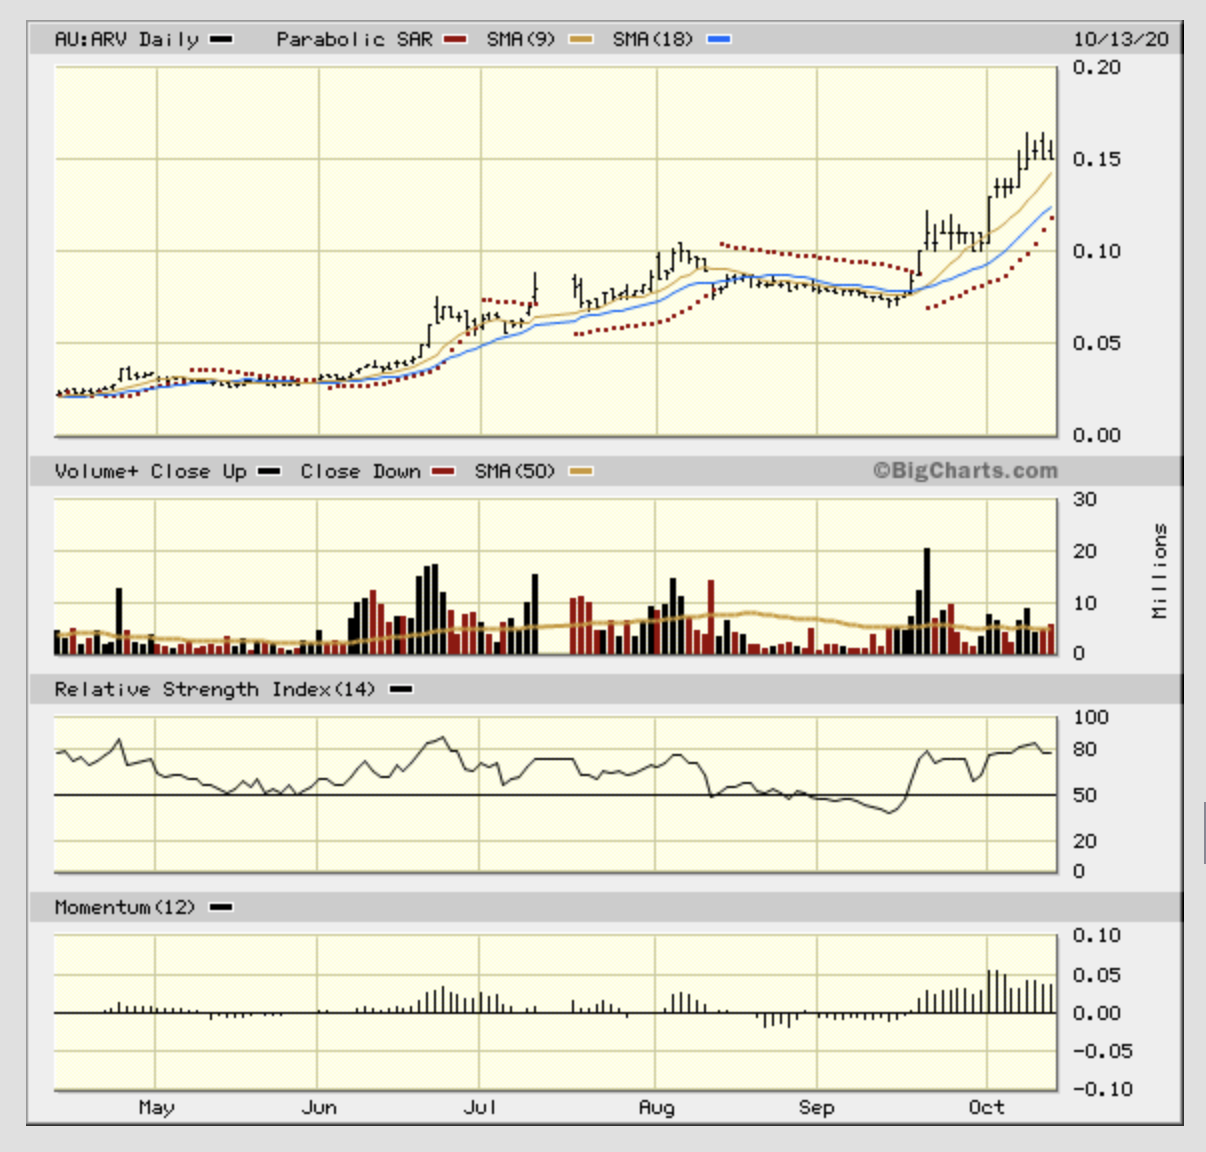
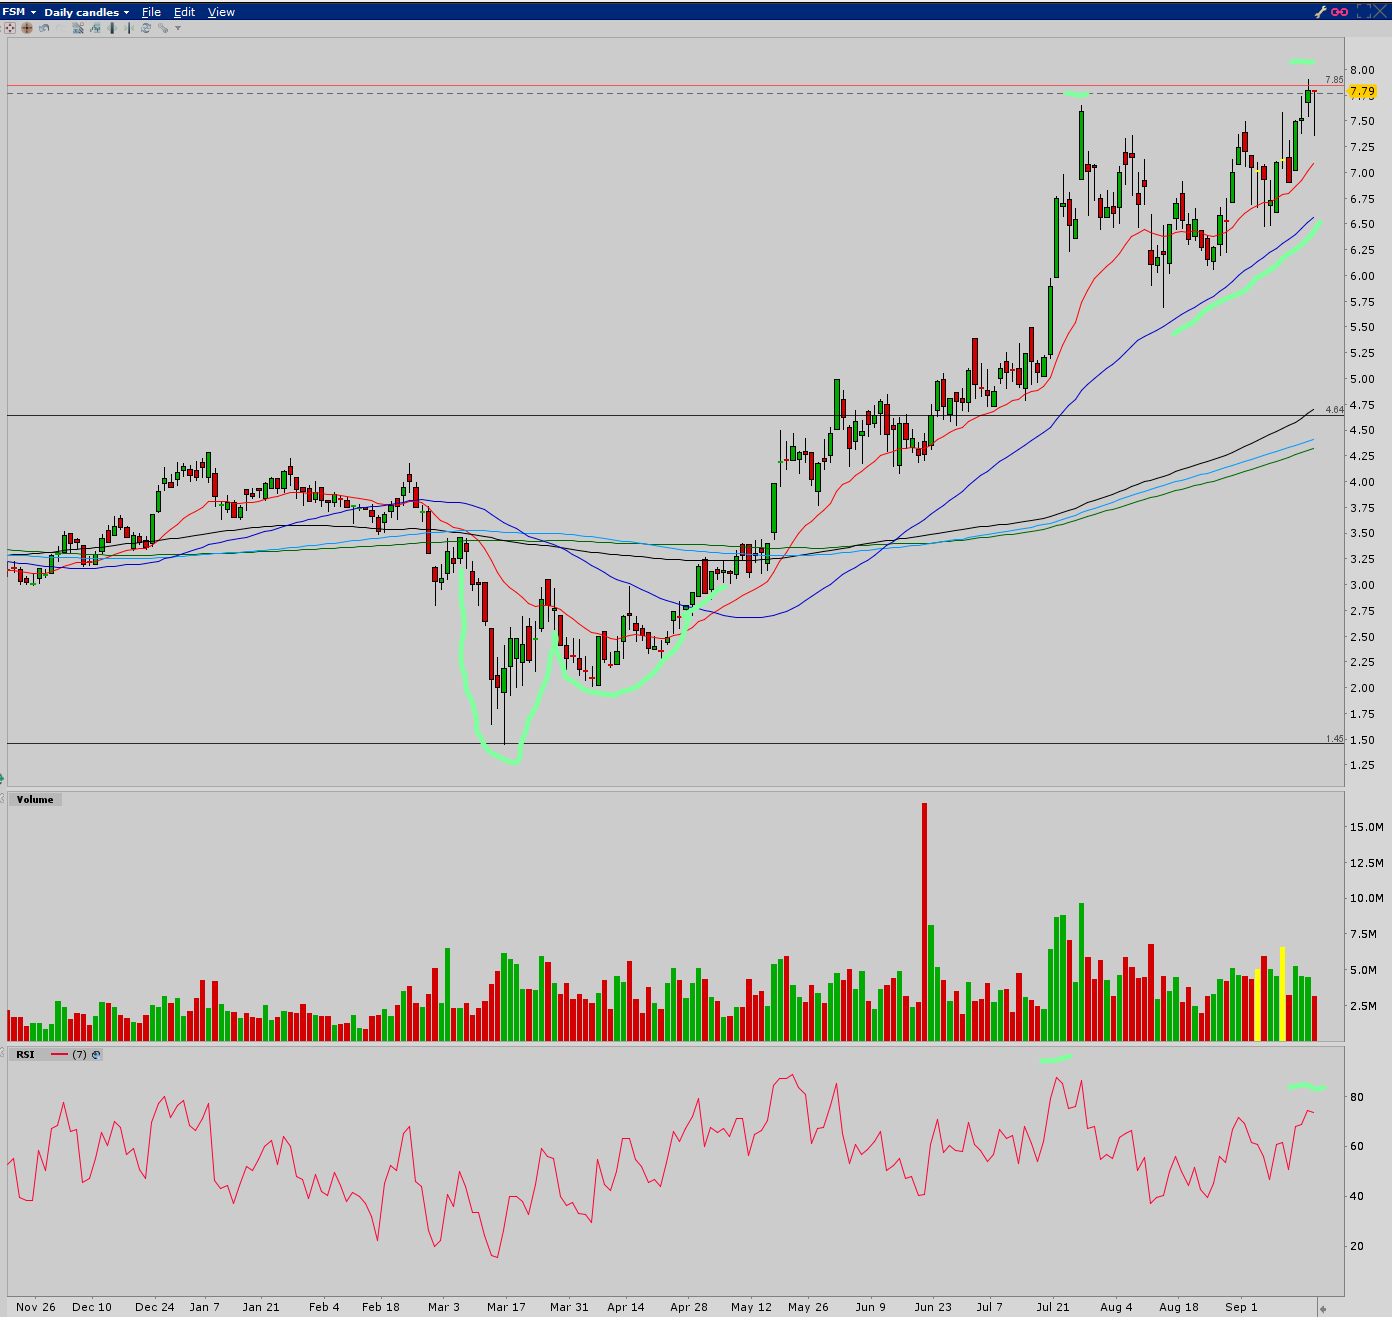
So, what to do next? I don’t really know, but the daily chart might be giving a hint. I couldn’t help but show the obvious Adam & Eve formation that was stealthily hiding within the larger Eve & Adam. Anywho, note the blue 50 MA offering the threat of support anytime the red 20 EMA was looking weak. Note also the last two high prices and the divergence on the RSI. Early sign of selling to come?..

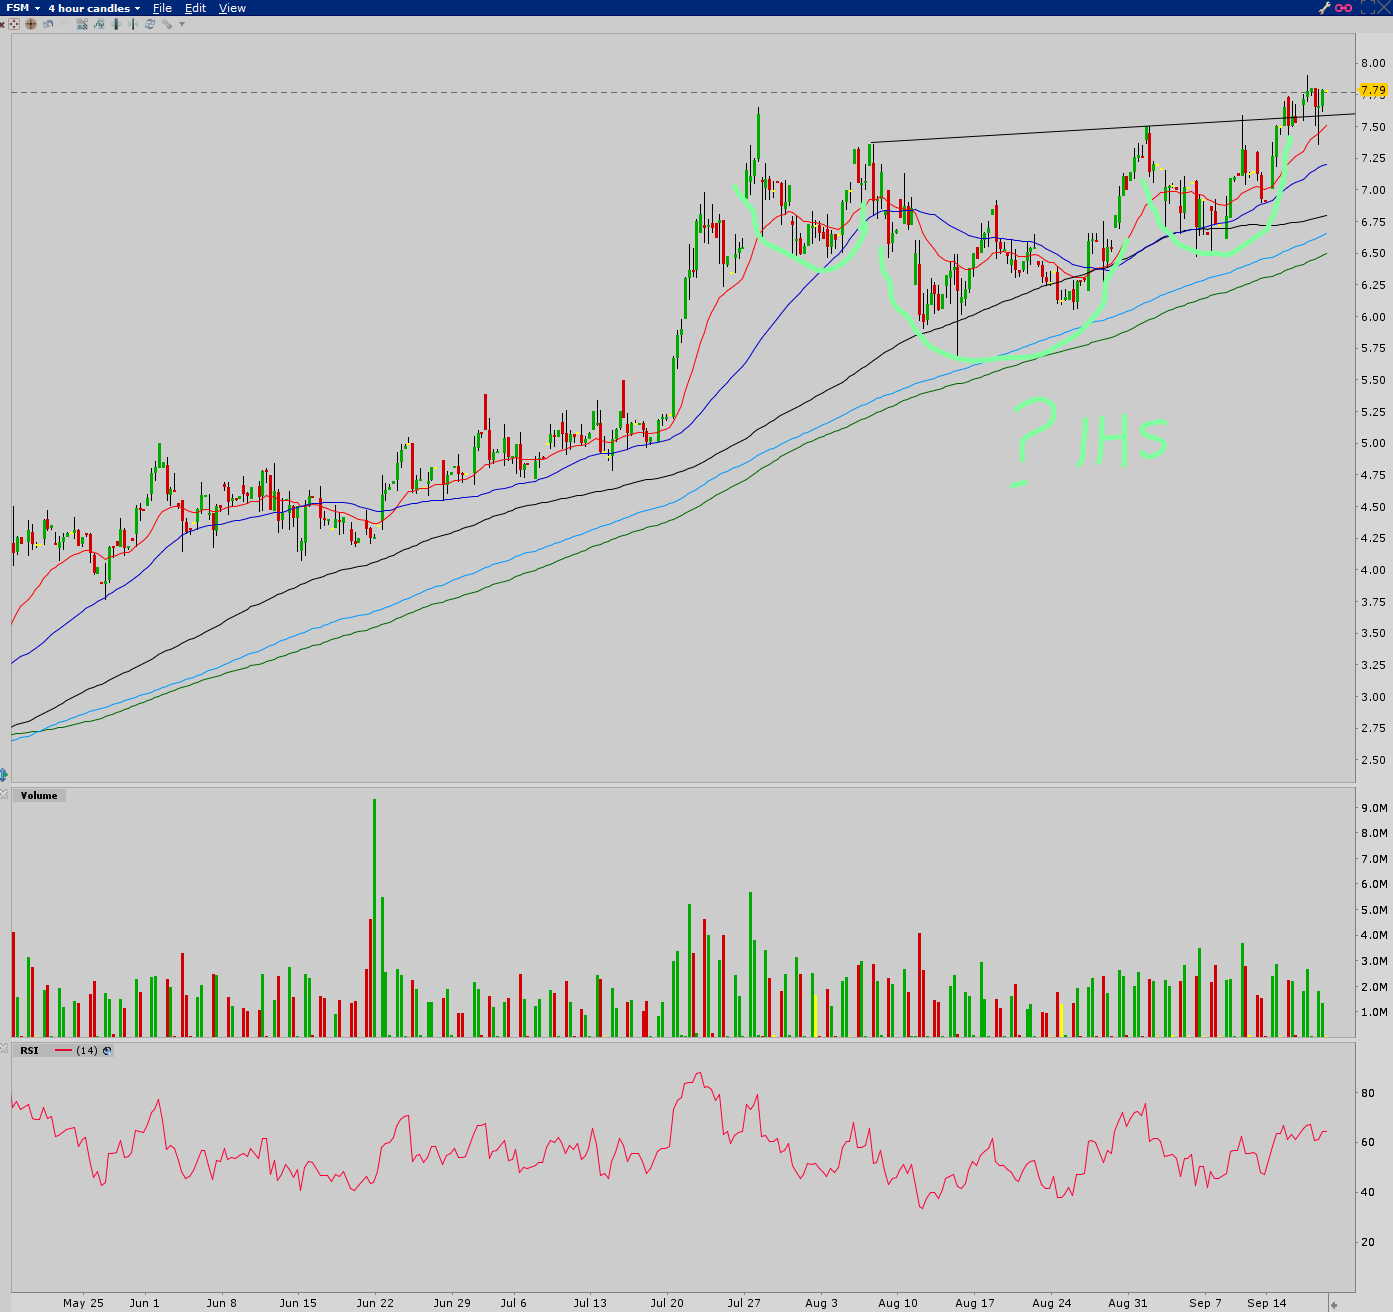
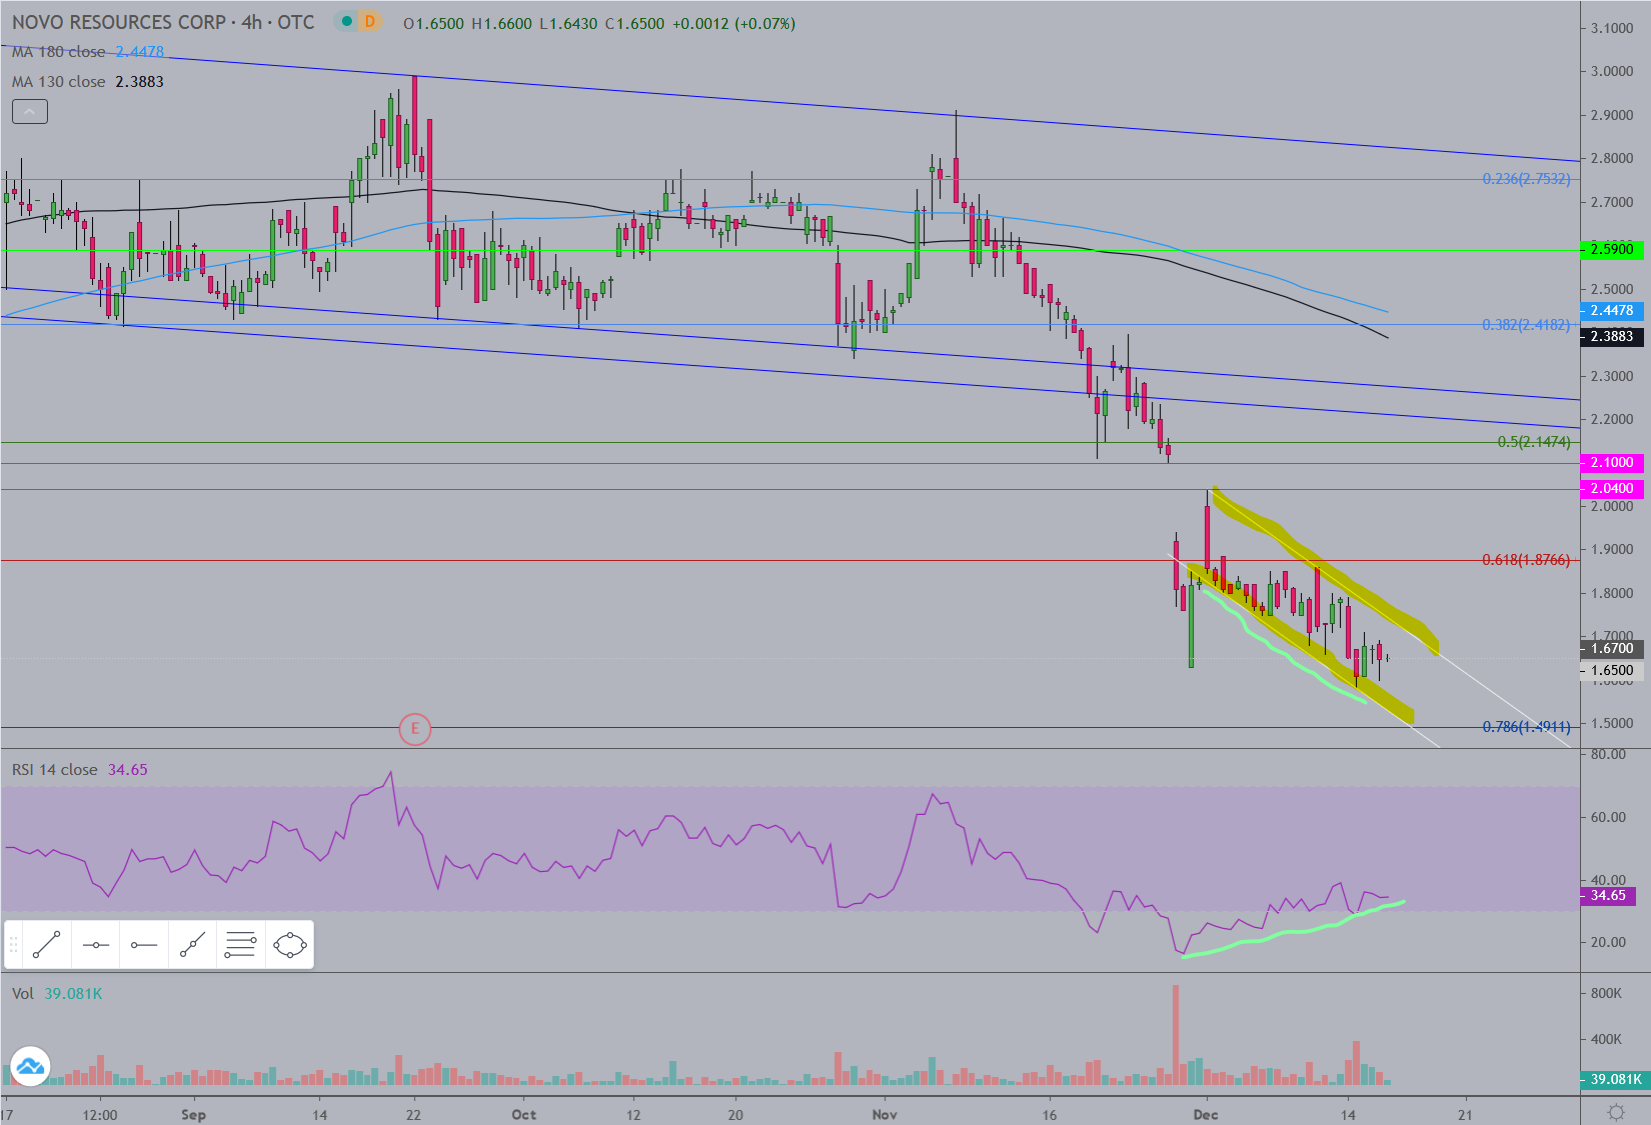
Maybe, but on this 4 hour interval, there’s an inverted head & shoulders formation. This is a typically bottom formation occurring at the top of a move. The breakout is already in play and the neckline is already so far fairly well holding support. If this IHS plays out you’re looking at a 9.45 target. If it doesn’t and you’re looking for a place to take some profits, the first place I would use is the neckline and/or the 20 EMA on this chart. Aside from that, the light blue 180 MA on this chart has not been touched since the uptrend began around 2.70. The current political/economic climate probably plays a role in the choice to sell, but I’m sticking to the technical aspects here and leaving the other stuff out to keep it clean.

1 Like

Vey nice annotation Rich. I didn’t pick those formations out at all! My strategy, as I’ve mentioned before isn’t complicated, but takes patience. I sold 1/3 of my position today at 7.78, very near the day’s top. It’s actually very rare to hit an exit that close. These were long shares, so I have a little cushion to sell a few more if it continues up. By selling today, my remaining share basis is 2.37. Many of those remaining shares are actually not seasoned a year, so I’ll likely hold them until they are “long”. If the stock retraces and moves down, I’ll buy back incrementally to regain as much of the original position as I can over time until the trend reverses. Again, very nice charting Rich.
Thanks,
EZ

Thanks Richard. I see those formations in my sleep. I have some things to do tonight, but i may get one or both of the others done tonight.

EXK This one is pretty simple/quick. RSI divergence on the 3 marked highs indicated the puttering incline. The drop ensues, and it falls below a typical 50 or 62% retracement. It’s not on this chart but to eyeball it I’d say it just about hit the 78% retracement from the ascending triangle breakout, which is typically an uh oh when looking for another leg up. So the pullback ends up making something akin to an inverted head & shoulders, although not nearly as pretty as Fortuna’s, and during that time you get a test of the 50 MA. From that perspective the stock is still strong, but it can barely muster a 62% retracement back to the highs and is finding a lot of resistance so far at the 50% level. So far the 20 EMA has regained support, but if you lose that blue 50 MA, as far as THIS chart is concerned, You’ve possibly got a drop to a gap fill at 3.33 and then your next support below that is the top of the ascending triangle at 2.90. In order to feel better about a re-visit to previous highs, you need to get about the 62% level and get to the 78% level. Then there’s a decent chance of new highs to come.

Here’s the 4 hr interval. I outlined the ascending triangle where the breakout occurred from. On the pullback you lost the 20, 50, and 130, but the 180 was only tested once and otherwise price recovered the 50 and is now pretty much above the 20 and it looks to be recovering. If you lose support at the convergence of the 130 and 180 on this chart, I doubt the green 200 MA is going to do the job.

ASM Here’s some RSI divergence that went on for over a year and a half. On this chart there were three major dips and the third was the charm. Sometimes it’s two, sometimes four, but often it’s 3. The stock has cleared all the MA resistances which are now support levels. The rise went into the highs of late '17/early '18 and needed a rest…

The retracement went to the most popular 62% level and the 50 MA was there to meet it. So far that has held, and the RSI is in the 50 range, which is where you’d want it to be to support the next rise hopefully to higher prices.

In the event that it goes the other way, I marked out potential support. Of the three stocks you’ve had me chart, this one looks the weakest and most likely to visit some of those lower areas. It has lost not only the 20 EMA but also the 50 so far, although it has made some effort to get back above them. It has also fallen below the 130 MA which, along with the 180 (which is not looking to be overly strong support so far either), is my main bull/bear indicator. When a stock that is rising loses the 20 and the 50, with the 20 crossing under the 50, I often look to take a short trade to at least the next lower MA, in this case the black 130. I will typically take profits when it gets to the next lower MA if it appears as though it will act as support, as in this case. But when there is a move back up that doesn’t get above the previous swing high and falls back below the 20 & 50, it’s more likely that the MA below that offered support the first time isn’t going to work as support the second time, and this was the case here. Now the 130 is looking weak and the green 200 is kind of a last resort, and it has been tested multiple times. I need the price to get back above the 130 MA on this chart and then get the 20 back on top of the 50 and everything moving upwards again in order to feel good about being long here.

BTW, I went into detail on this one at a level that I don’t usually go. I’m giving away a little more of my trading “secrets” here than I typically do, so I’m not posting this on my CEO.CA channel. :wink: :slight_smile:

It’s 9:10… time to go get my head in the game and make some money. :smiley:

Does anybody know anything about First Mining Corp?

Hey Rich,
I think I finally have started to pick out formations from all your annotations!
Is this what you call a possible Adam and Eve formation?

I know, I left out the annotation part…
Or is it an inverted Head and Shoulders?

drdonod

I have followed First Mining for quite a while and own a little bit. Do you have a specific question?

I posted some chart updates this morning for DXY, GC, ES, and NVO/NSRPF. I’ll do another update over the weekend. I like the forum a bit better over there for posting this stuff so will likely continue there and do less of it here. CEO.CA | ~charts by louie

1 Like

I don’t catch many of Mike Maloney’s video’s, but I found this one quite interesting.
No, I don’t think gold will go where he suggests, and hope it doesn’t.
I’ve seen a more reasonable speculative range of $2500-$3500 suggested several times lately, but this chart superimposition fit based on some historical movements in POG suggests the gold bull to peak in late 2023.

1 Like

Hey Easy, thanks very much - he makes some good points!

Thanks mrbubba.
Bob makes some good points in the interview you posted on the Other Mining Stocks thread, also.
The interview had to be listened to while doing other tasks just to catch any of the worth while points as Bob was just being Bob most of the 1st half of the interview. I had to agree with Moriarty when he said “This is a time to think for yourself!” I also picked up on his comment that he used a shotgun approach of taking positions in about 20 of the lower priced junior miners that are having good drill results and secured funding. As you may have noticed, I posted a number of stocks early in this thread and hold quite a few others that I did not mention that looked promising. I like Bob’s approach, but have a problem in that so many miners have gone up that I don’t have enough losses to avoid the next higher tax bracket! I just counted 16 of my mining stocks that are up over 50% for the year. I never thought that would be a problem until recently. I can’t afford to take profits … DGMLF is up over 1500%! I digress … I do have a few that have not come through yet that were already up and have since retraced. I’ll add incrementally once they either form a base or have substantial news and progress. I prefer to keep stocks for a year before taking profits.

I put up a link to the annual report on Kairos Minerals, along with a couple of charts on the Other Mining Stocks thread. I wanted to remind folks the Pilabra has a few lower cost plays that look extremely promising for this bull run in PM stocks for the years ahead. I’ve held Artemis Resources since early on when ARTTF was trading for 0.25. On the other hand, I picked up quite a few shares at the end of last year when it was down more than 90%. :grin: Here’s what the chart looks like as of today.

Any guesses where ARV will be by the end of next year? Just look where DEG, NVO, and KRR started out and where they are now if you want to know what I think. I’ll just have to be comfortable with that higher tax bracket!

1 Like

Hi Richard;

Long time, no talk, since your move.

A couple of points… regarding ARV. I don’t give Carlow Castle much credence, may or may not hit some deep assays. I don’t think it will do anything for the price for quite a while.

Like you I started investing in ARV a while back when it was at $0.126. Total buying since in 3 accounts : ARTTF U$0.143 C$0.184 = -$2,158
ARTTF U$0.0637 C$0.084 = +$4,371
ARTTF U$0.058 C$0.078 = + $4,098

Thankfully the 2 later investments are now up after a long wait. I really wanted to add some share when they first acquired pptys near the Havieron properties on July 16, 2019 when the stock was U$0.02, but alas lack of funds and/or commitment.

“Artemis Resources has acquired Rincon Resources and its South Telfer project, which lies 12 kilometres from Newcrest Mining’s Telfer mine in the Pilbara, Western Australia.
The move comes as Artemis looks to expand its holdings within the highly prospective Paterson Province, taking its total land ownership in the region to 1140 square kilometres.
Artemis is now one of the largest landholders in the Paterson Province, a region which has seen Rio Tinto’s recent gold and copper Winu development as well as Greatland Gold and Newcrest’s Havieron discovery.”

Havieron is an amazing drill site. How many pptys have these kind of assays ?
121m at 2.93g/t Au** and 0.23% Cu
HAD039: 86.6m @ 2.8g/t Au, 0.37% Cu from 693m
HAD039W2: 148m @ 2.7g/t Au, 0.45% Cu from 668m
HAD052: 234m @ 1.7g/t Au, 0.29% Cu from 563m
HAD044: 83.3m @ 5.0g/t Au, 1.1% Cu from 489.5m
HAD049: 82m @ 6.1g/t Au, 0.41% Cu from 461m
etc…

If ARV hits 1 very good intercept out of the 5 they are drilling, this stock will start to move like DEG did initially.

More than 1 very good intercept and it could start following DEG’s rise.

This is one stock that I think will be a bagger if that happens. From $0.10 easily to $0.25 to $0.40.

https://artemisresources.com.au/our-projects/major-projects/278-armada

Happy investing,
Rod

PS : you should start investing in the options we talked about.

1 Like

Metals Stocks

Gold prices rise as investors brace for U.S. Election Day outcome

Last Updated: Nov. 3, 2020 at 10:26 a.m. ETFirst Published: Nov. 3, 2020 at 8:26 a.m. ET

By

Myra P. Saefong,

and

Mark DeCambre

NSRPF - 4 hour chart

The price has been in a downward channel since the gap down, and in every example I’ve seen when a stock ends a decline in a downward sloping channel it has an upside breakout and starts an uptrend from there. The RSI has been divergent during this decline, which is my favorite early sign of a pending reversal. So first bullish sign is a break above the upper channel downtrend line, then some test of support which could be the downtrend line or a horizontal support level, then a move back up to the gap zone at 2.04 - 2.10. Then we’ll have horizontal resistance in the 2.40’s along with MA resistance which I’ll get to when we get there.

4 Likes

Appreciate the analysis Rich. The 4 hour chart paints a clearer picture than the daily in this case. The RSI divergence is compelling. And knowing the fundamentals of the stock, it is a pretty safe bet (for me anyway) to average down some more down here.

Thanks!

5 Likes

Thank you Rick and Rich

2 Likes

Thanks Rich - you just justified my purchase a couple days ago!

I just might take another shot in the next day or so.

3 Likes

can’t wait for nsrpf to finally break out. Their day is coming, IMO.

3 Likes