Instead of re-posting all my work here, let me know if anyone interested can go to this link and see my latest chart posts…
1 Like
Thanks Rich. As I’ve said previously, that 4-hour chart on Novo is ripe for a reversal…textbook in fact. I hope I didn’t just jinx it…LOL.
2 Likes
I don’t think you jinxed it Rick. I think someone already did that, so now maybe we’re un-jinxing it!
5 Likes
disregard this post
I’ll post a chart for NVO and NSRPF Sometime today.
2 Likes
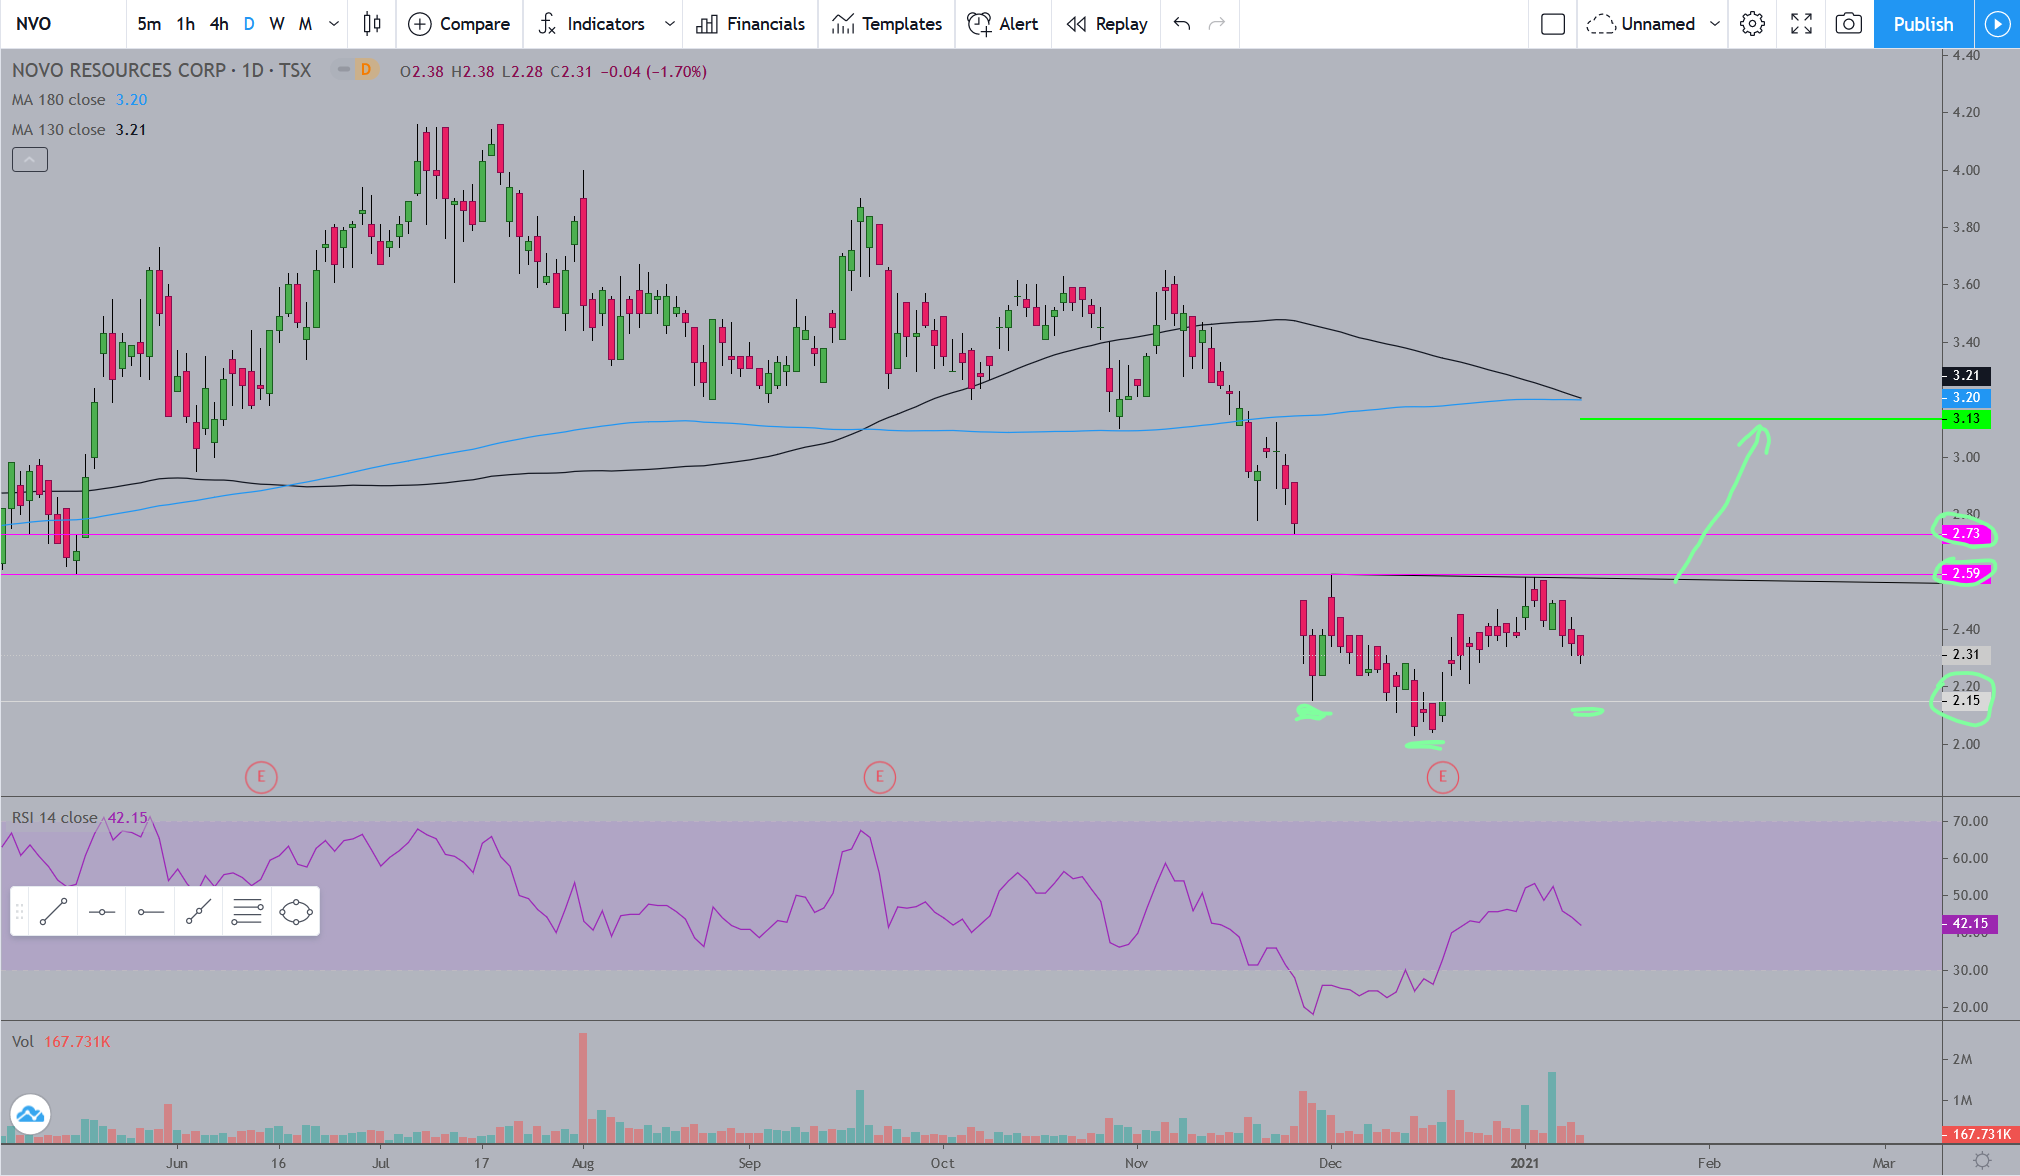
This is a daily interval chart for NVO. For now I’m keeping it simple and focused on one particular potential, that being an inverted head and shoulders formation. If the formation fails I’ll put my attention on other things. I’ve market the left shoulder, head, and potential for the right shoulder. We want 2.15 to remain support or at least for the price not to drift much lower than that for the formation to remain legit. Then we want a move back up to the black neckline and from there a breakout, filling the gap between 2.59 and 2.73, the two pink horizontal lines. The target price for this formation is at 3.13, which will also likely be right around those two moving averages NVO will need to eventually push through as well. If I see more worth posting about I’ll do so as time permits.
4 Likes
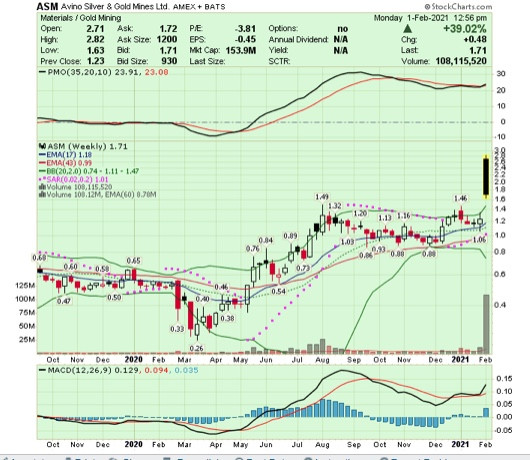
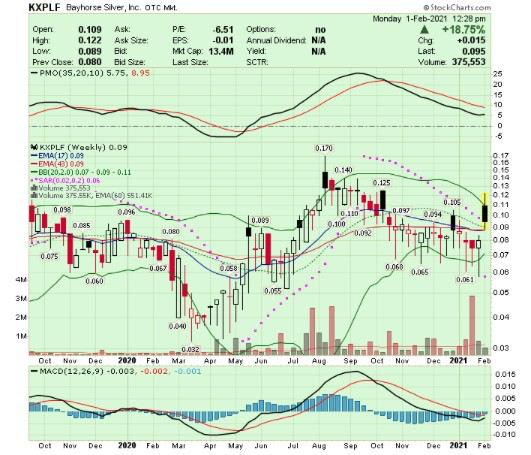
A few stocks of interest that started the week with significant moves (Disclosure: I do have positions in these).
Weekly charts are shown below:
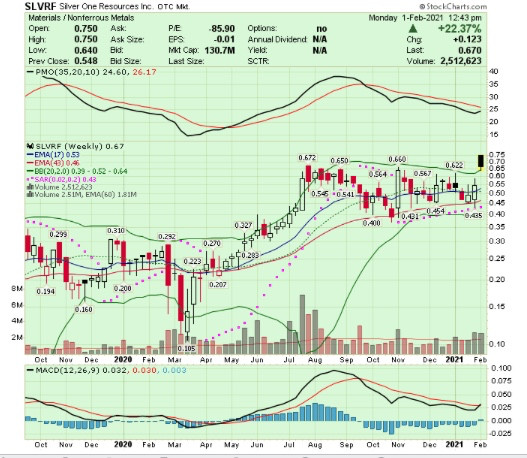
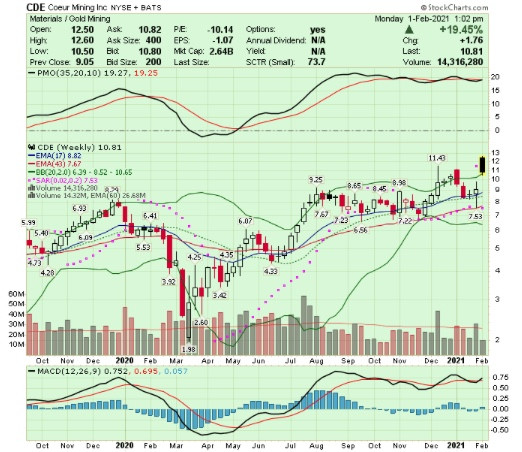
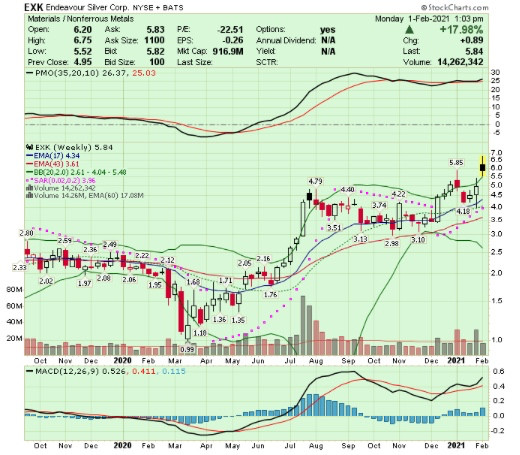
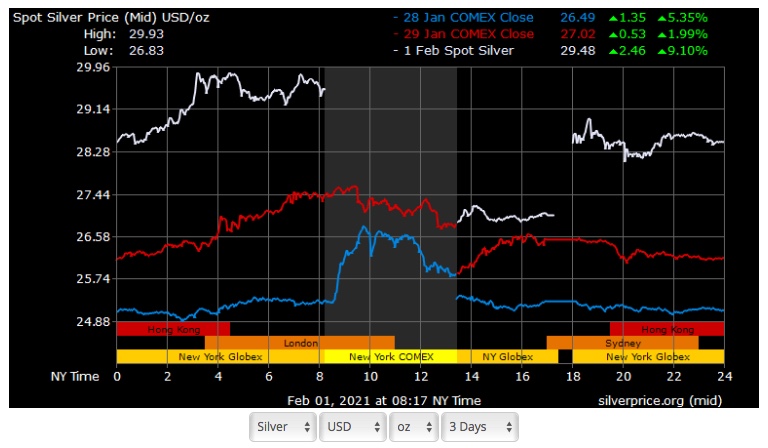
Starting the day and month of February there is a lot of VOLATILITY today and Gaps up!
Thanks Easy. And TRex Cs.
LoL spell check changed T-Rich to TRex  Technology! my other brain.
C.s.
1 Like
I’ve been called much worse! 
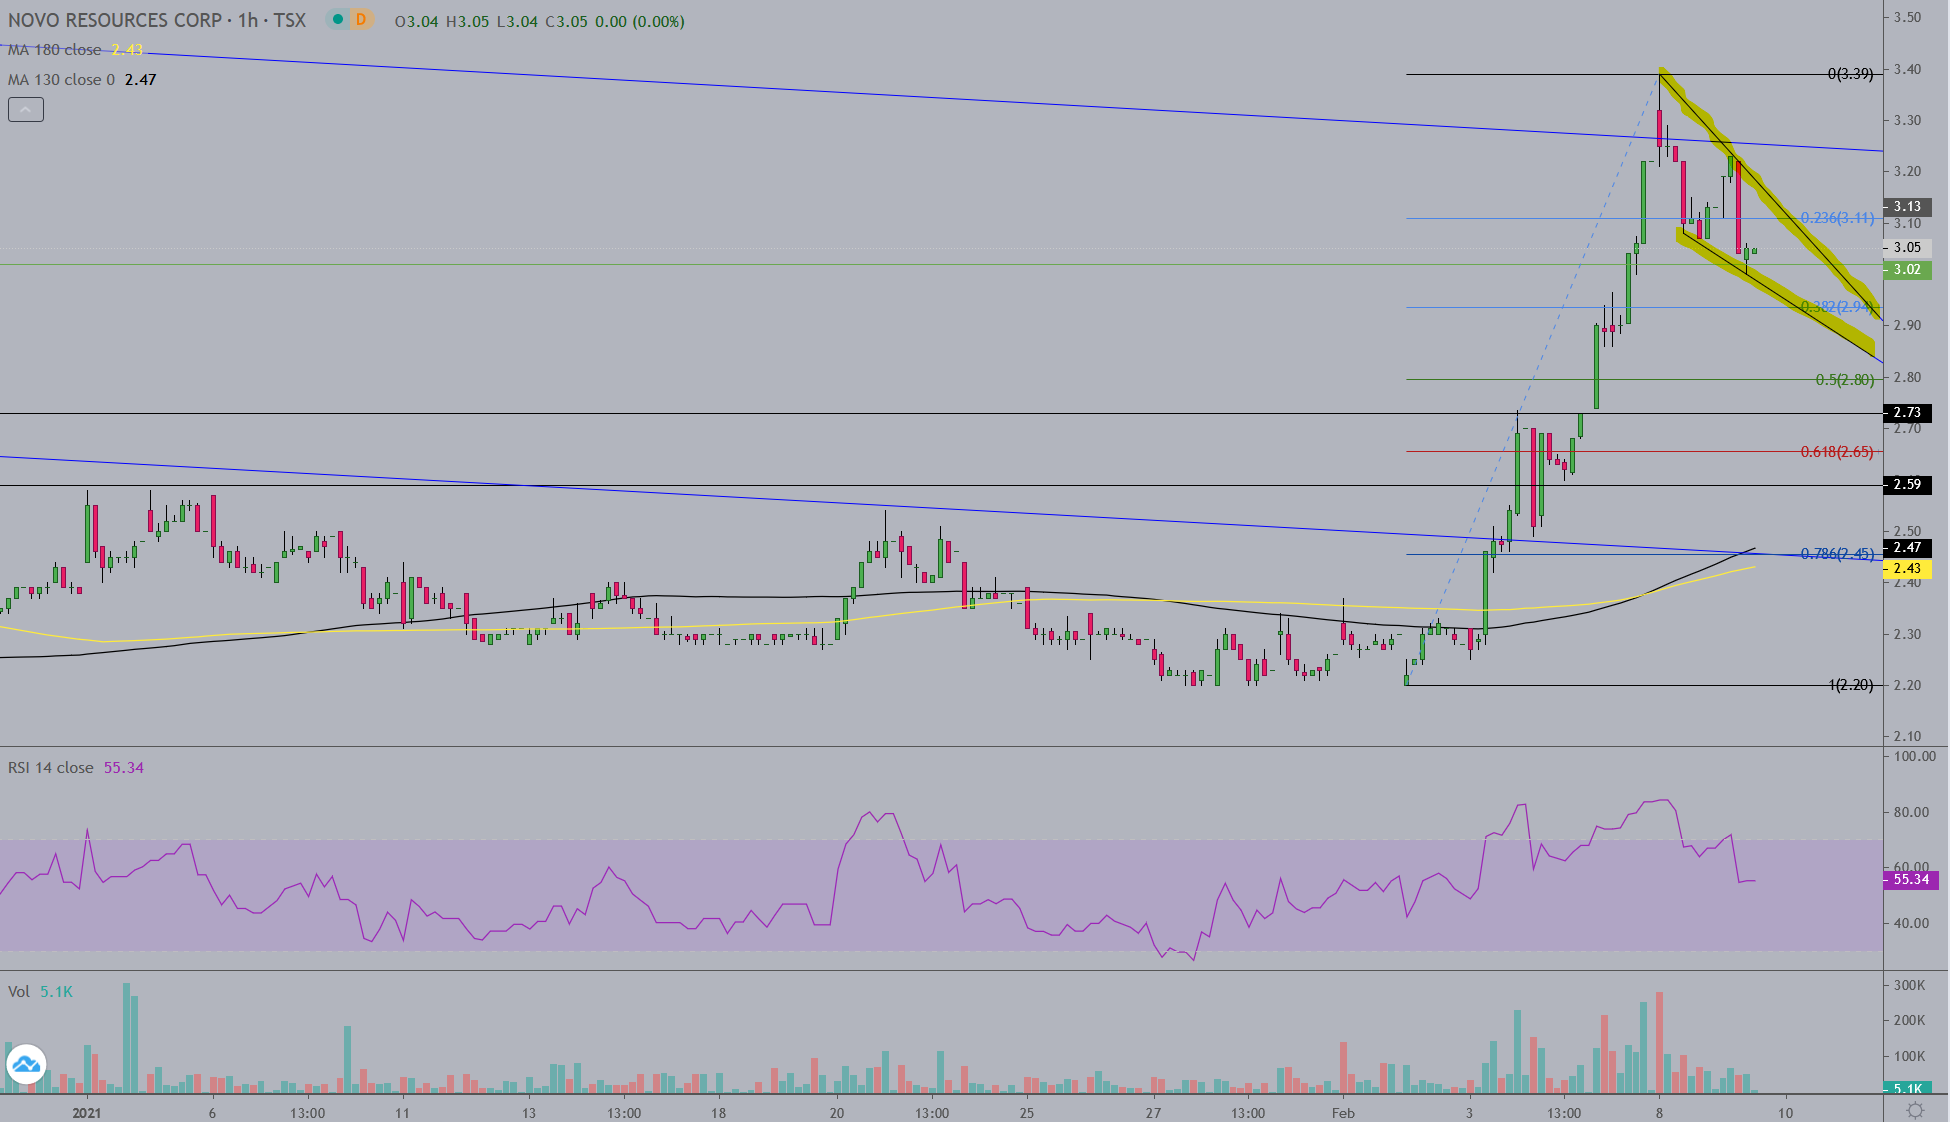
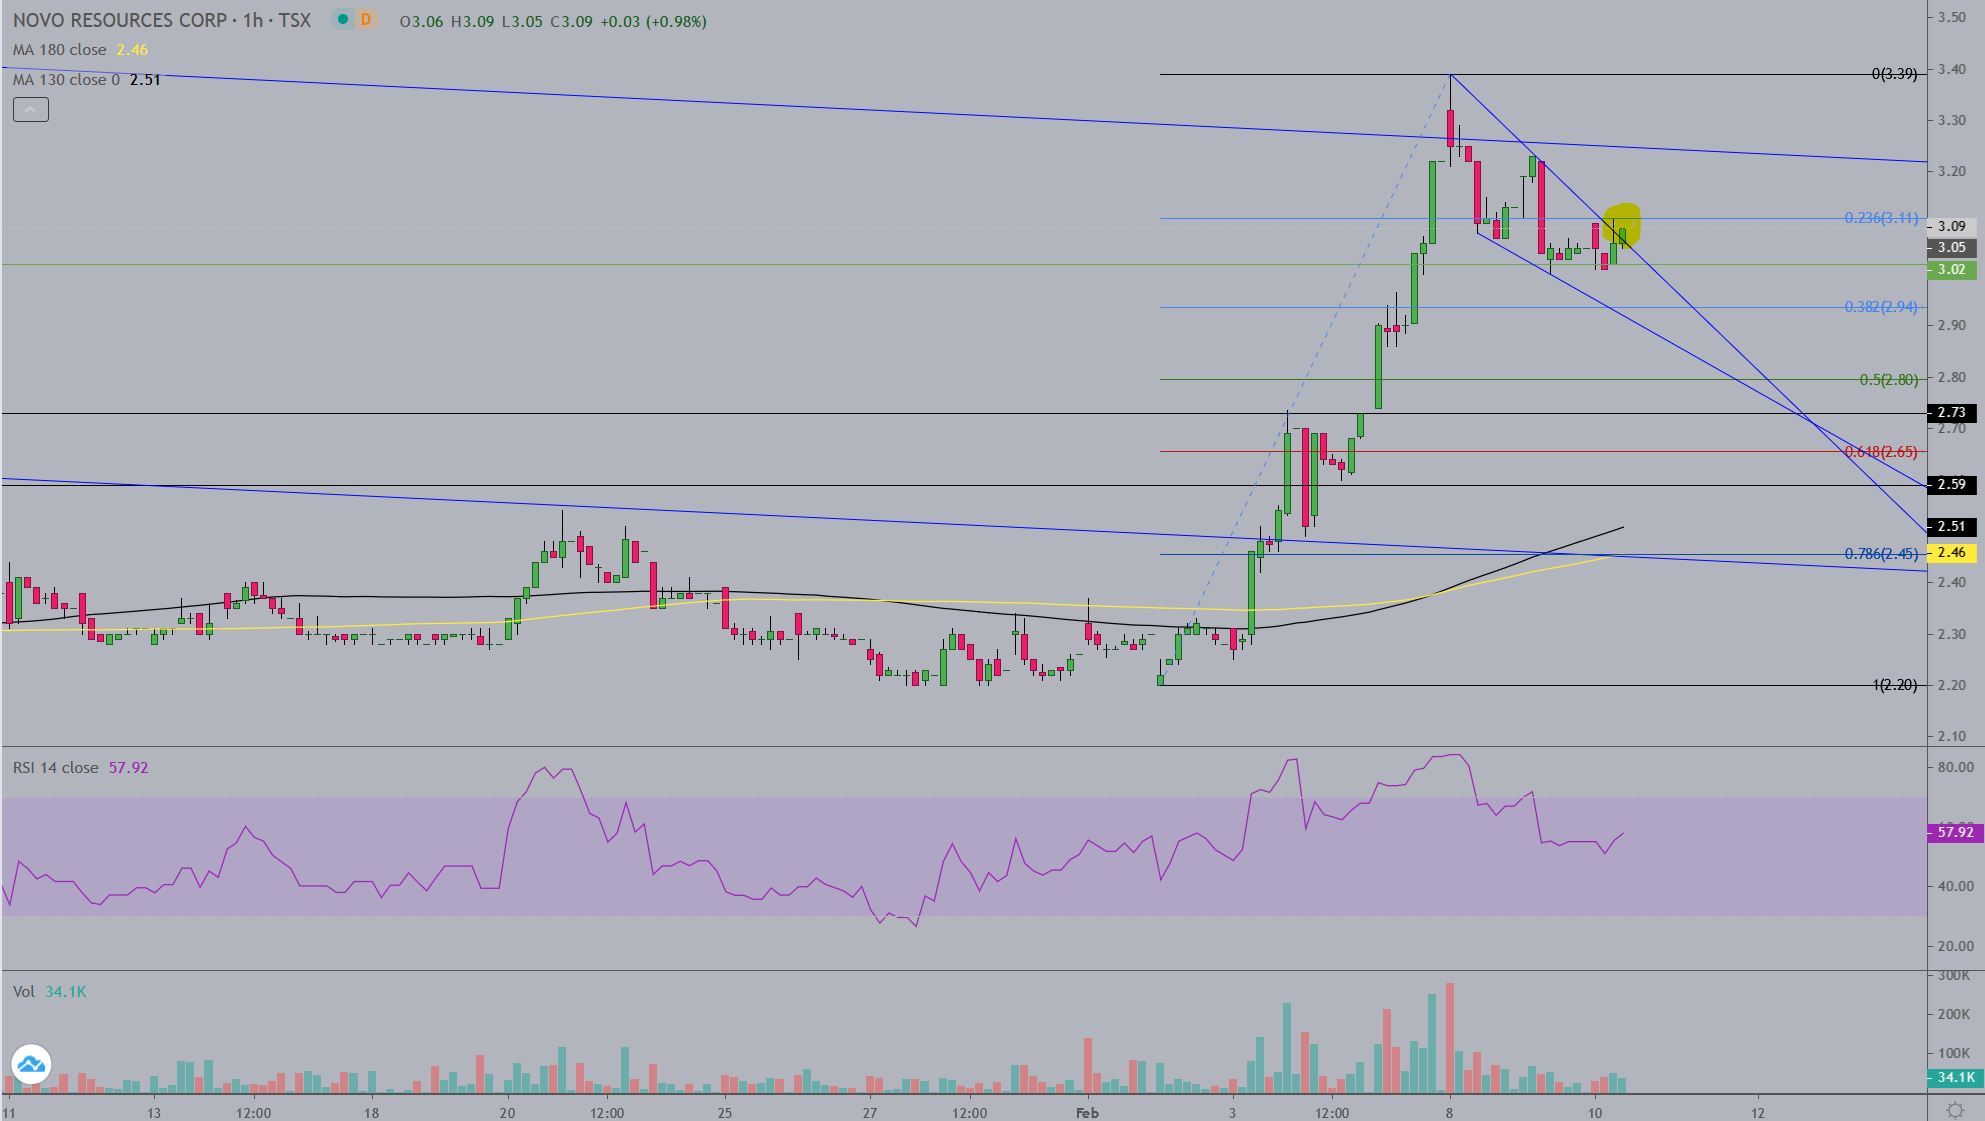
NVO hourly chart: 1. Is where yesterday’s liftoff began. 2. is the gap fill @ 2.73 where buyers took a pause. 3. is where traders took profits, down to the 50% retracement of the earlier move. 4. Buyers came back in and over the course of the day brought it back up to yesterday’s high. This makes an ascending triangle formation on the chart. NVO will either gap higher at the open (preferably not) tomorrow, or it will launch higher upon opening. It’s just an opinion and could be wrong, but it’s quite likely considering NVO consolidated and closed up .03 while gold took a $40+ dollar dump today.
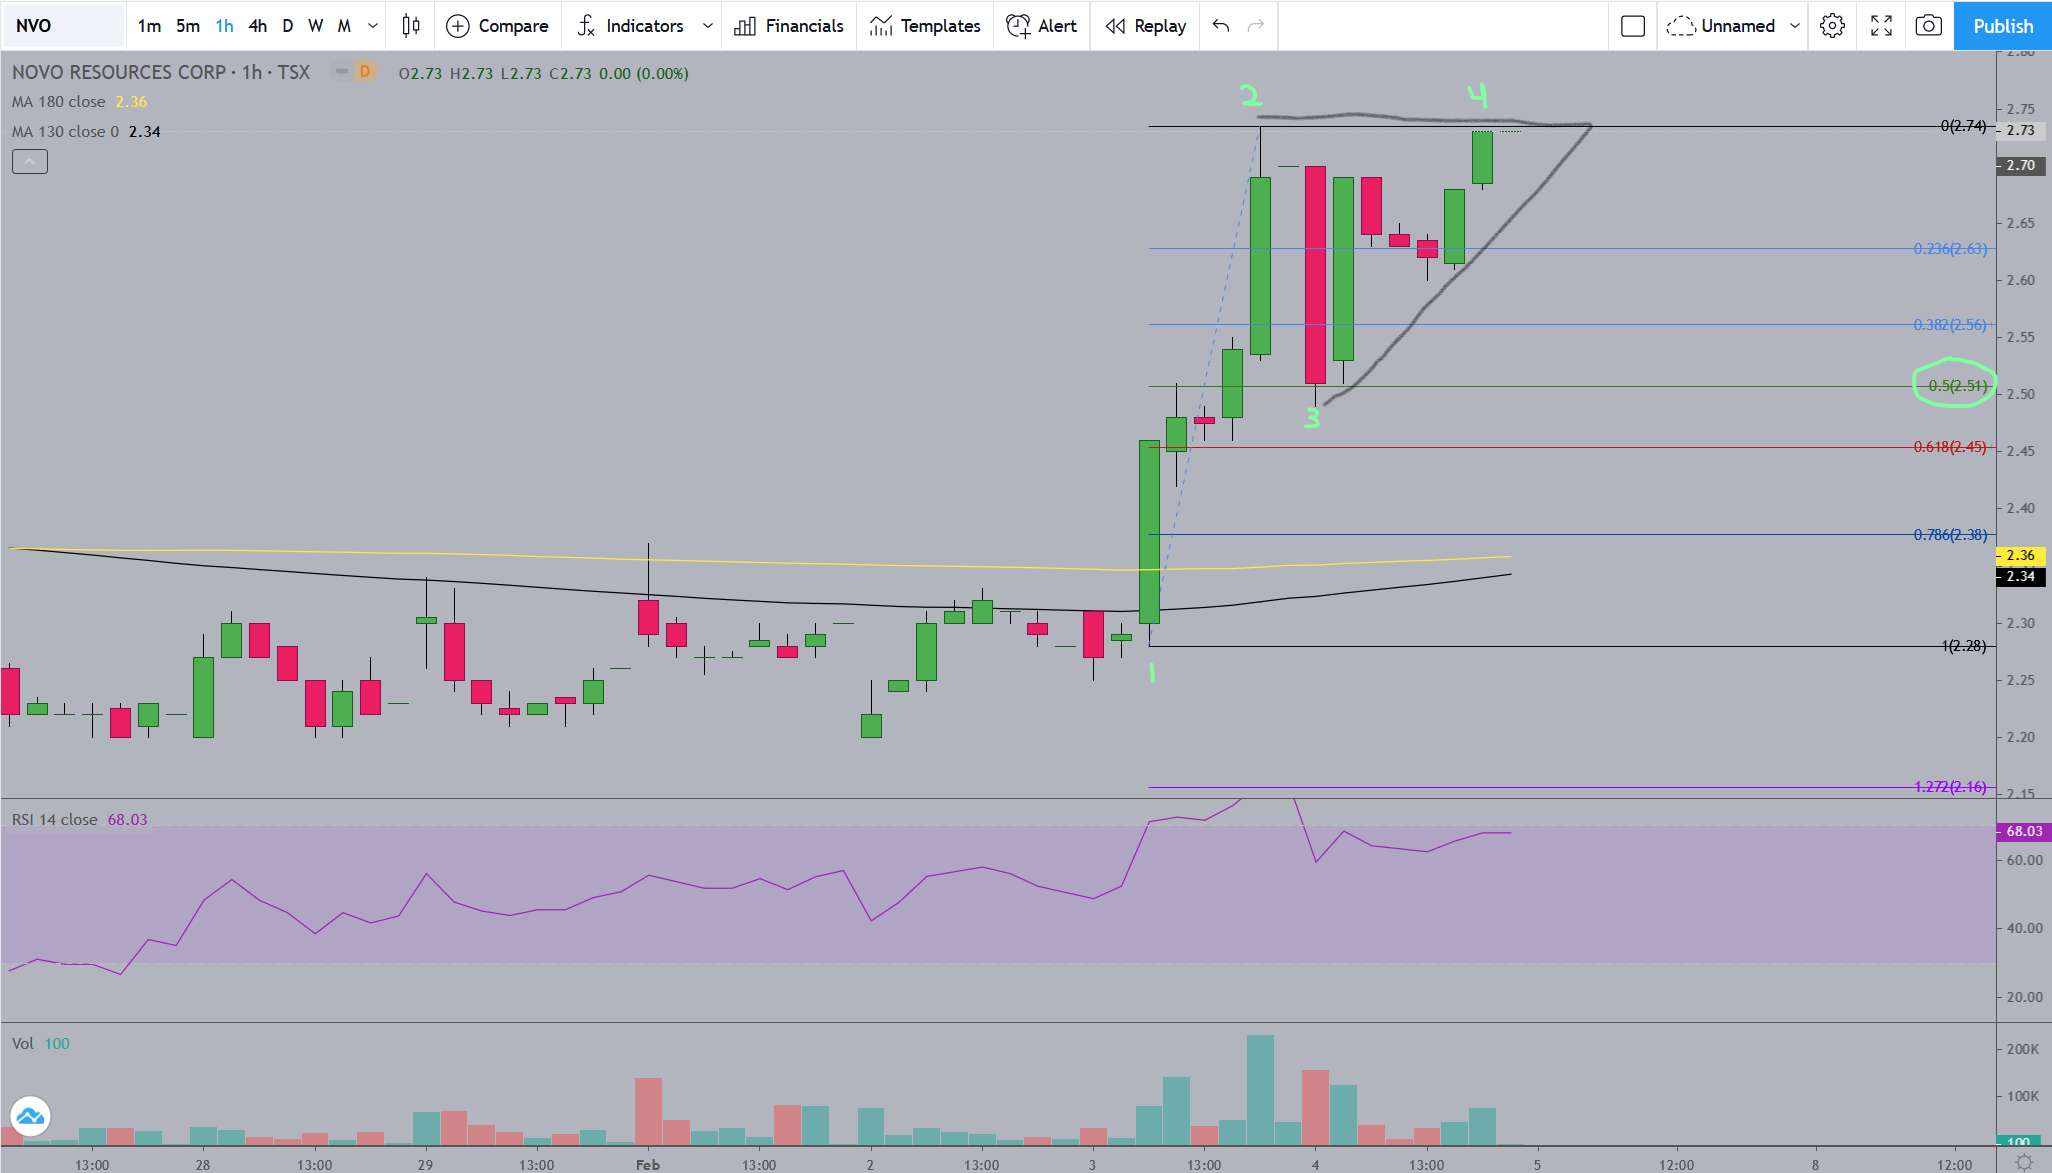
3 Likes
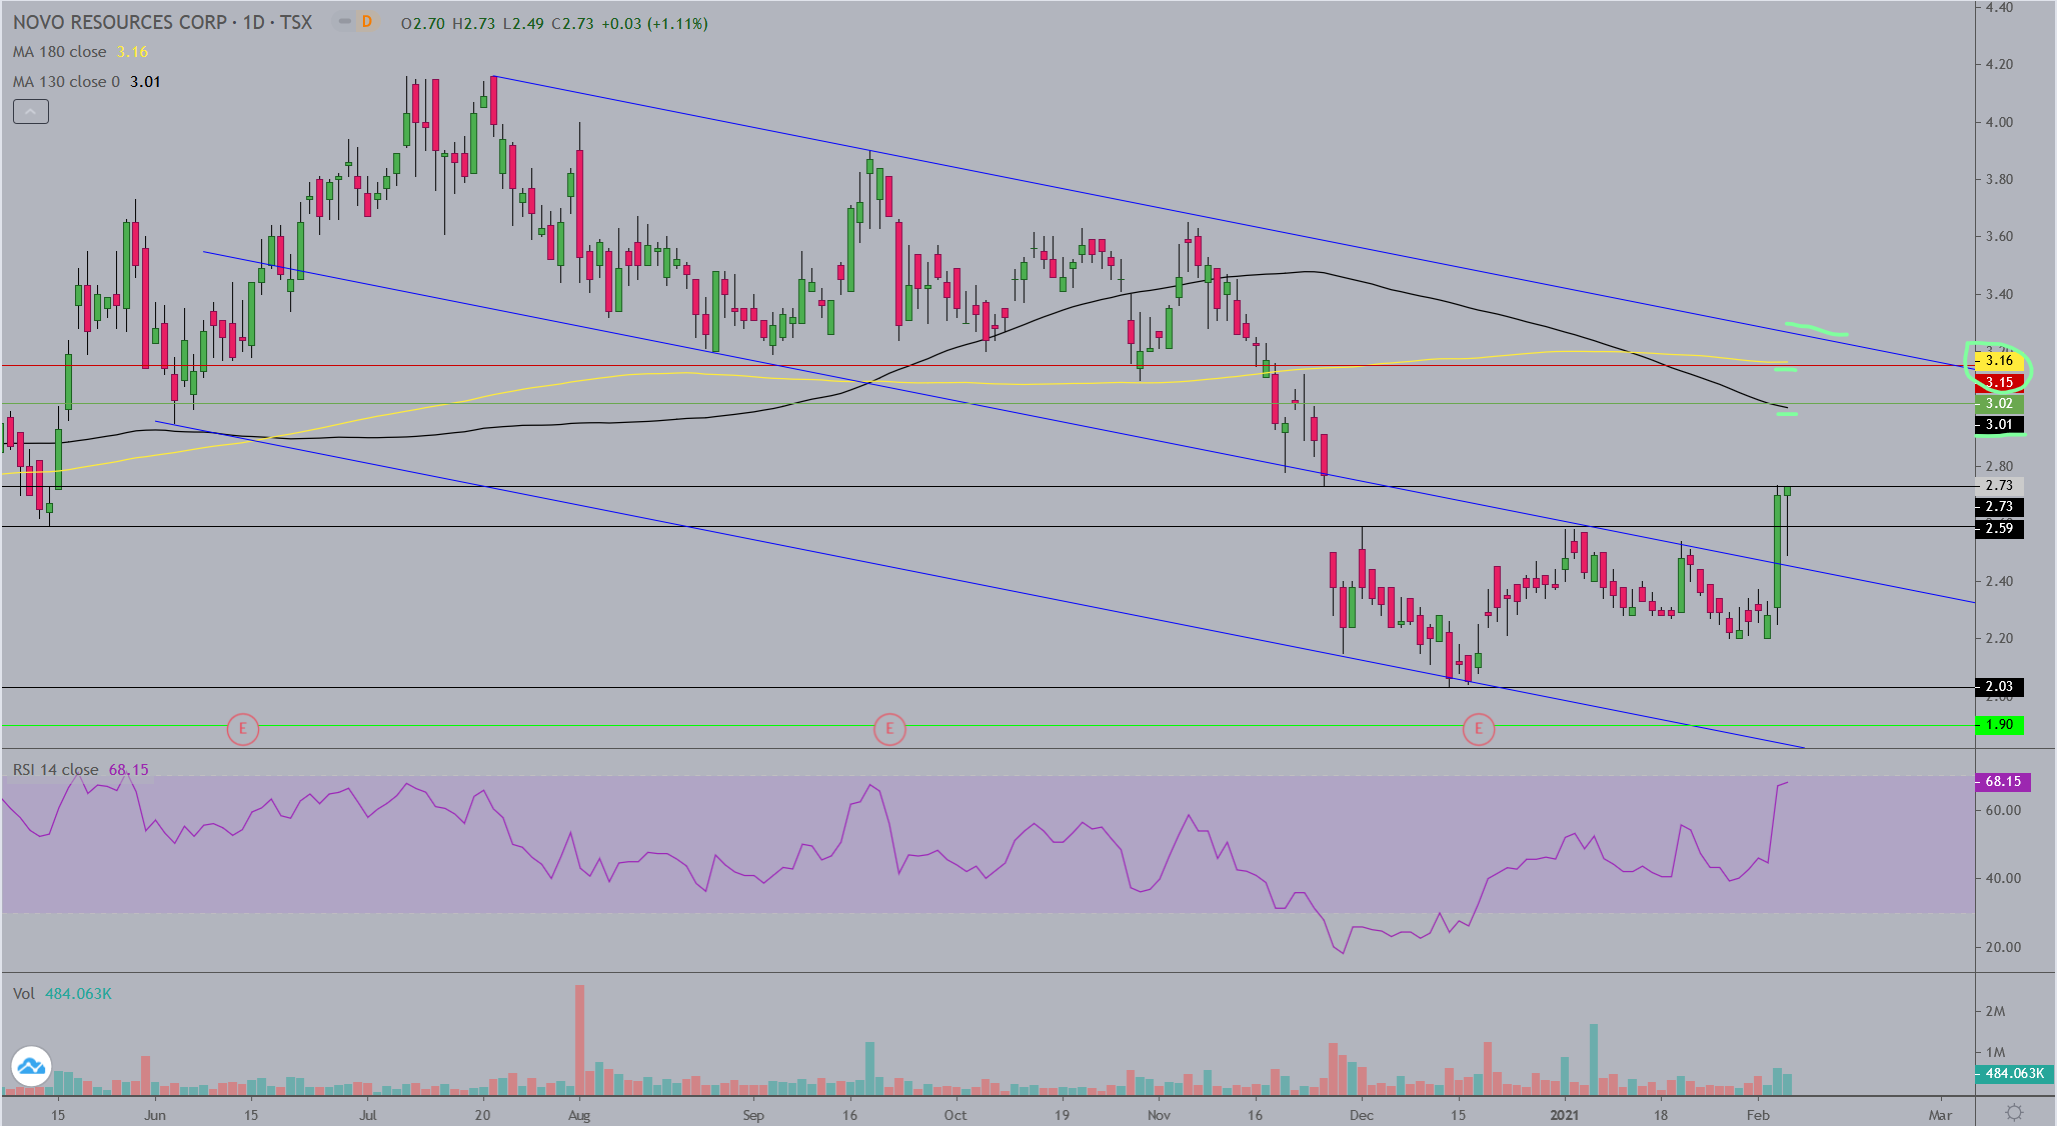
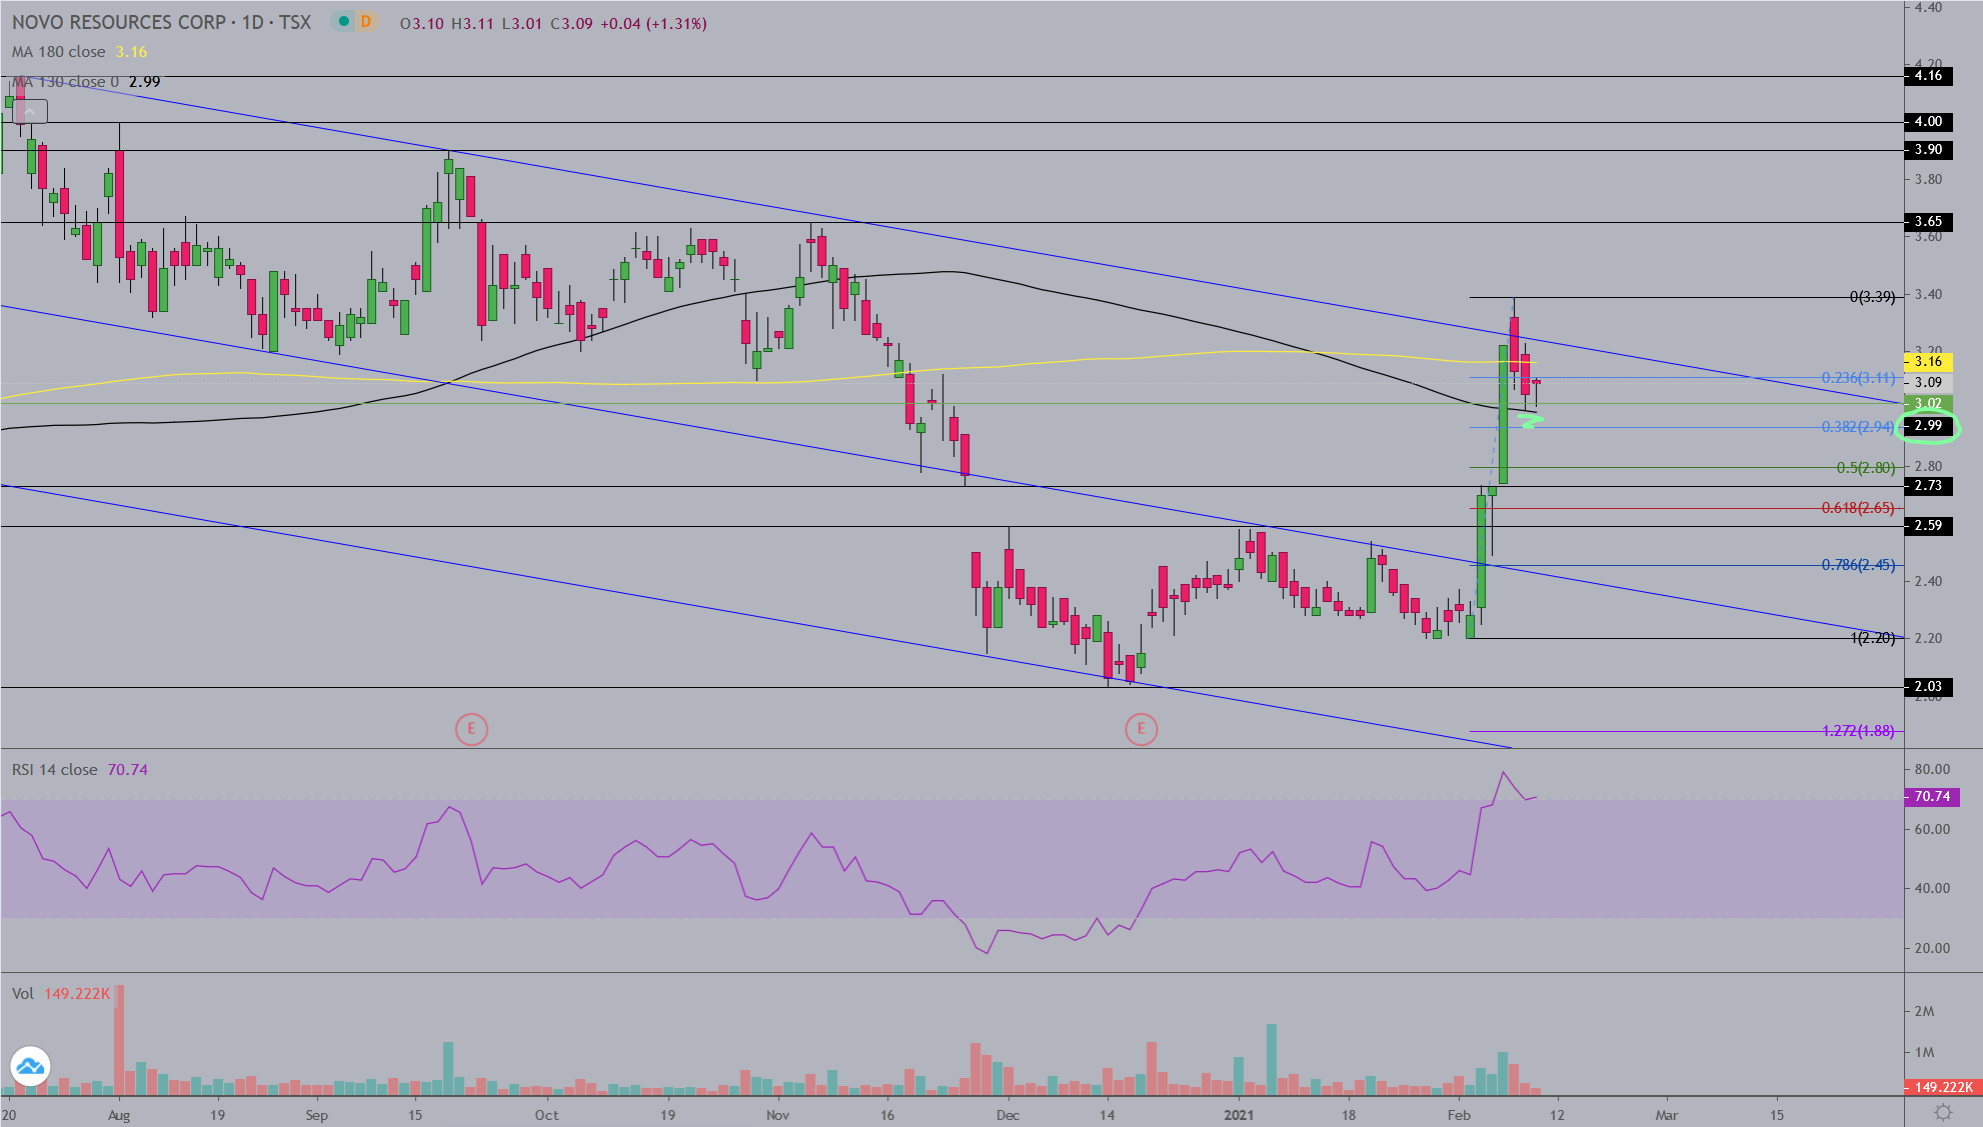
So where’s it going tomorrow? Providing the ascending triangle plays out, the measured move (target price) of the formation is up .25, to $2.99. This daily interval chart currently shows the black 130ma just a tad higher at 3.01. Above that is the yellow 180ma at 3.16, which is a penny higher than the target price of the Adam & Eve formation marked by the red line at 3.15. If we get above those levels the next immediate resistance is the top downtrend line (blue) of the channel it fell out of on the KL news in December. The green line at 3.02 simply marks my cost basis so I’m rooting for a run to $7 for starters.
1 Like
Bingo! Hit your measured price target and moved a little beyond to 3.145, almost to your Adam & Eve formation price target 3.15. Very nice charting Rich!
1 Like
Closed at the high about .03 off from the top channel trend line. 
3 Likes
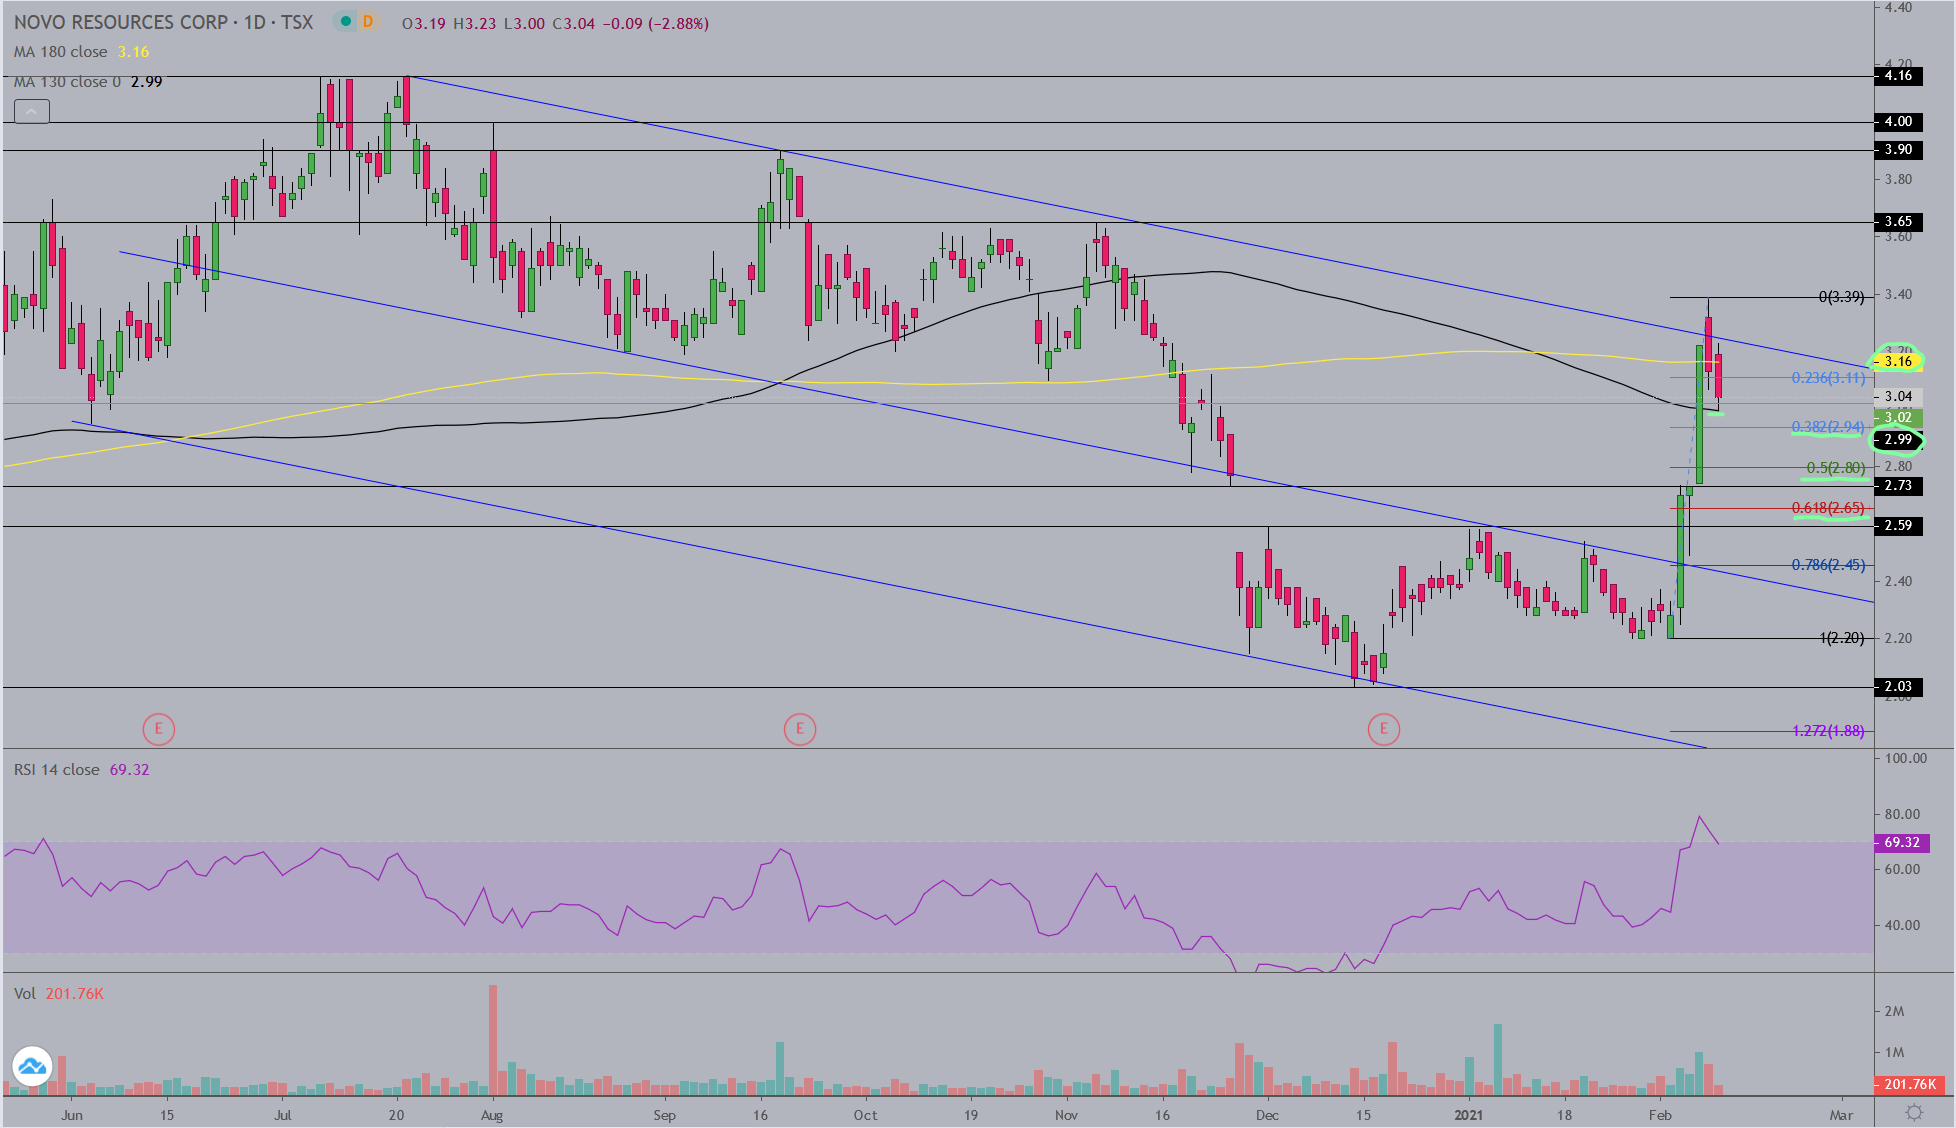
NVO/NSRPF chart updates: So far NVO has pulled back to the 130ma and appears to be forming a flag thus far (second chart). A very shallow retracement thus far, considering the $1.39 4 day rise it’s retracing. Watch the 3 underlined Fibonacci retracements on a further pullback for support.
3 Likes
Not bad… I needed a couple more “thus far’s”. I’ll get em in next time!
1 Like
So far the 130ma has held. I’m kinda hoping for a 50 - 62% retracement to pick up another 10k shares, but I guess I’ll survive we don’t see that.
We seem to be in the midst of a lowkey breakout. Perhaps the momo will come on in the last hour…
2 Likes
It’s a cool and rainy FL morning. Time to post some charts.
2 Likes
The NSRPF chart has a beautiful flag ready to bust out on Tuesday. I know I said I was done buying NSRPF as I have plenty, but I picked up a few more shares at 2.41 just to play the breakout on anticipated news of the first gold pour…which may be this upcoming week.
2 Likes