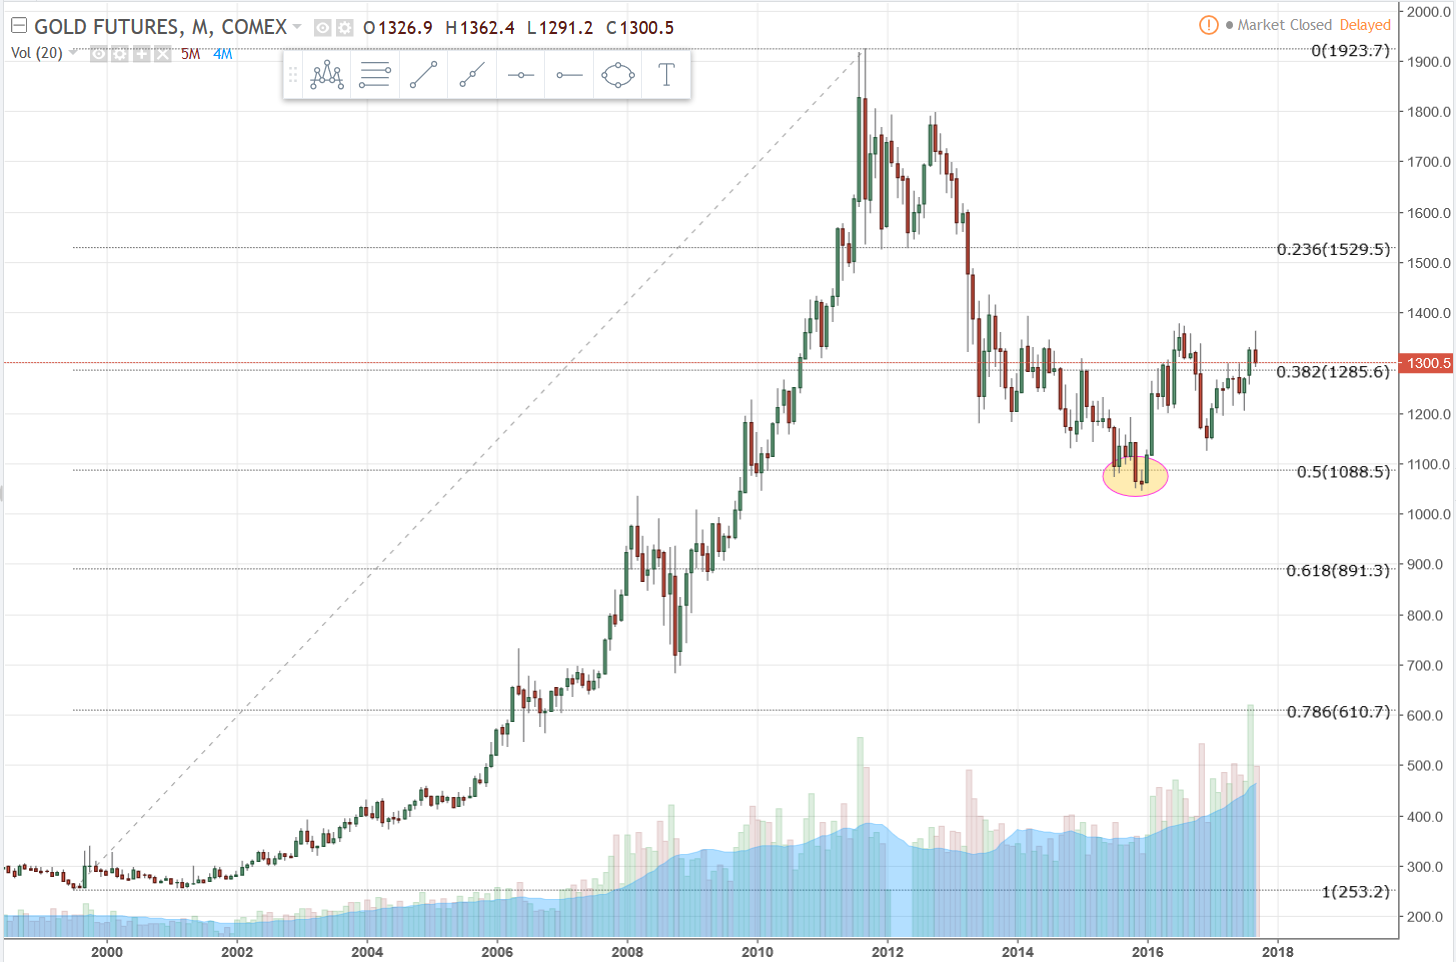
First up is a monthly interval showing the rise of gold from a 253.20 low in July of 1999 to the 1923.70 high in September of 2011. I laid a Fibonacci retracement grid over this range and, lo and behold, gold retraced a tad more than 50% of that move. (As I’m writing this I’m looking at the chart and it sure looks like there’s an inverted head & shoulders formation in the consolidation after the big drop. It’s not a perfect example, but it’s close enough that it’s worth watching. I’ll highlight it in the second chart).
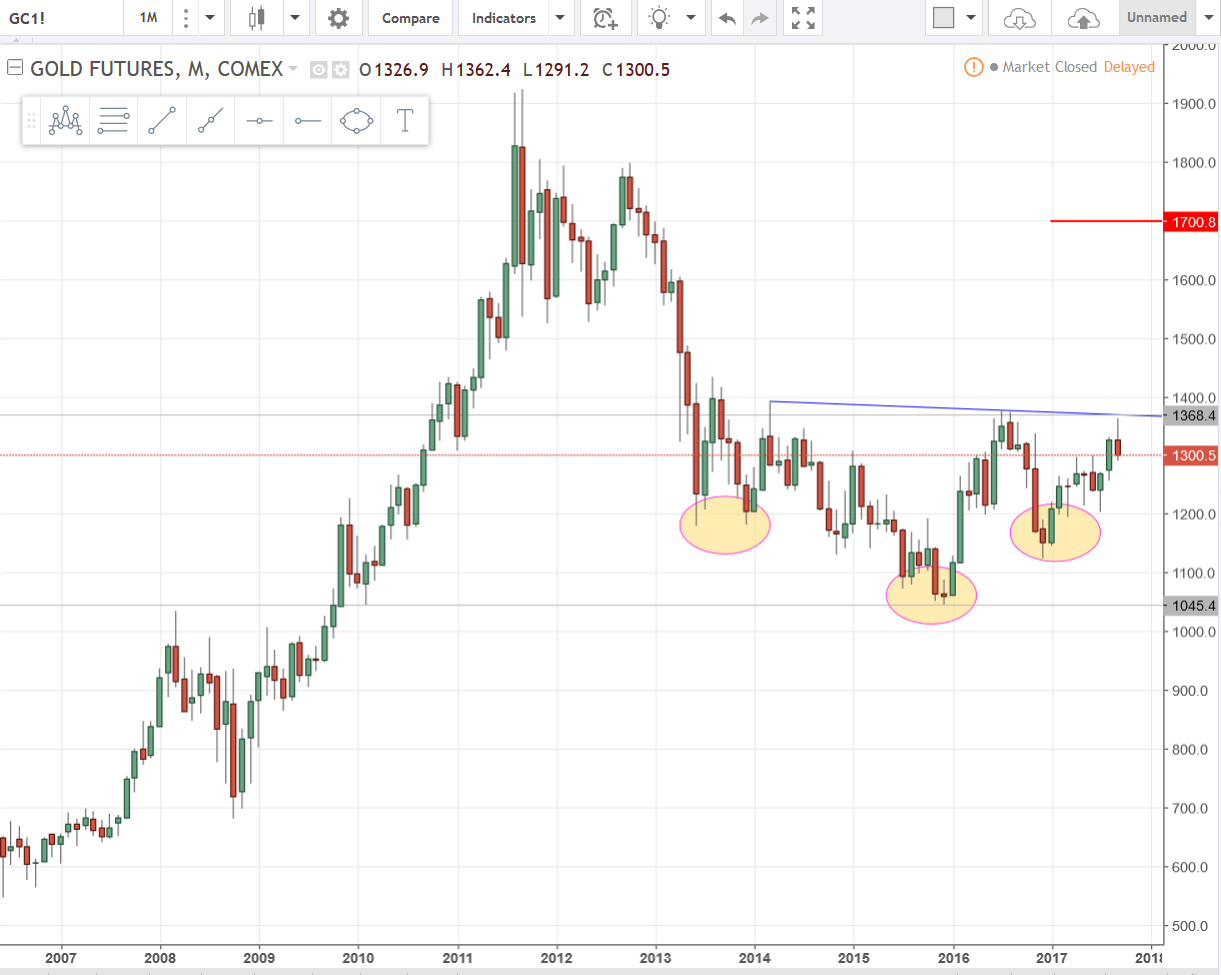
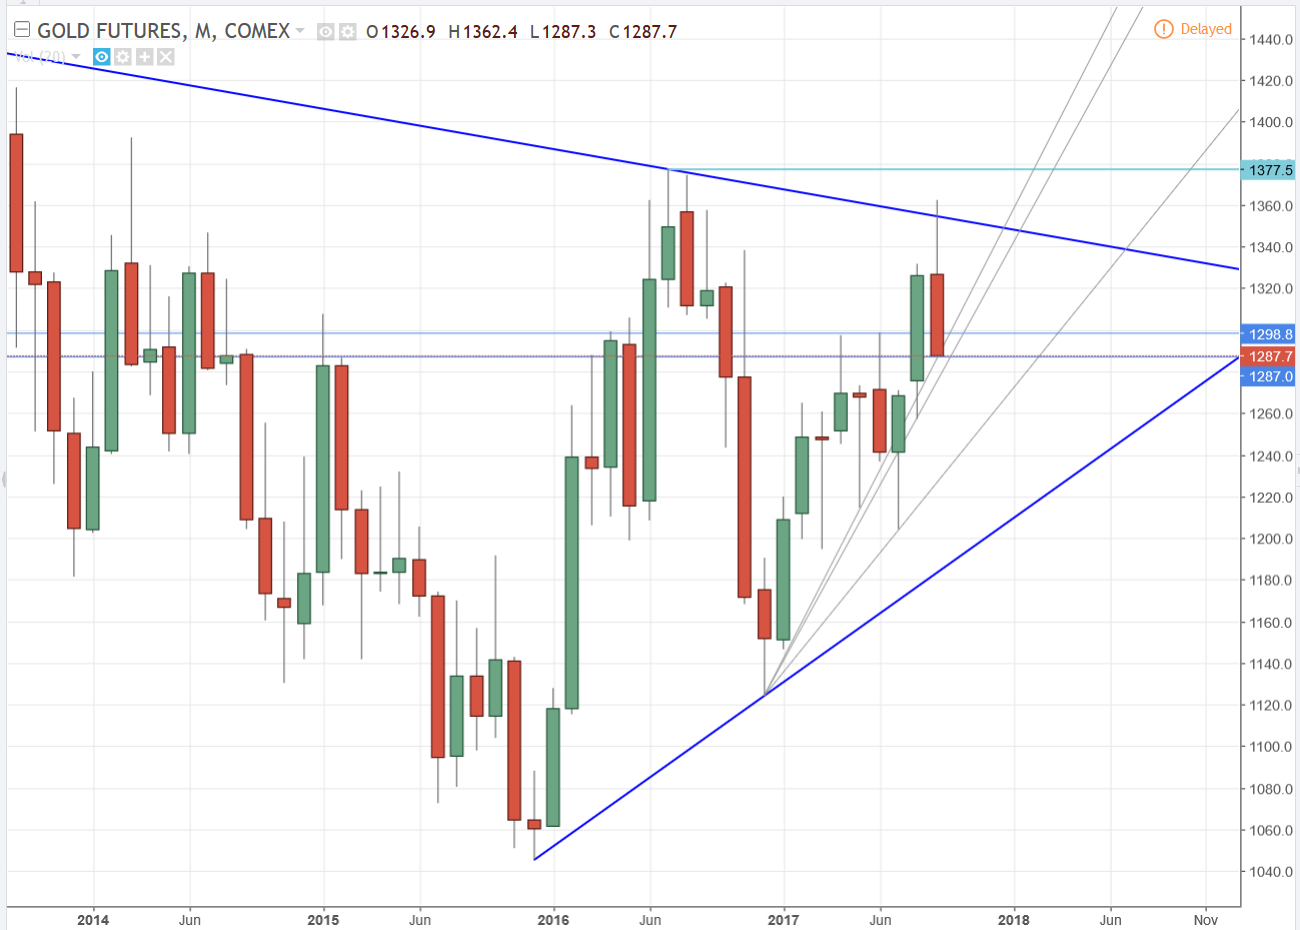
Next chart for gold is a close up of the monthly with major and minor trend lines. You can see that the first minor trend line has been violated, as expected, and so we’ll get rid of that. Gold almost pulled back to the second minor trend line support and bounced a little into the end of the week. We’ll keep an eye on it next week to see if we have some support from that next trend line.
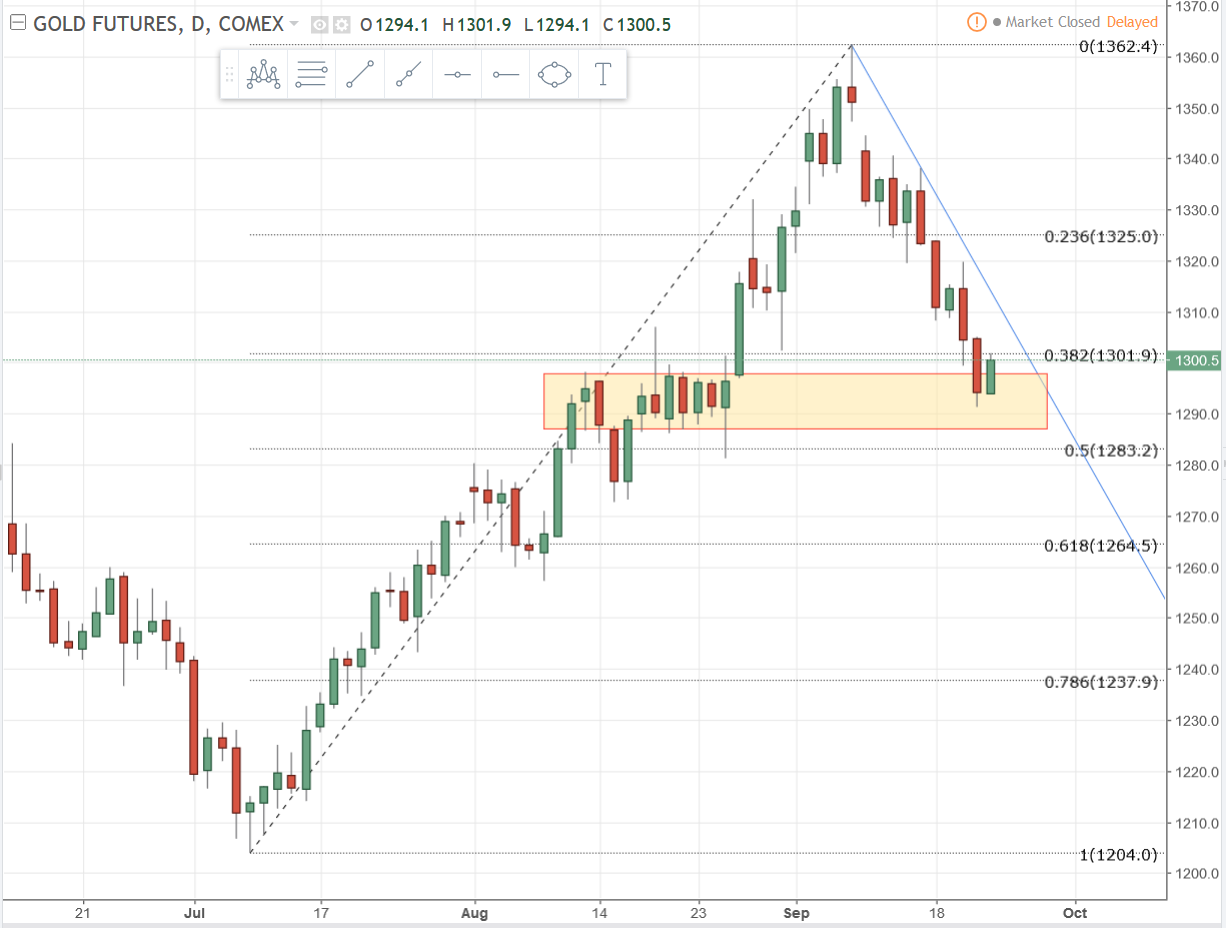
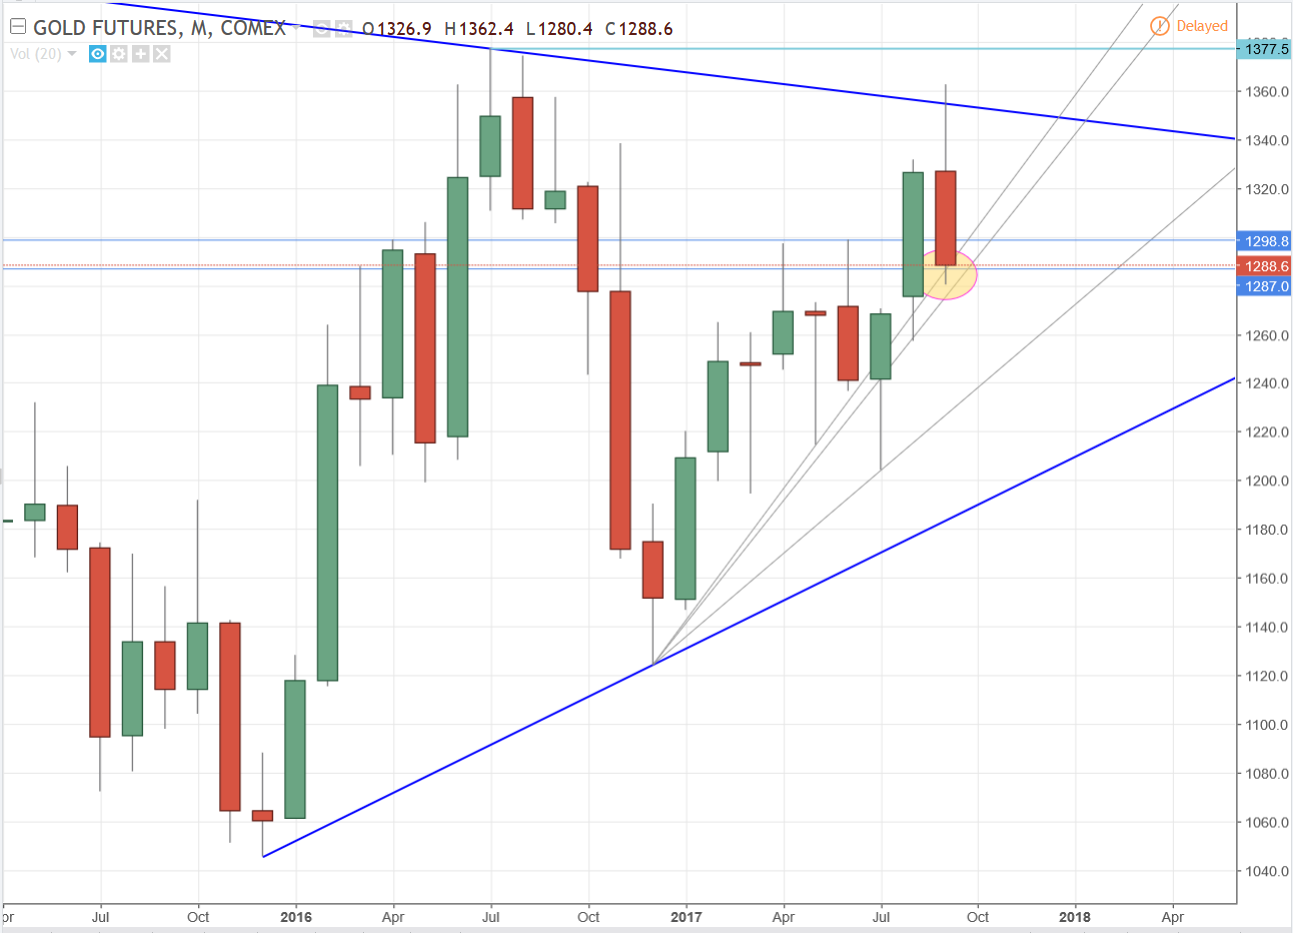
Last is a daily interval chart for gold focusing on three things. First, it has breached the 38% retracement from last July’s run and looks to be heading to the 50% mark. Second, there is a potential range of support that could be found in a previous consolidation area from 1298 to 1287, which is the yellow highlighted rectangle on the chart. Finally, we have the beginnings of a downtrend line in blue which is still new and may need tweaking as things evolve but for now that is a place to watch for resistance.
Barkerville drills 12.05 m of 72.23 g/t Au at Cariboo
Highlights:
IM-17-142: 7.54 g/t Au over 14.30 metres IM-17-142: 10.04 g/t Au over 8.20 metres IM-17-151: 16.15 g/t Au over 3.55 metres IM-17-151: 72.23 g/t Au over 12.05 metres IM-17-152: 20.07 g/t Au over 4.25 metreshttps://www.stockwatch.com/News/Item.aspx?bid=Z-C%3aBGM-2509494&symbol=BGM®ion=C
NOT MANY COMPANIES STILL GETTING THESE KIND OF RESULTS ESPECIALLY WITH SUCH A HUGE LAND PACKAGE IN CANADA
Phase II infill drillhole IM-17-151 predictably intersected a modelled veining corridor now referred to as the ‘Alpha Corridor’, averaging 158.19 g/t Au over 5.30 metres including 750.00 g/t Au over 0.55 metres, 479.00 g/t Au over 0.50 metres and 234.00 g/t Au over 0.60 metres
Thanks Rod … Stellar drill results Barkersville (BGM.V)!
As I have mentioned before Osisko has exposure here also.
Both appear to be high quality long term plays, IMO.
THIS MD&A IS DATED APRIL 18, 2017
On March 27, 2017 the Company announced that it had entered into a letter agreement with Osisko Gold Royalties Ltd. whereby Osisko has agreed to purchase an additional 0.75% net smelter return (“NSR”) royalty on the Cariboo Gold Project for a cash consideration of $12,500,000 (paid). Currently Osisko’s owns a total NSR royalty of 2.25%. The grant of the additional royalty will cancel Osisko’s royalty right which was granted pursuant to the investment agreement between Osisko and Barkerville dated February 5, 2016, however, Osisko will retain a right of first refusal relating to any gold stream offer received by Barkerville with respect to the Cariboo Gold Project. http://barkervillegold.com/wp-content/uploads/2017/06/mda-ann-2016-final.pdf
(also see Marketwired April 10, 2017 Update):
Barkerville Gold Mines Ltd. (TSX VENTURE:BGM)
Osisko Gold Royalties owns 116,372,506 common shares of BGM (35.2%) with a fair value of approximately $85.0 million as at April 7, 2017, exceeding its acquired cash price by approximately $36.3 million. Osisko Gold Royalties also owns a 2.25% NSR royalty over BGM’s land package.
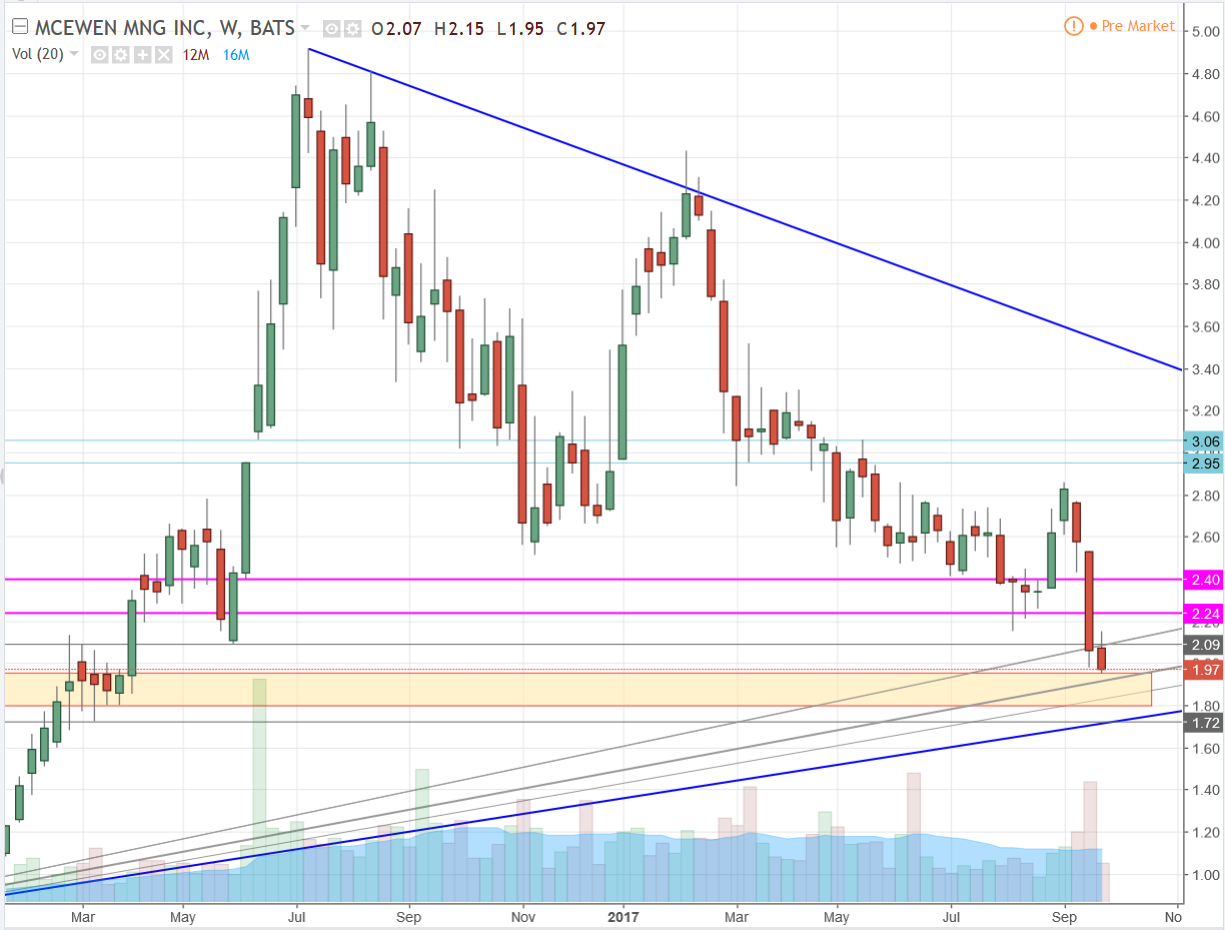
Here’s an update to the weekly interval MUX chart.
Another trend line breached, as expected, due to the close below it last week. Yesterday the low price tagged the top of the 1.95 - 1.80 consolidation range and there’s potential trend line support this week at 1.92. I tweak and add trend lines that have the potential to offer support as the price falls. If I drew them all in they would be a mess on the chart. The most viable are there now.
Outside of the realm of charting I’ll add that my “trader’s intuition” is telling me that MUX is likely to find support somewhere between 1.72 and where we are now. Yes, I could be entirely wrong, but when I watch stocks as much and for as long as I have been watching this one I tend to get anticipatory feelings when highs and lows get near in trends. I never kept records but I’m certain I’m better than 75% accurate. I’ve been away from trading for over a year now so maybe I’m rusty or just flat out broken. Let’s find out. I may even put a little money on it.
Here’s a brief monthly interval gold futures update.
Gold lost the 1300 mark last night and is currently testing the most recent uptrend line. No surprise if it continues to the next one which would take it to right around 1275.
Good morning/day everyone. Here are some quick gold and MUX updates…
First is the gold daily interval showing how, thus far, gold has retraced 50% of its climb from 1204 and may be in the process of heading back up, although that’s too soon to know for sure.
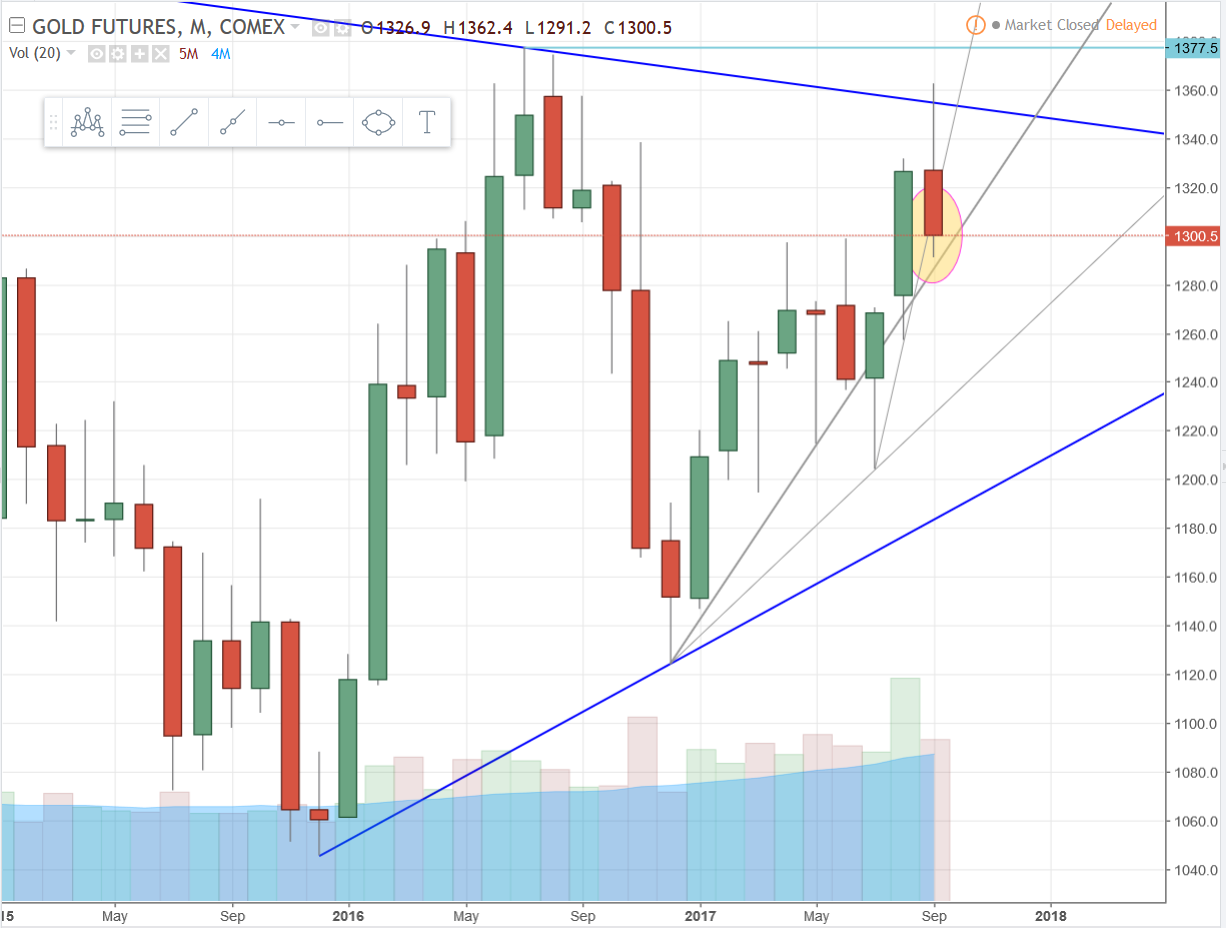
Next is a closeup of the gold monthly interval chart highlighting the support gold has found thus far from those two uptrend lines. Still two days to go before that candle is complete.
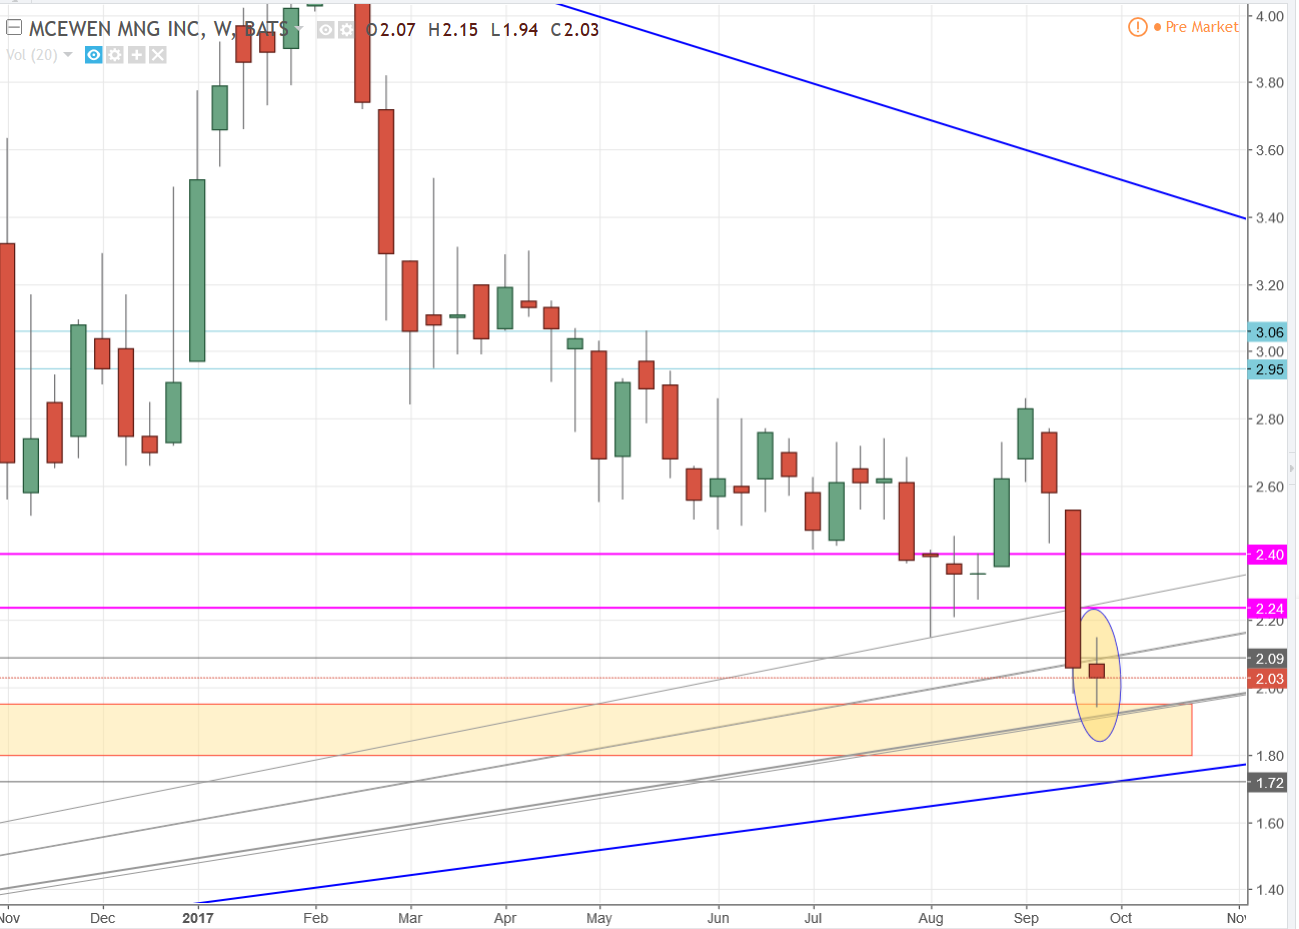
This is a closeup of the MUX weekly interval chart. It didn’t quite tag the uptrend line. Maybe it will, maybe not. It did come close and it bounced off of the top of the 1.95 - 1.80 range. I wouldn’t be surprised if MUX has seen the low of this decline, but it’s too soon to tell in my opinion. I’ll use the daily interval chart to try to determine that in coming updates.
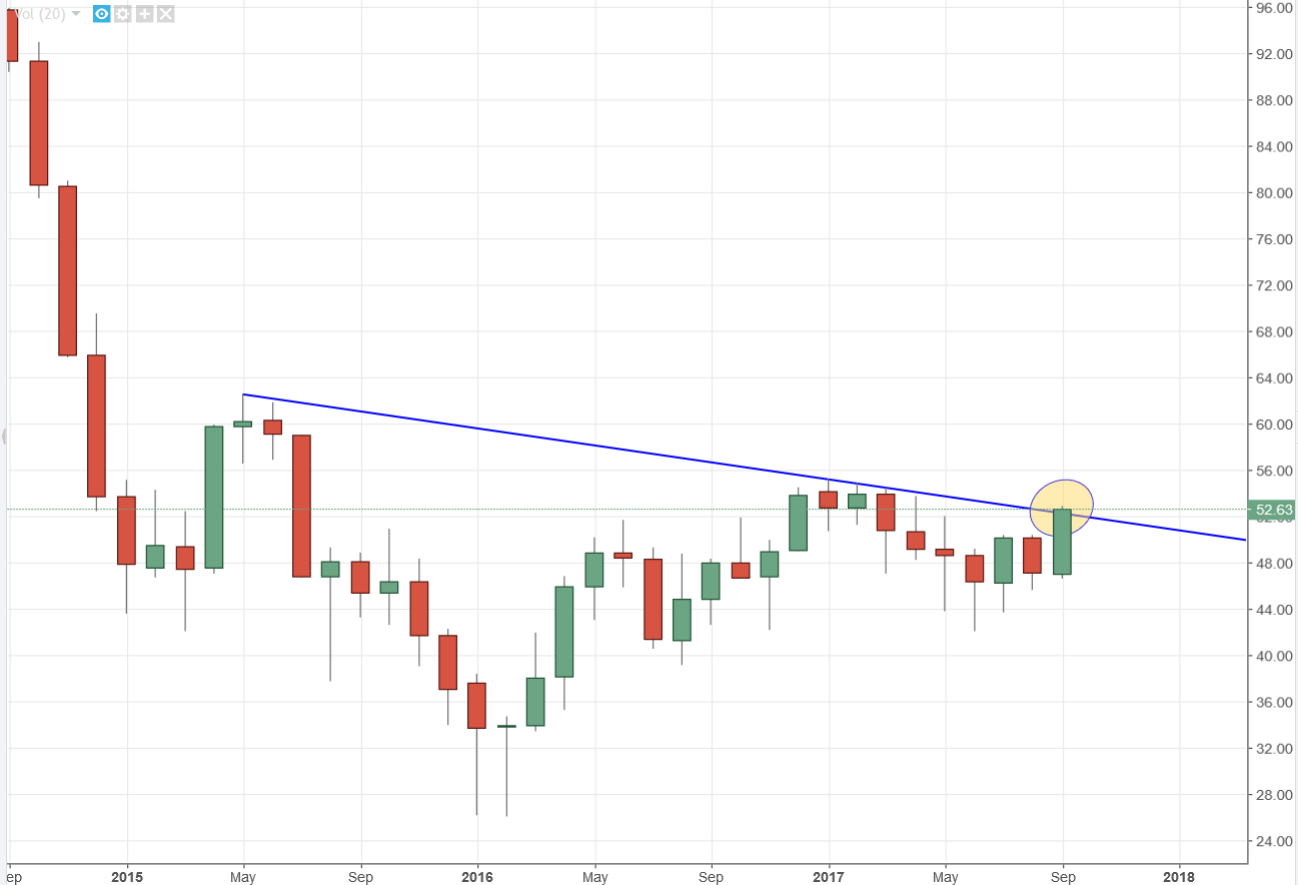
For those who might be interested, crude oil appears to be breaking out of the gradual down trend started in May of 2015. (I say gradual downtrend because anyone who keeps track of oil knows it made a much more dramatic drop prior to the period I’m discussing on this chart, which could actually be considered a consolidation phase). It could pull back in the next couple days and head lower, but the thing to pay attention to is that oil could be breaking out of an inverted head & shoulders bottom which, if it plays out, projects oil to be back in the mid 70’s to low 80’s price range by the second half of 2018.
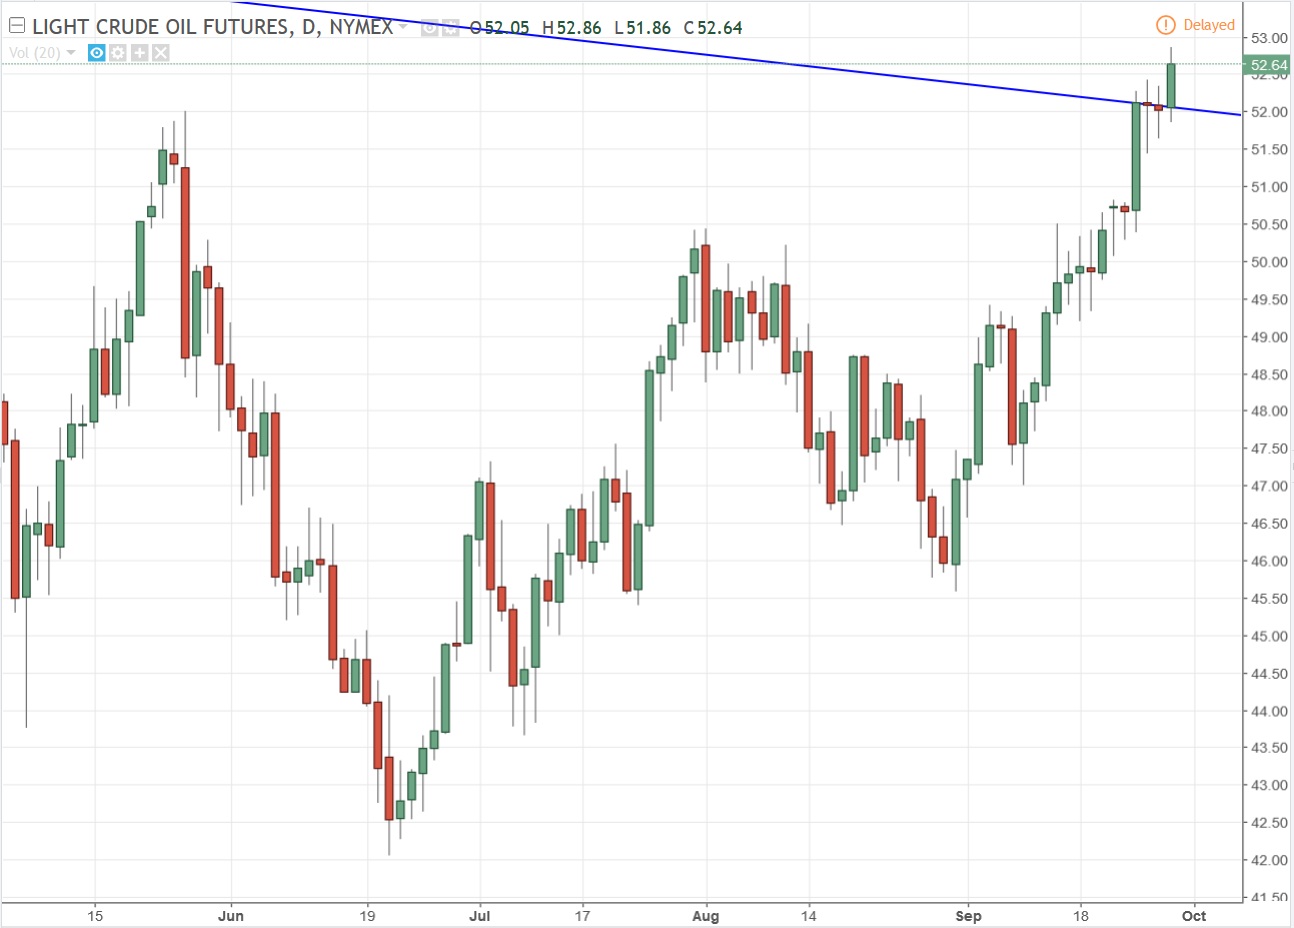
The first chart is a monthly interval, the second is the daily. On the daily, note the current candle opened right on the blue trend line, so there is the possibility that oil could drop .70 or more from where it is now, which would end up making this a false breakout. I’ll update in the near future.
For those watching MUX closely, which I am now, 2.07 is the very shortest term resistance it needs to get above to have the beginnings of showing a reversal, imo. I’m still on the sidelines waiting to buy some just for fun.
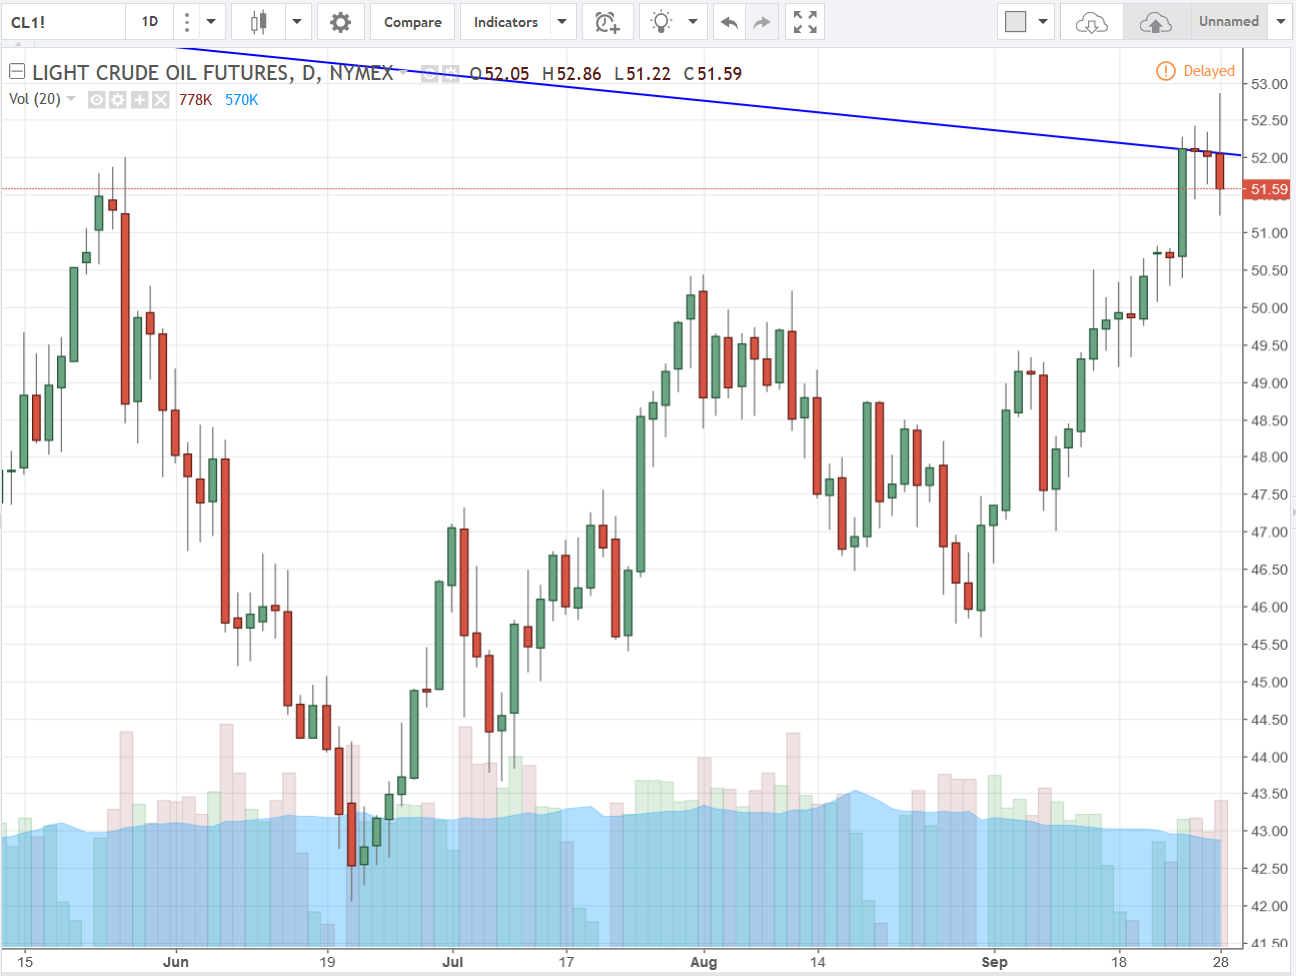
And here’s another perfect reason to wait until the candle is done forming! Oil in fact dropped over a dollar from when I posted the chart this morning. This morning’s chart probably had a lot of oil bulls loading up on positions, and if they didn’t stay on top of the trade all day they are now in a bad position with the potential for much worse.
This opens the opportunity to share a valuable tool I learned from my futures trading which is to draw as many trend lines on all time frames as you can see and then pay attention to how candles form in relation to them, especially the candle bodies!
If you look at the chart I just posted, notice how the last four candles, today’s included, illustrate what I’m saying here. The last three day’s candles all opened right on top of the trend line. They all moved higher during the day, giving the impression of a breakout, only to drop lower and close on or a little below the trend line. The first of the last four candles had a very bullish day which popped a little above the trend line and then dropped to close right on it. You can even see that the second and third candles formed a bullish pennant, further reinforcing oil bulls mindset that oil was going to break out bullishly. Then they get all caught up in their perceptive hype, getting long anticipating a big score, only to get burned by the end of the trading day.
So the lesson I learned when using trend lines on any time frame is to pay very close attention to where every candle opens and closes in relation to any trend line you have drawn, and in instances when a candle opens right on the line and looks like it’s going to do one thing, it may very well do the opposite… and most of the time it WILL do the opposite. This is why I used to trade very short time frames… minutes and seconds… with futures because there are so many fakeout moves that you’re better off taking the quick profit because you never know when a breakout is real or a fake out.
At this point I have an expectation that oil will head back to test the 50.50 - 50.00 area again, and then possibly drop back as far as even the mid 40’s.
Algorithms have made the markets more difficult to trade imo. I’m sure they are designed as much to shake traders out of positions as much as anything else they do.
Well, getting out a little too early to assure a profit is certainly smarter and better than some of the lessons far too many posters here have learned the hard way. One can’t go broke making a profit on a trade!