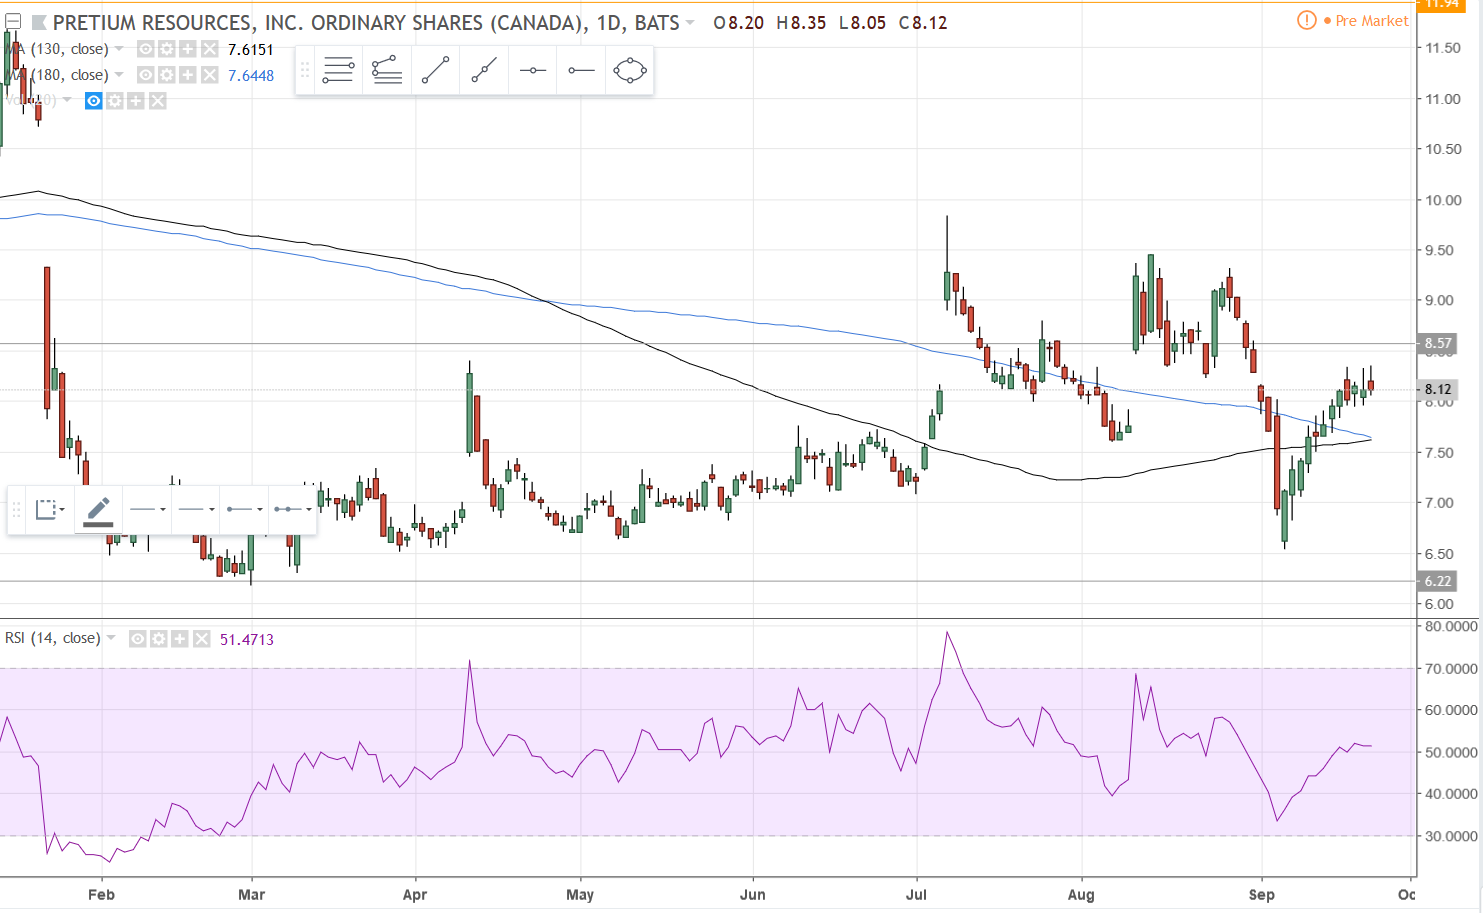
FUND: The daily interval chart is clearly in a bear flag…
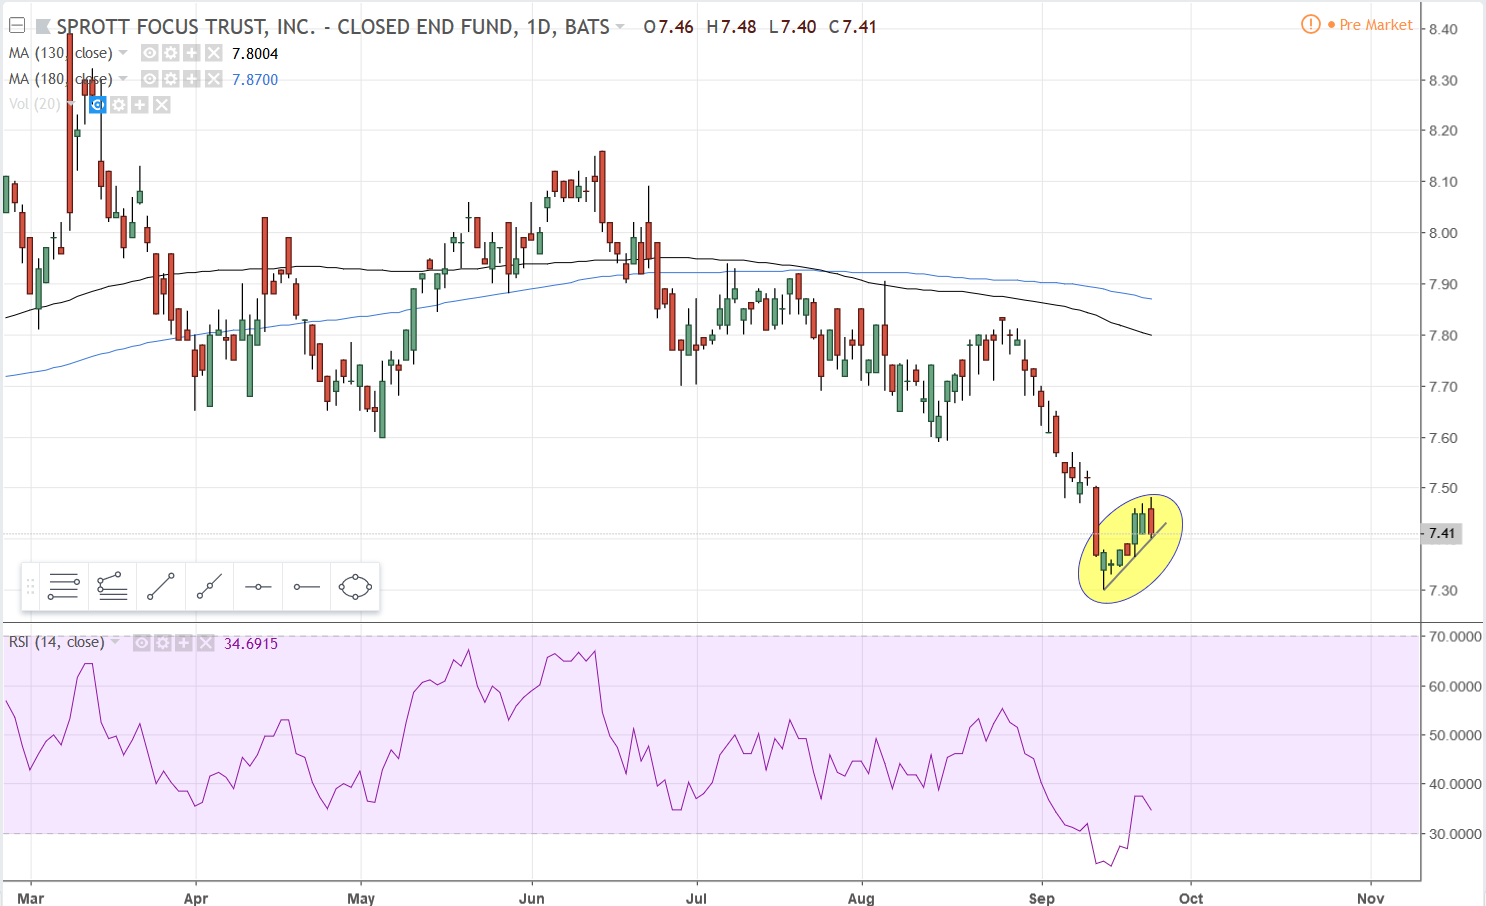
…or is it?
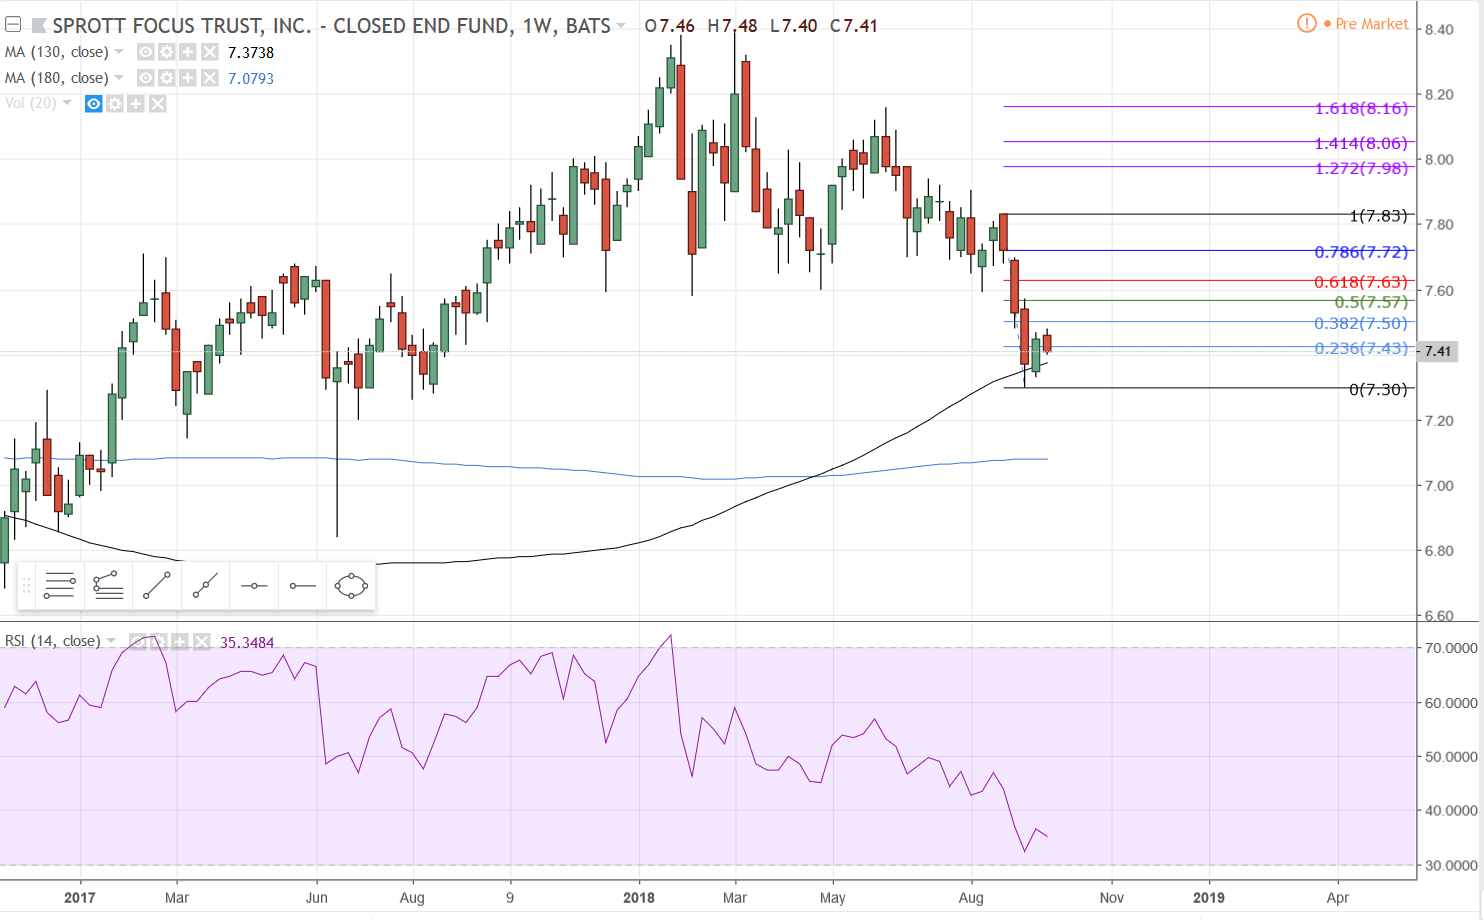
If this is a bear flag then it will break the 130 MA support on the weeky chart and likely head for the 180 MA at 7.07 next.
FUND: The daily interval chart is clearly in a bear flag…
…or is it?
If this is a bear flag then it will break the 130 MA support on the weeky chart and likely head for the 180 MA at 7.07 next.
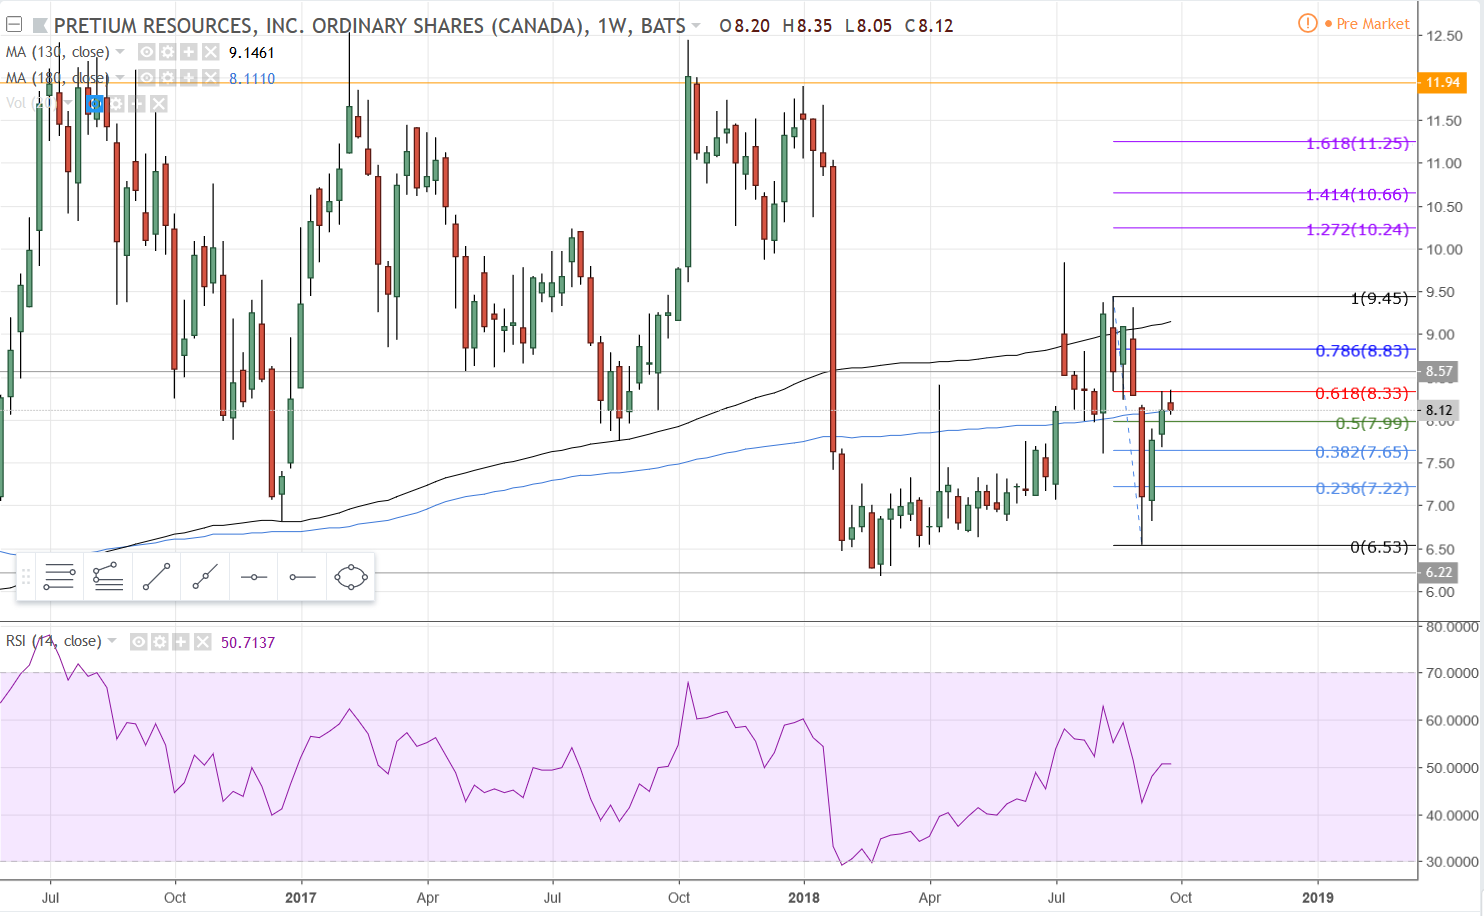
PVG Daily Interval has risen close to $3 in the past two weeks, blasting through 180 and 130 resistance.
On the weekly chart you can see that it has moved up through the 180 MA, but is finding resistance at its 62% retracement. If the 180 support wins, next stop is to the 130 at 9.15. If the 62% retracement level wins, then I watch for a pullback between 7.44 and 7.20 and see if support is found somewhere in there.
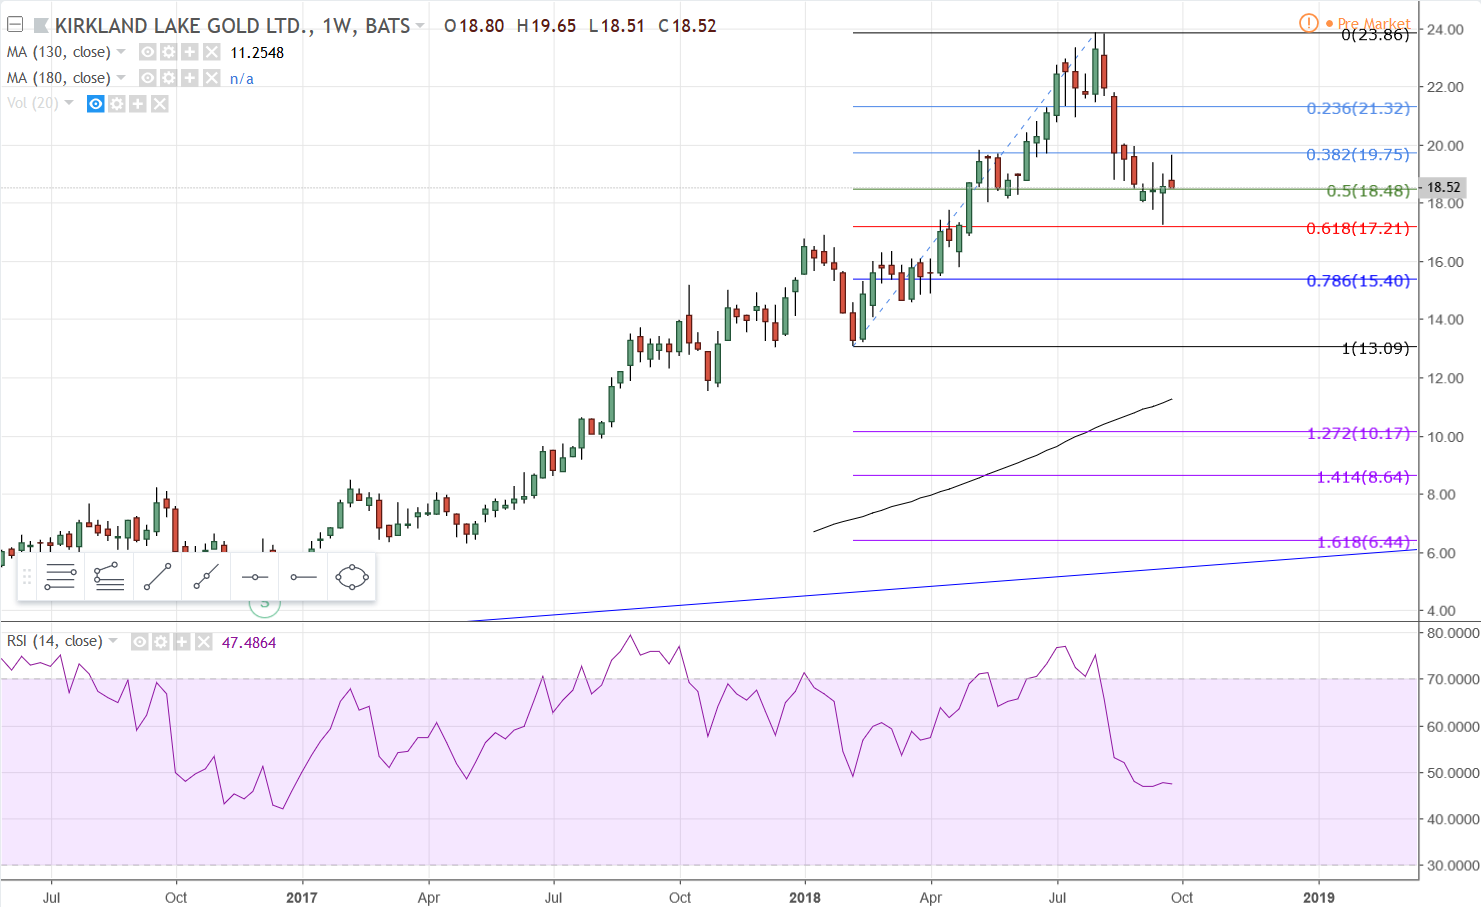
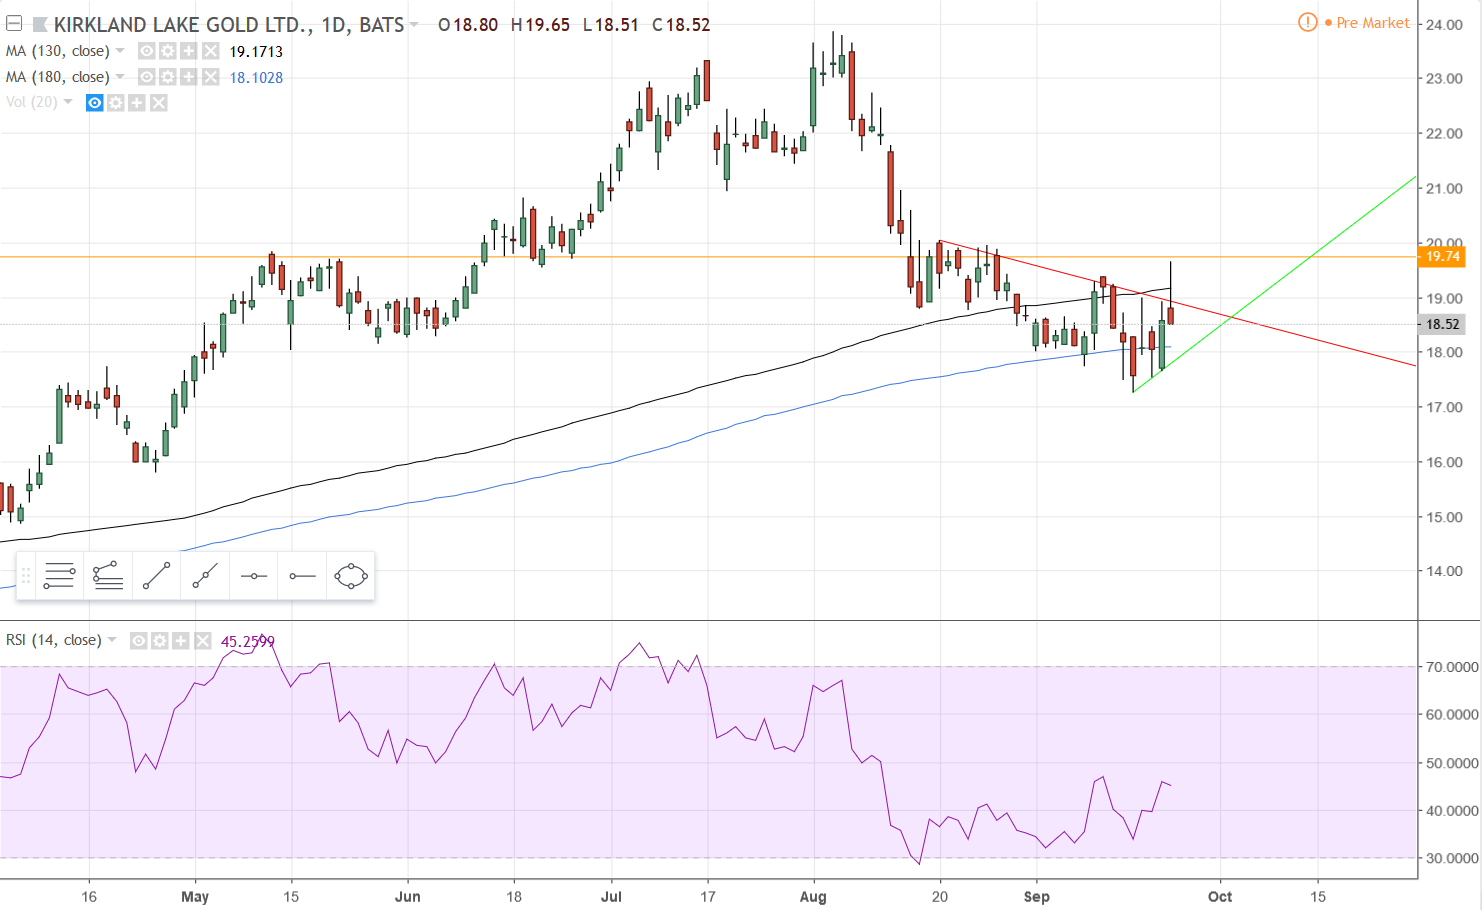
KL weekly interval has so far found support at its 62% retracement…
On the daily interval, it has so far held support at the 180 MA and looked promising breaking through the 130 MA early, but was unable to get through the resistance area at 19.70 - 20.00. It appears there will be another test of the 180 and perhaps the green uptrend line.
I’ve got 4 more 5 letter OTC stocks on my list here, but that’s all I have time for right now.
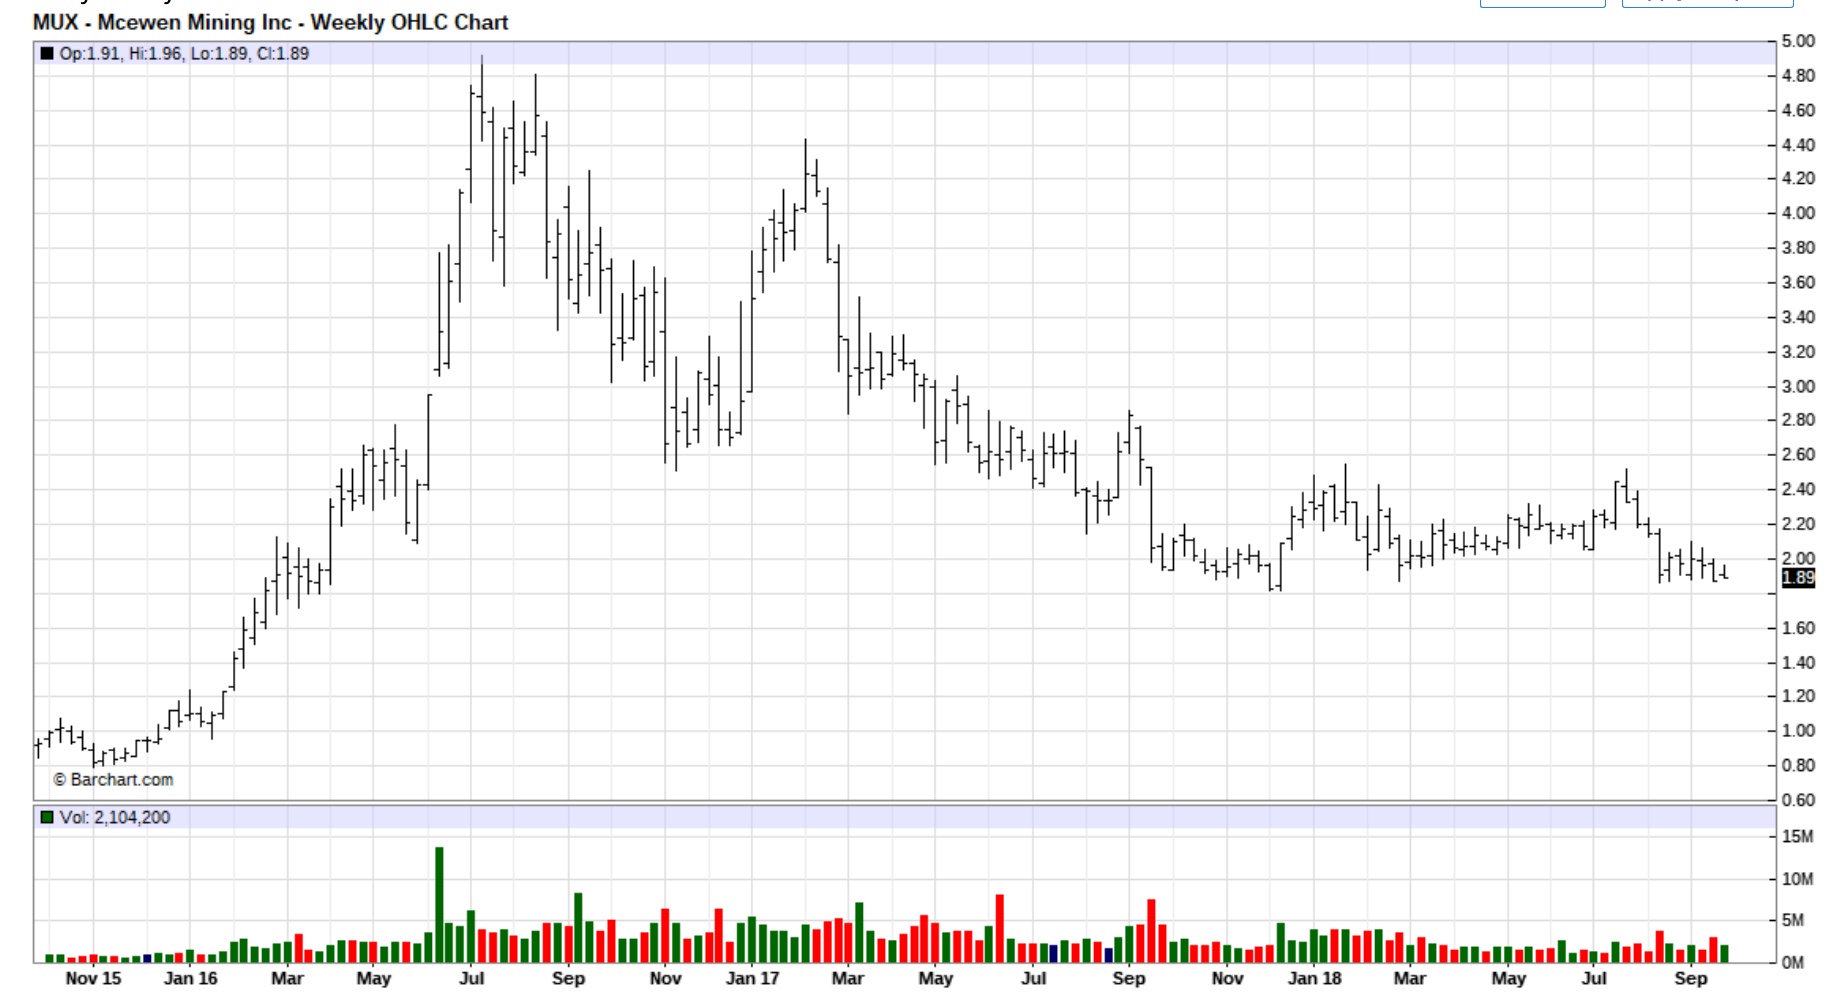
Must be new math, not sure how Rob figures MUX is up 80%
Yes he said since 2016 but since last year around this time it has been flat.
Good luck on this stock, I’m doing the same thing, I was very fortunate to get in at .22 but I think there is great opportunity to make some $$$ with the volume of trades.
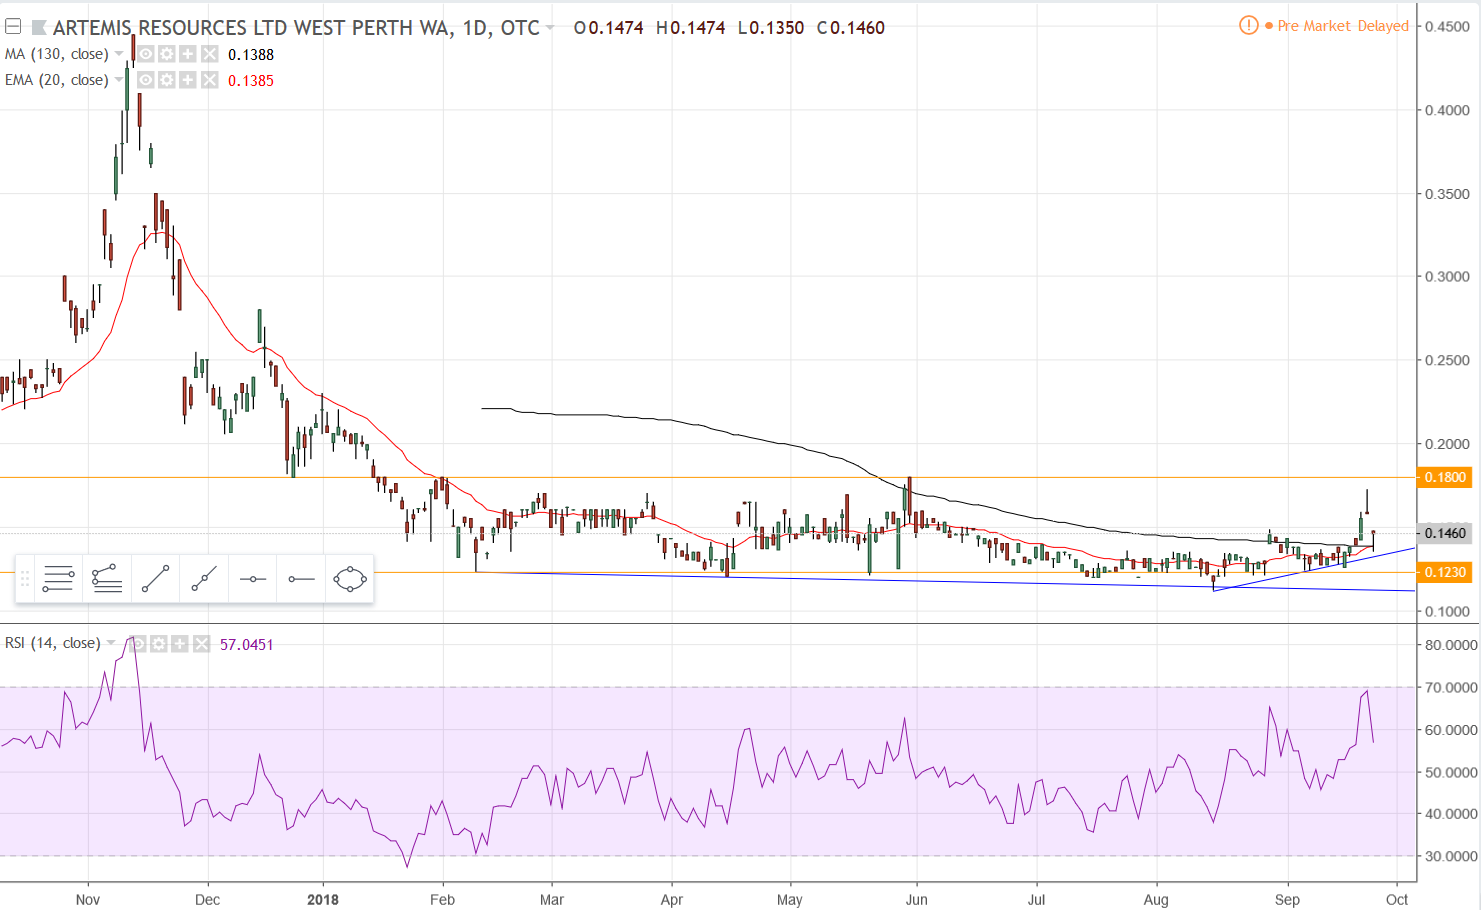
ARTFF
This is a compressed daily interval chart. The stock hasn’t been trading a full year yet so larger intervals aren’t very useful. The far left side of the chart shows how the red 20EMA works like a champ for support and resistance when this stock is trending. For now the t/a on this one is pretty simple; buy around .12 and sell between .15 - .17 and occasionally you may get to .18. That is the range it has been in for almost the entire year. It may have started a new uptrend in mid-August, indicated by the blue uptrend line. So far, so good with that but stocks priced this low don’t follow trend lines as nicely as higher priced, higher volume stocks so for now I’d stick with the .12 - .17 range if you’re trading. If you’re investing it’s pretty clear to tell where the cheap shares sit for now.
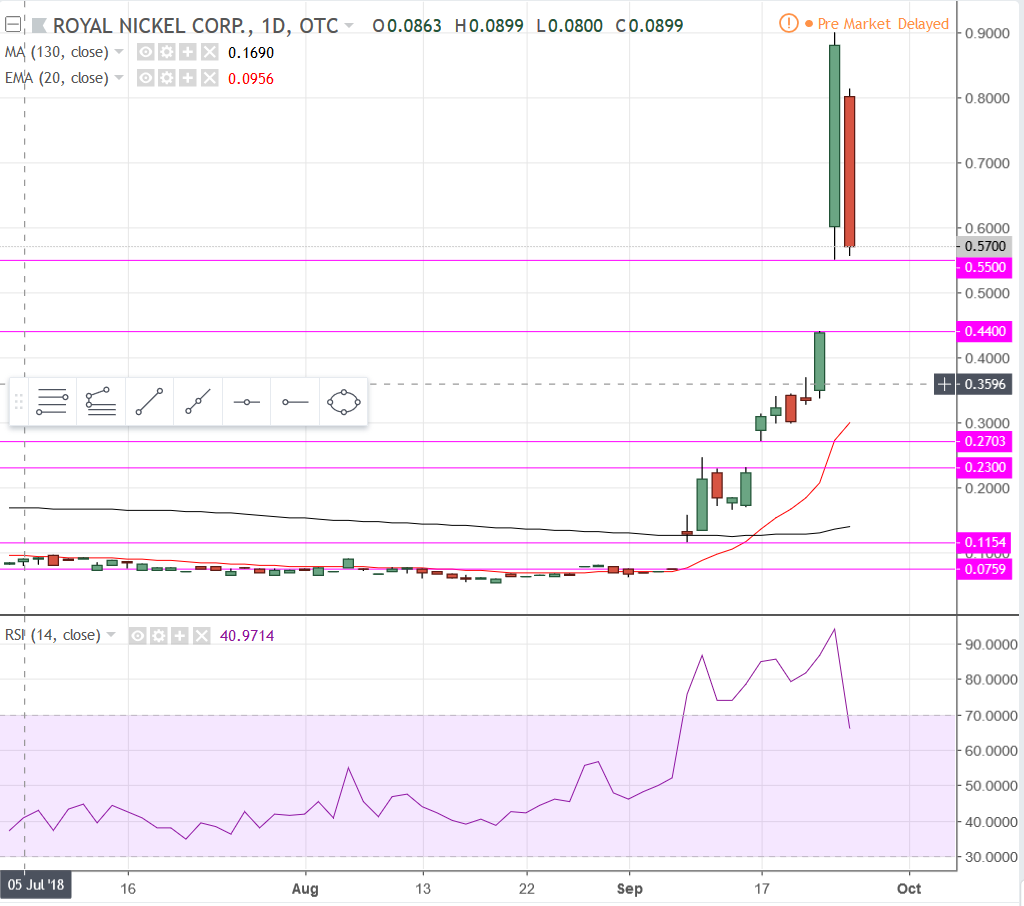
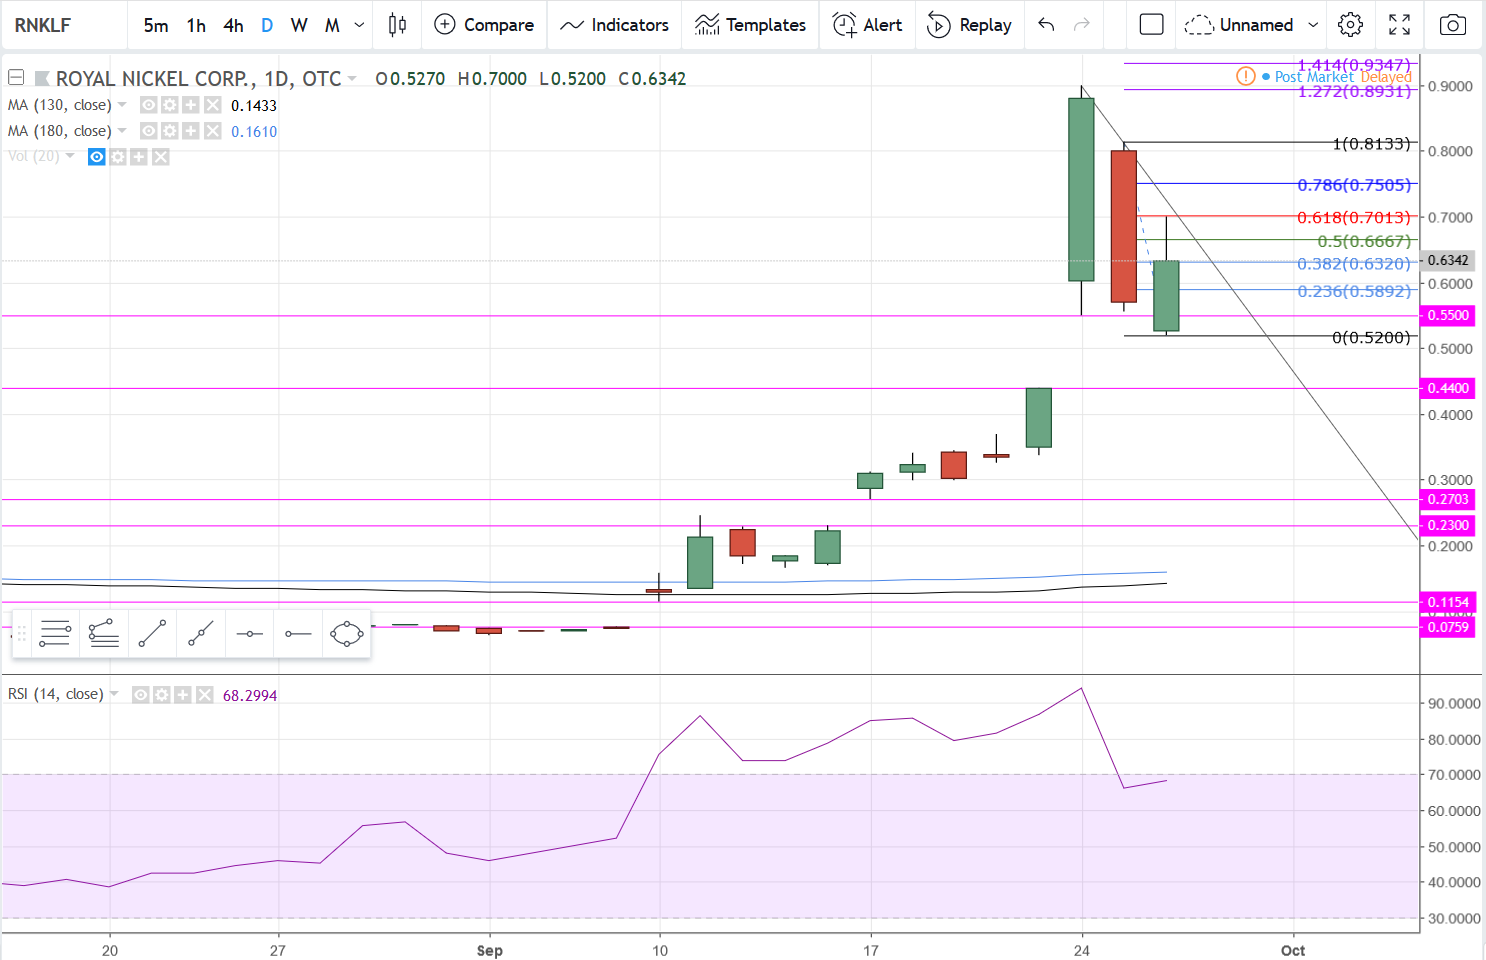
RNKLF Daily Interval
If anyone here who has been reading my TA posts for any length of time bought this stock after it closed at .44, (for more than a quick intra-day trade), you really need to pay more attention and you created a wonderful lesson for yourself. The lesson is, It’s always better to be out wishing you were in than to be in wishing you were out. There is ALWAYS another opportunity and/or another stock.
Anywho, this one is pretty simple as well. There are three gaps that you can now watch for support/resistance levels. The first is at .44, then .23, and then .0759. Gaps, when they do get filled, and they often do, generally get filled fairly quickly after they are made. I know nothing about the fundamentals of this stock, but based on yesterday’s candle I feel pretty comfortable speculating that .44 will get filled today and .23 by the end of trading Friday.
If this move was legitimate then .23 may struggle to get filled and watch the red 20 EMA. If it acts as strong support then the stock can resume the uptrend from there.
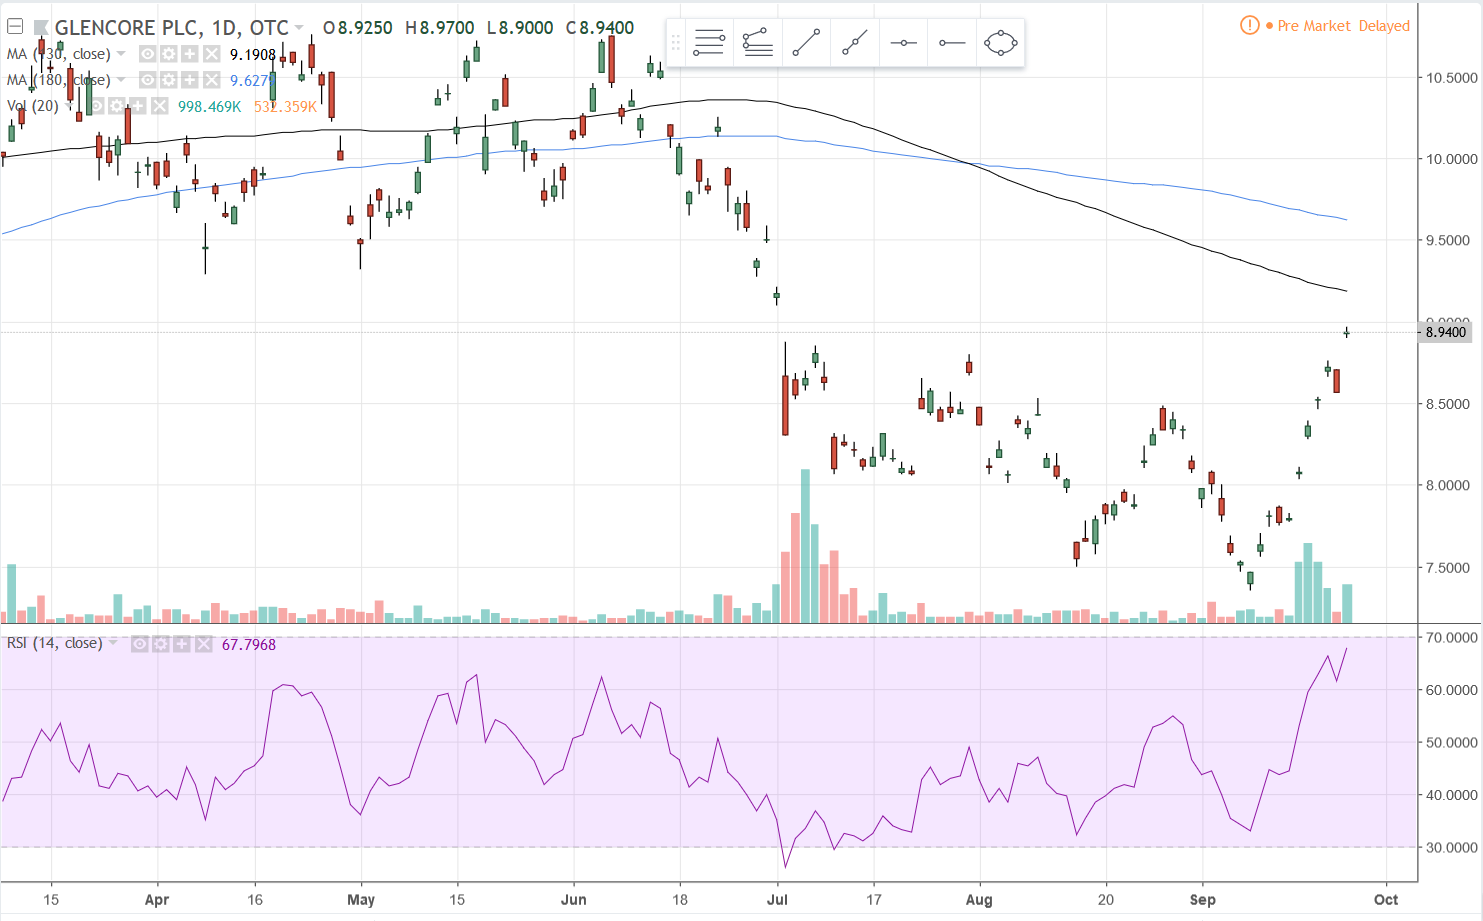
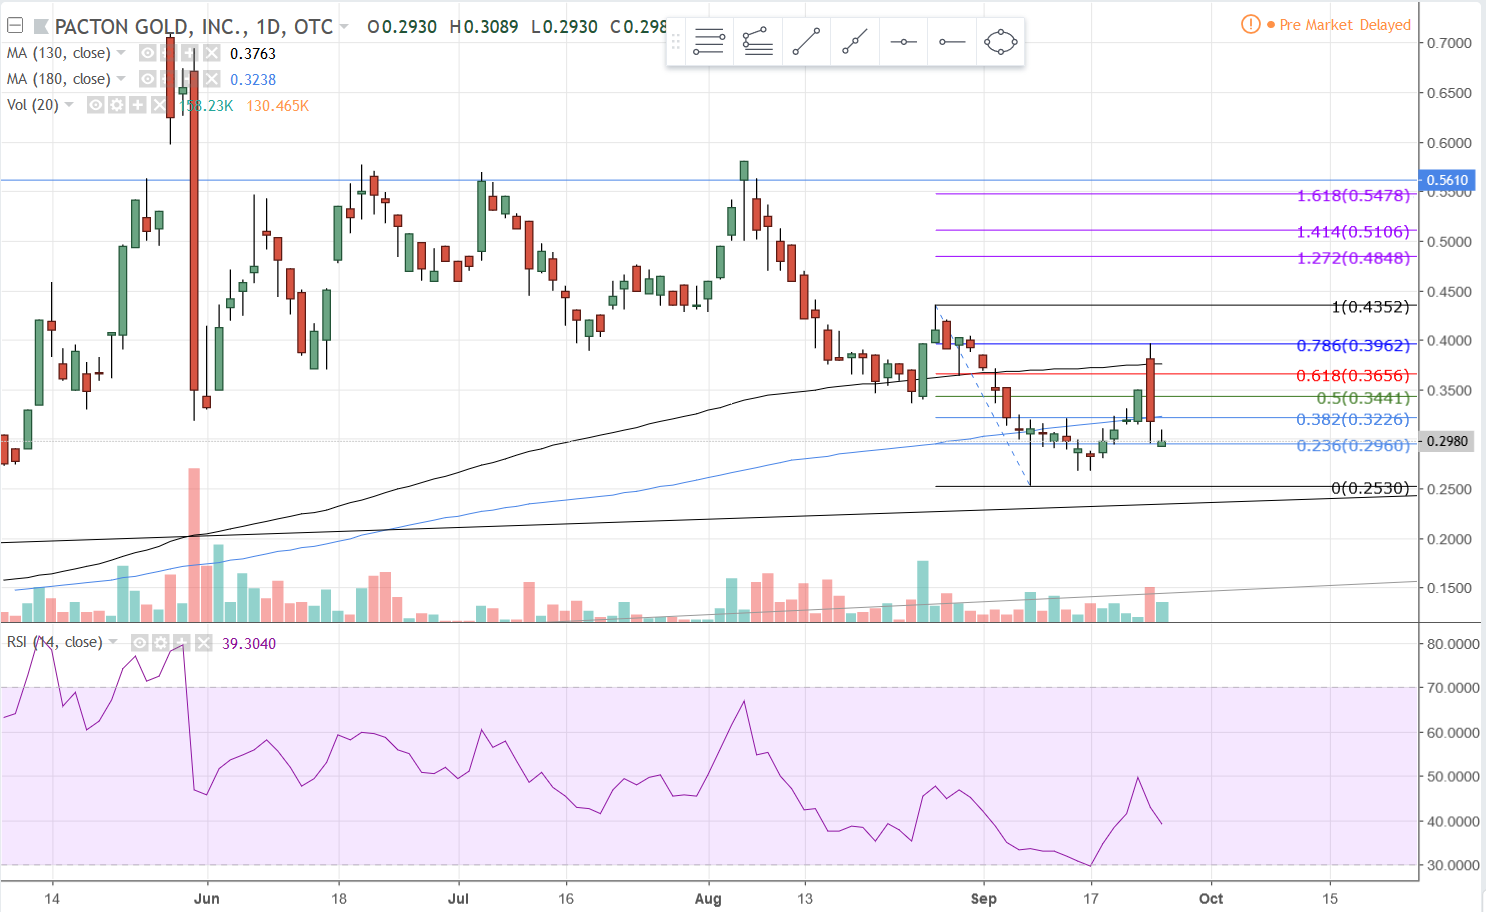
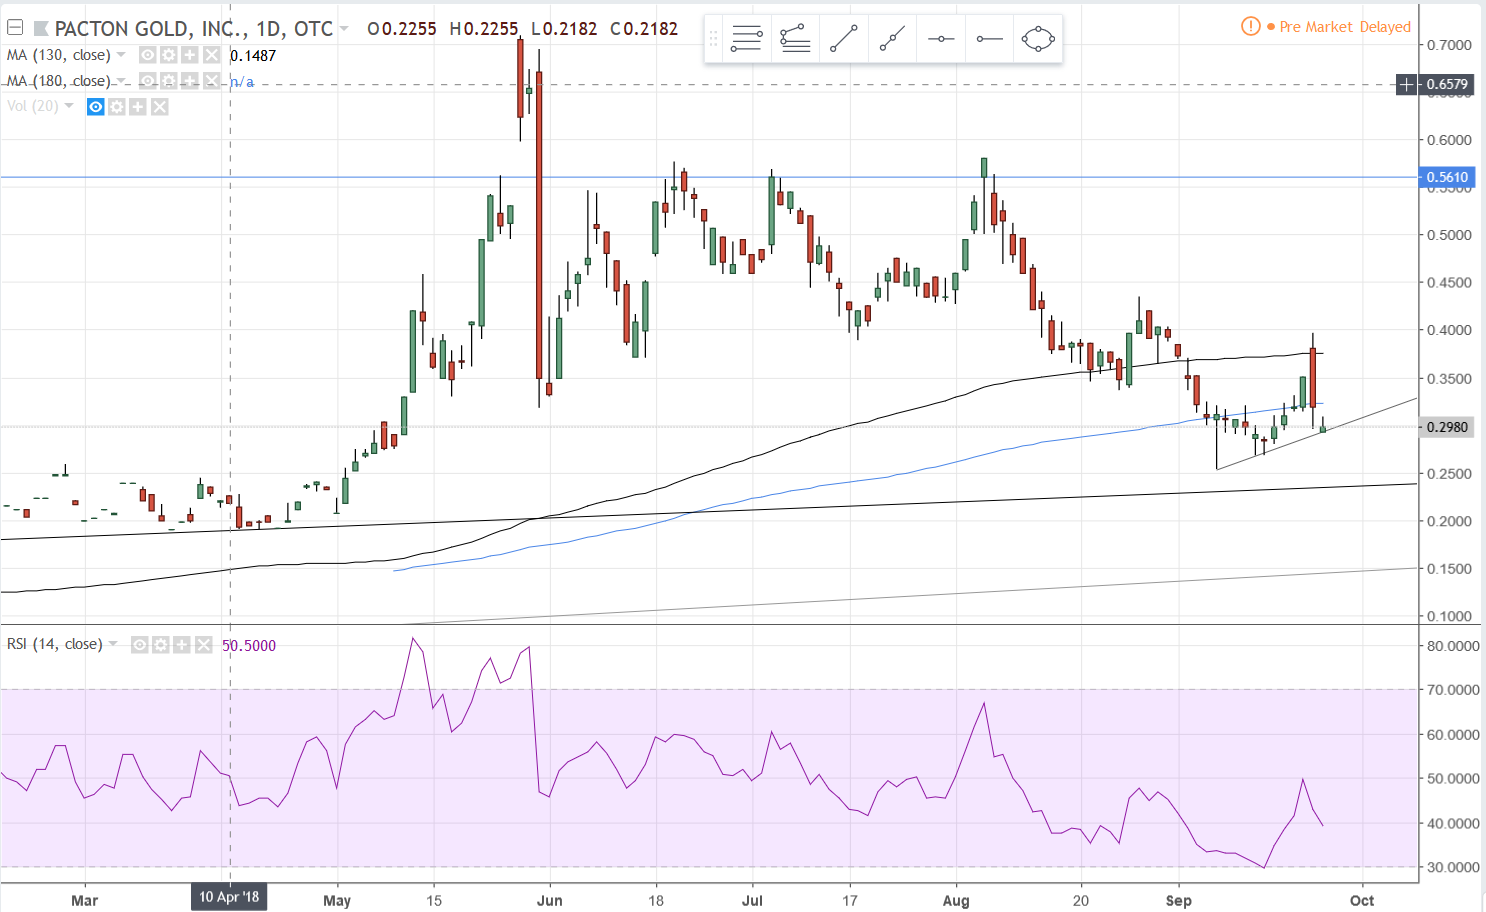
PACXF Daily Interval Charts
This one didn’t like the 130 MA yesterday and then decided it didn’t like the 180 either. It did hit the .786 retracement level before doing so.
Now watch to see if the fresh trend line support holds up or if it’s going to revisit older trend line support around .23. So far it’s still in a downtrend. If it’s working on a bottom it isn’t very convincing at this point.
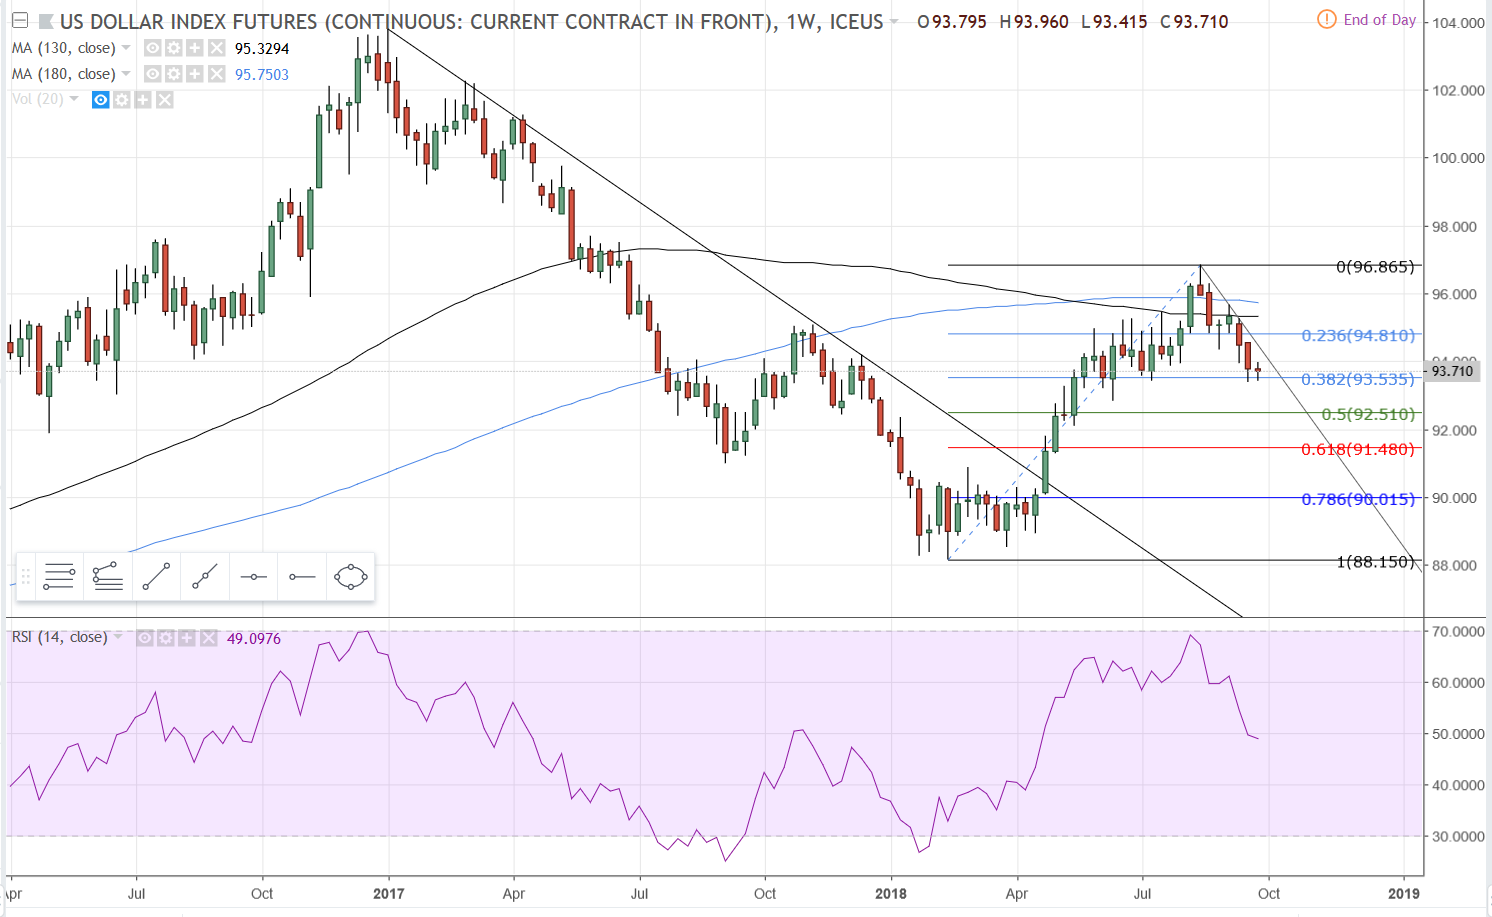
Dollar Weekly Interval
After breaking above its downtrend line, the dollar made a run up to the 130 MA where it consolidated for a couple months and broke above both the 130 and 180. It managed to hold that position for two weeks before falling back below both MA’s and is now sitting at the low level of its prior consolidation, which is also the 38% retracement level. Note the 130’s cross down over the 180, a bearish sign if only temporary. The 180 is showing only the slightest sign of turning lower while the 130 appears to be leveling out after a slight downward slope.
The daily interval shows a stealthy little head & shoulders top. It has found support at the 130 MA and appears to be making a bear flag, perhaps for a trip down to the 180 to fulfill the measured move of the formation. It is getting into oversold territory watch the downtrend line resistance on any move higher.
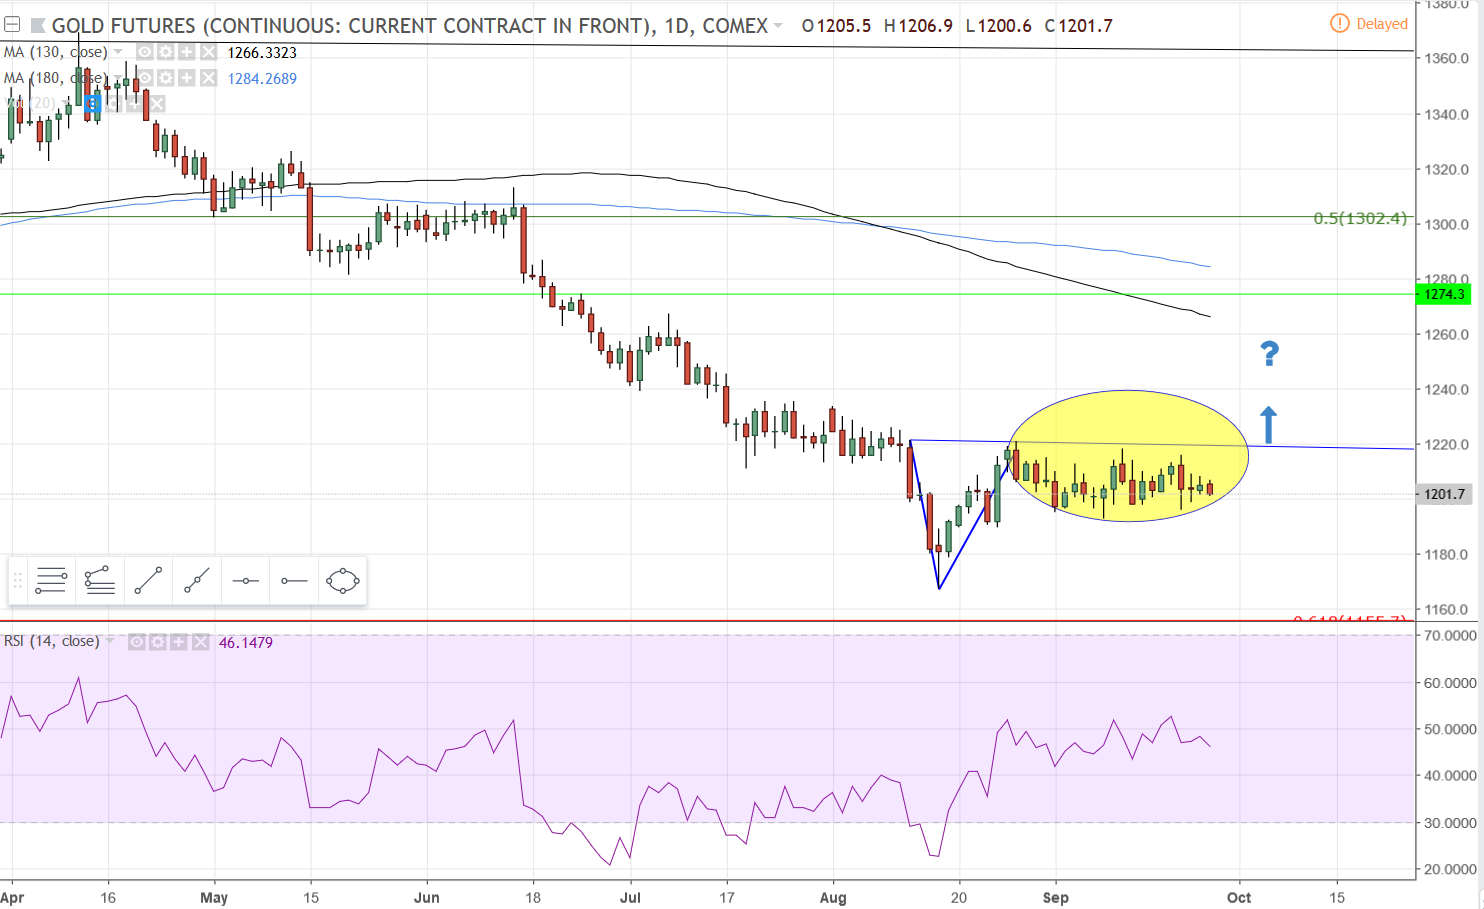
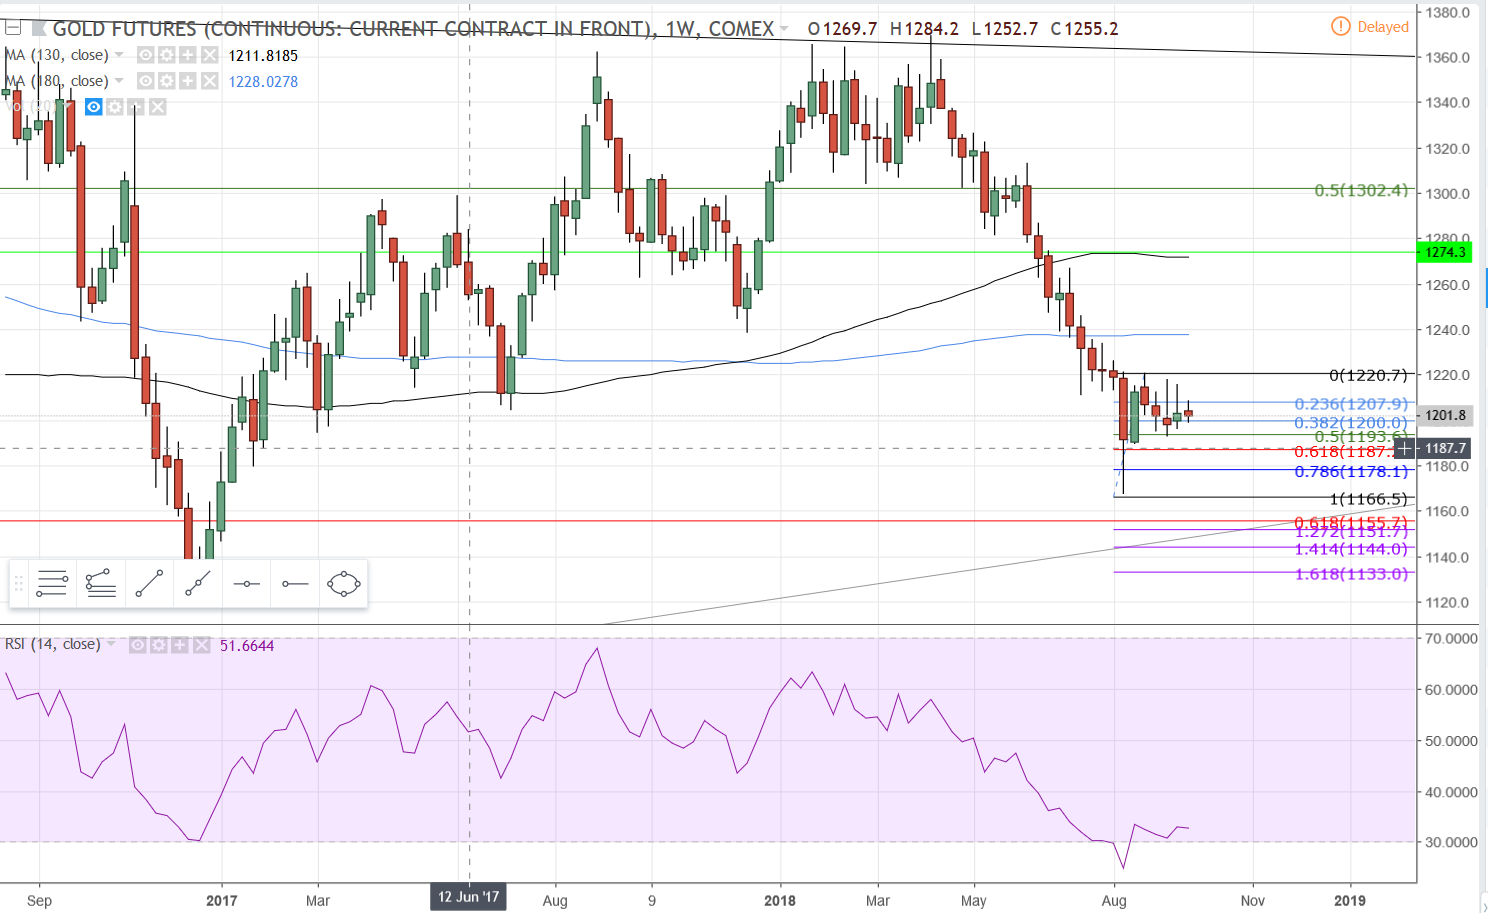
The time on this potential adam & eve bottom formation on the gold daily chart is running out. If it doesn’t happen by early next week then I’m surrendering the idea. Regardless, it is a nice consolidation with the 50% retracement of the low holding nicely thus far.
Here’s the weekly chart, showing the 50% level support thus far. The consolidation is tightening with higher lows and lower highs each week for the past three weeks thus far. The RSI shows gold being very oversold as well. I still think there’s a great chance of a run to the 130 MA and the 1274 target, even if it does take longer than a week from now.
You had me worried, dropped to .52 but closed at .6342
The TSX was where the action really is…46.2 million shares traded between .66-91 closed up at .83
I’m holding out for one more good NR 
Sorry Elrac. Keep in mind, I made a point to write that I have no knowledge of the fundamentals of the stock. I’m only coming at it from the technical side. So far it has held up better than I anticipated.
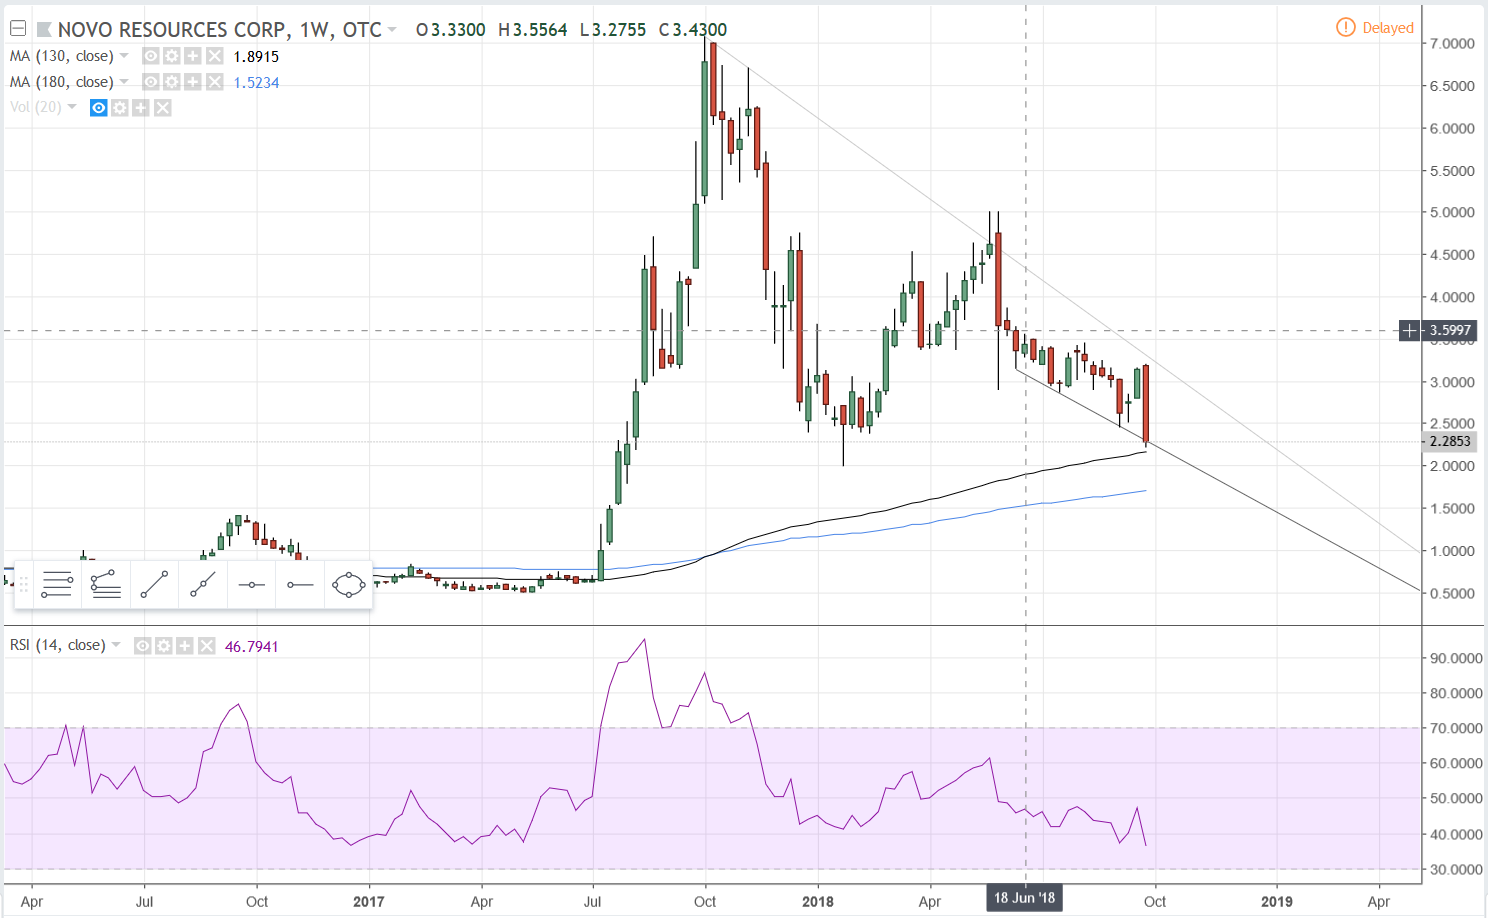
Here’s an update of the OTC version…
Today it gapped lower at the open and proceeded to retrace 62% of yesterday’s candle from the morning low. You’ve got downtrend line resistance being established now, and those gap levels are great potential support areas to watch. Yes, it could be flagging for another move higher, but after this kind of run no matter what the fundamentals are I would be waiting for things to settle down before getting in unless I saw a good short term trade setup. Too often moves like this end up being setups for unwary investors to help the short term guys unload their positions before the stock takes a dump. Having said that, If the fundamentals are great and you know the story and are comfortable with the stock at this price then forget about what I write because I don’t have any of that information. ![]()
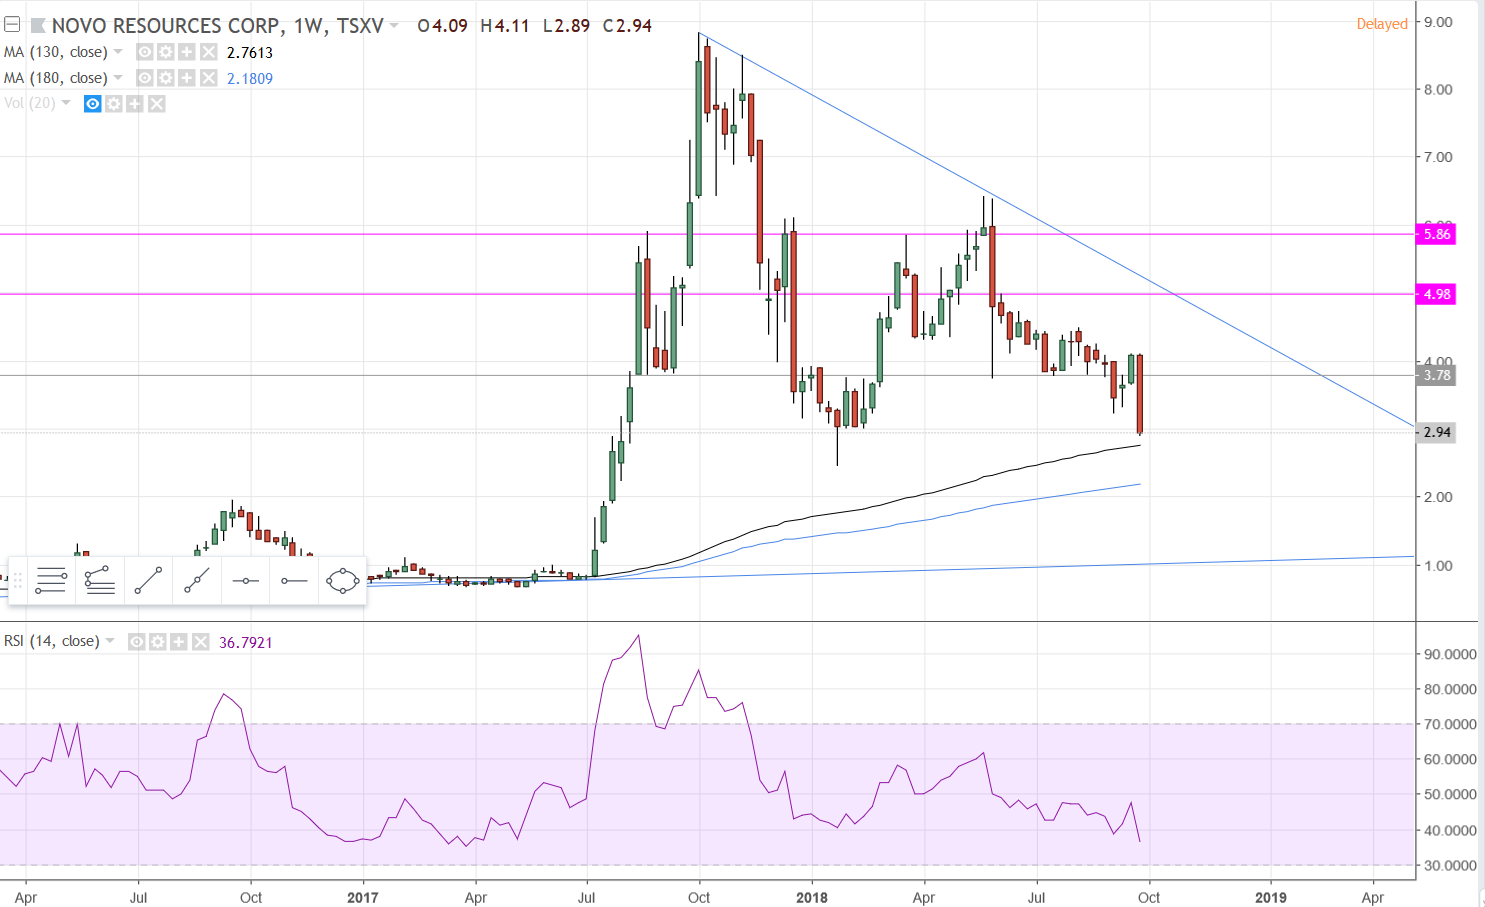
NSRPF Weekly
Approaching the 130 MA on the weekly chart. RSI oversold as well. Watch for support. Same thing going on with the TSX stock.
I took a calculated risk and averaged down on NSRPF at 2.25 yesterday. Felt it was way oversold with RSI divergence and felt a bounce was close. This is just a flip trade around a core position though.
Nice one Rick.
Nice move